12 charts from the Oct 6 close
Every chart worth your time today, best first. Drawn from S&P 500, Nasdaq-100 and the sector, country and theme ETFs: 551 had a bar at this close and 31 printed a reading.
▲ green broke up ▼ red broke down ◆ amber no direction hollow candle = up day amber ring = the bar where the reading printed
|
01 · CEG · Outsized session
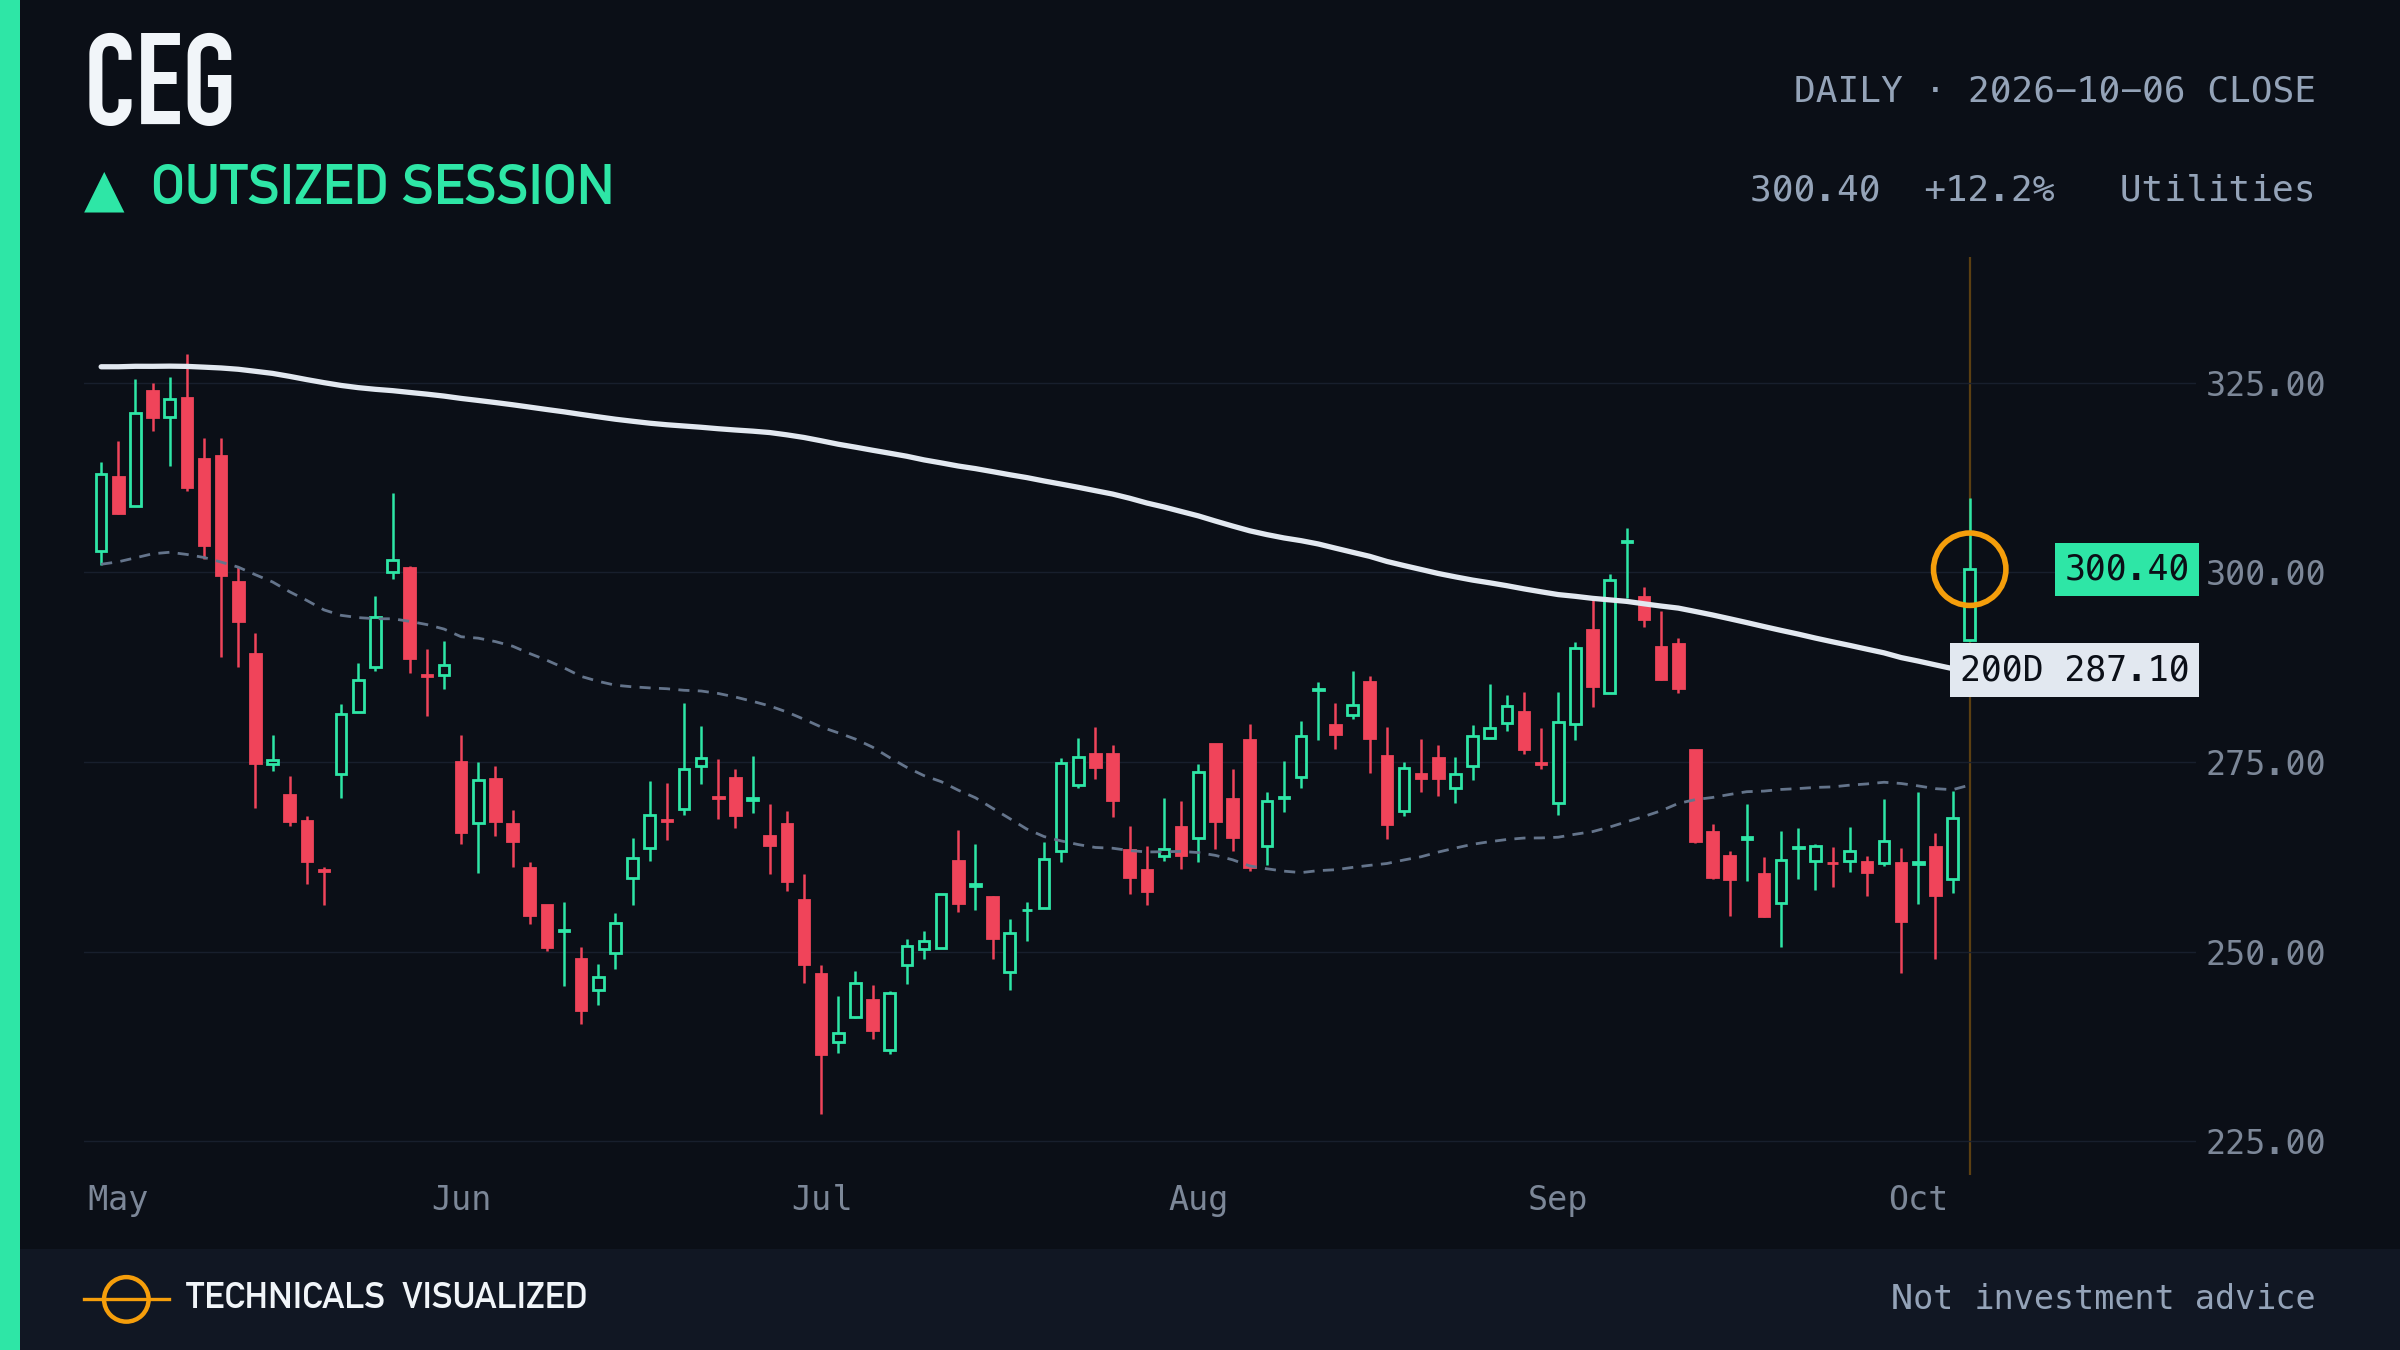
CEG moved +12.2% in one session, 5.0 times its usual daily move. One session, measured against this chart's own usual move. It describes the day, not the next one. |
|
THE REST OF THIS EDITION IS FOR SUBSCRIBERS
11 more charts from the Oct 6 close, listed below by name. Subscribers get every chart, drawn and captioned, in their inbox each morning. Get every chart by email |
|
02 · VST · Volume surge · subscribers
|
|
03 · ALAB · Range breakout · subscribers
|
|
04 · PANW · Range breakout · subscribers
|
|
05 · TSLA · Quietest in two years · subscribers
|
|
06 · CTVA · Outsized session · subscribers
|
|
07 · ABBV · Quietest in two years · subscribers
|
|
08 · KRE · Exhaustion count (daily) · subscribers
|
|
09 · VRTX · Quietest in two years · subscribers
|
|
10 · PG · 200-day reclaim · subscribers
|
|
11 · LYV · Quietest in two years · subscribers
|
|
12 · COP · Exhaustion count (daily) · subscribers
|
Not investment advice. Each caption describes a reading that already printed in the price history. None predicts a price.
Get this in your inbox every morning: subscribe free.