◯ TECHNICALS VISUALIZED
CRYPTO EDITION

4 charts from the Oct 22 close

Every chart worth your time today, best first. Drawn from the 200 largest crypto assets by market cap, stablecoins and wrapped tokens excluded: 161 had a bar at this close and 5 printed a reading.

▲ green broke up   ▼ red broke down   ◆ amber no direction   hollow candle = up day   amber ring = the bar where the reading printed   the panel under each chart shows what the reading is measured on

We email a confirm link first; nothing arrives until you click it. Unsubscribe in one click. Want both editions?

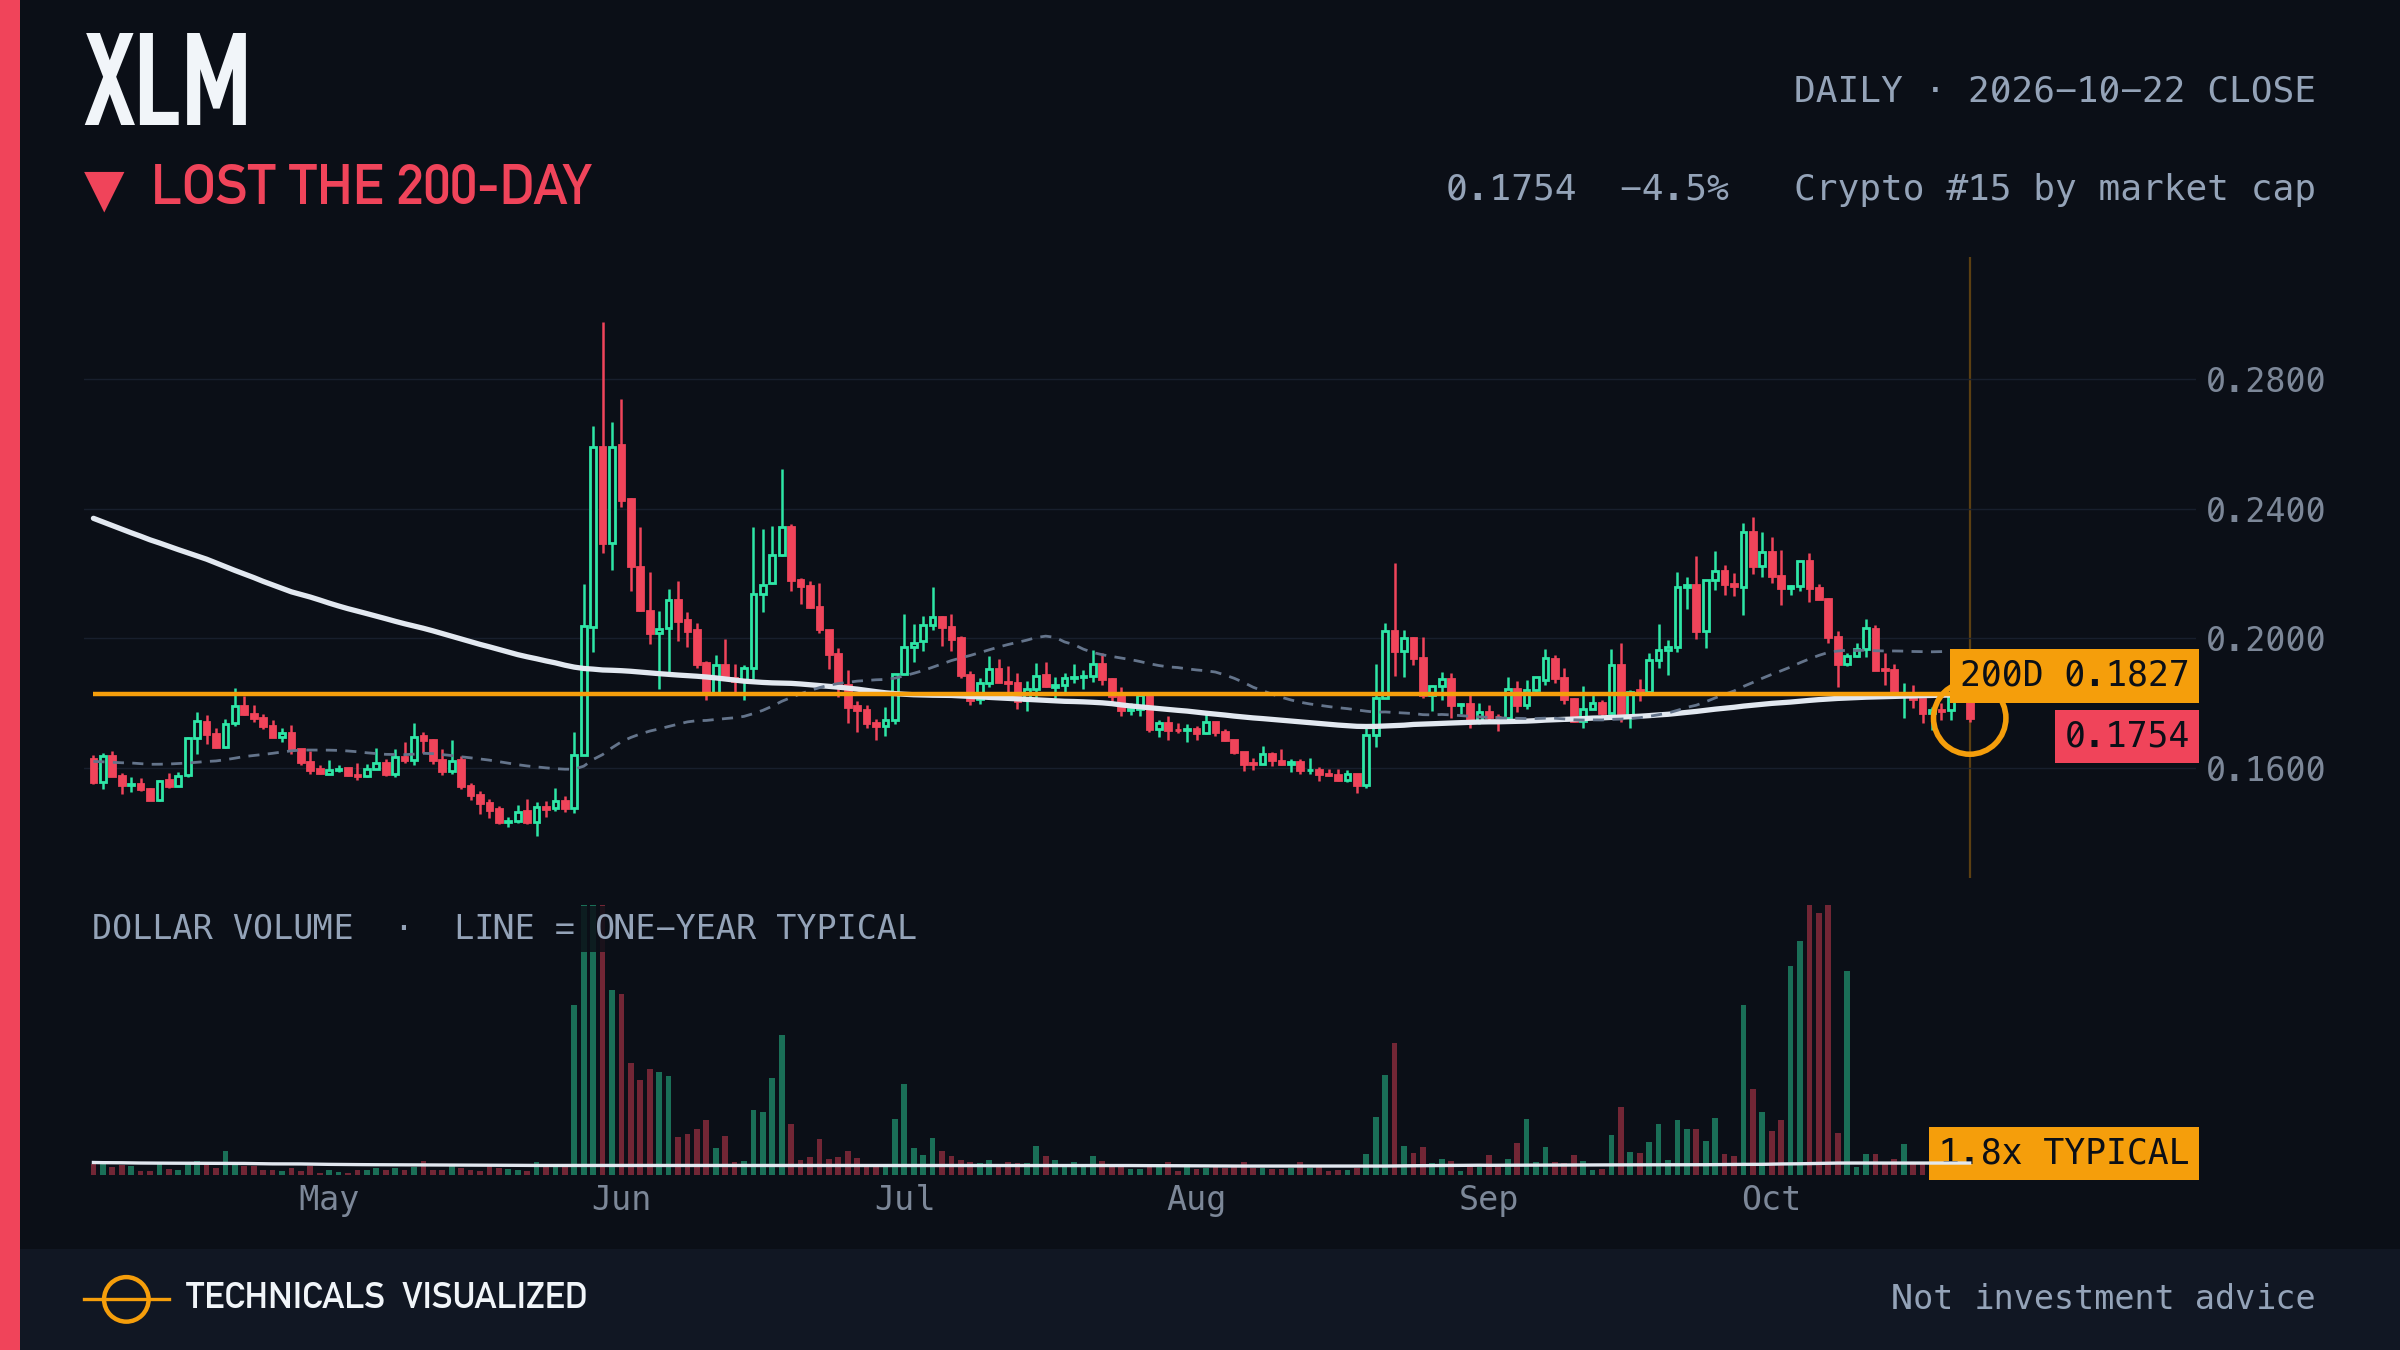
01 · XLM · Lost the 200-day
XLM daily chart: Lost the 200-day

Stellar (XLM) first close below the 200-day average after closing above it on 44 of the prior 50 sessions.

The 200-day average sits at $0.18. The chart shows the line; it does not say the cross will hold.

THE REST OF THIS EDITION IS FOR SUBSCRIBERS

3 more charts from the Oct 22 close, listed below by name. Subscribers get every chart, drawn and captioned, in their inbox each morning.

Get every chart by email
02 · APE · Lost the 200-day · subscribers
03 · STRK · Exhaustion count (daily) · subscribers
04 · ICP · Exhaustion count (daily) · subscribers

Not investment advice. Each caption describes a reading that already printed in the price history. None predicts a price.

Get this in your inbox every morning: subscribe free.