◯ TECHNICALS VISUALIZED
STOCKS & ETFS EDITION

12 charts from the Oct 23 close

Every chart worth your time today, best first. Drawn from S&P 500, Nasdaq-100 and the sector, country and theme ETFs: 556 had a bar at this close and 52 printed a reading.

▲ green broke up   ▼ red broke down   ◆ amber no direction   hollow candle = up day   amber ring = the bar where the reading printed   the panel under each chart shows what the reading is measured on

We email a confirm link first; nothing arrives until you click it. Unsubscribe in one click. Want both editions?

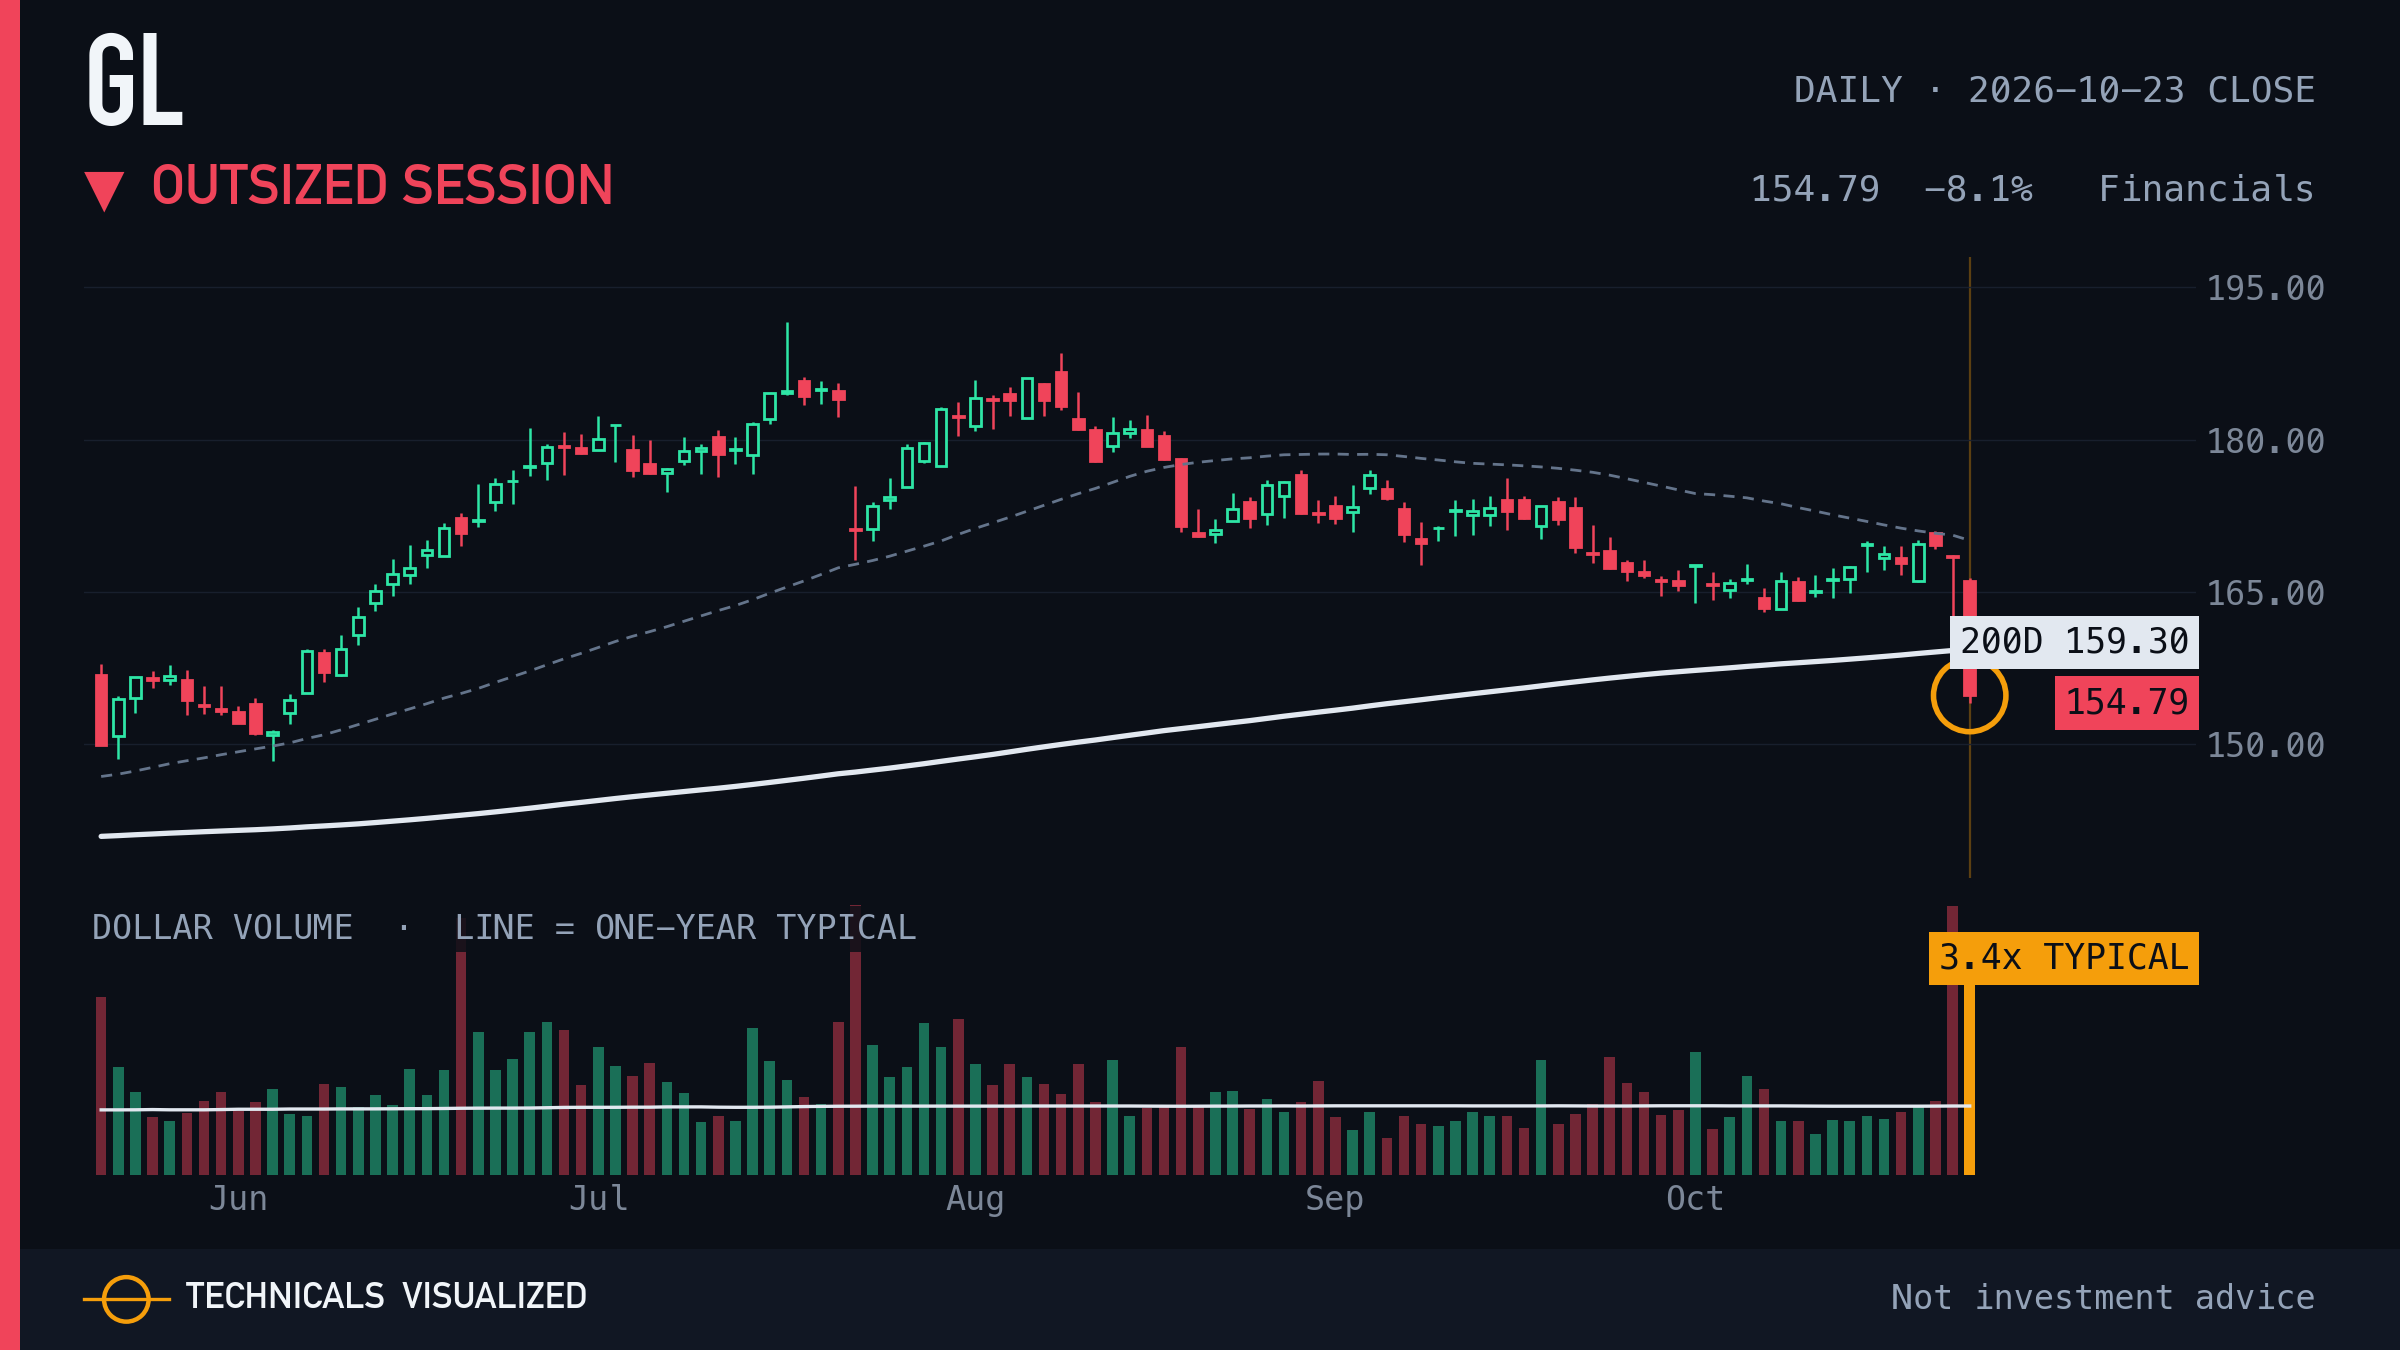
01 · GL · Outsized session
GL daily chart: Outsized session

GL moved -8.1% in one session, 8.0 times its usual daily move.

One session, measured against this chart's own usual move. It describes the day, not the next one.

THE REST OF THIS EDITION IS FOR SUBSCRIBERS

11 more charts from the Oct 23 close, listed below by name. Subscribers get every chart, drawn and captioned, in their inbox each morning.

Get every chart by email
02 · HWM · New 52-week low · subscribers
03 · CMG · New 52-week low · subscribers
04 · BE · Range breakdown · subscribers
05 · AMT · Volume surge · subscribers
06 · CCI · Volume surge · subscribers
07 · AAPL · Exhaustion count (weekly) · subscribers
08 · FXI · Exhaustion count (weekly) · subscribers
09 · XLB · Exhaustion count (weekly) · subscribers
10 · DVN · Exhaustion count (weekly) · subscribers
11 · SLB · Exhaustion count (weekly) · subscribers
12 · NEM · Lost the 200-day · subscribers

Not investment advice. Each caption describes a reading that already printed in the price history. None predicts a price.

Get this in your inbox every morning: subscribe free.