IndicesThe same five every day: US large caps, the Nasdaq 100, small caps, long Treasuries and crude oil. |
|
01 · SPDR S&P 500 ETF (SPY) · Daily chart
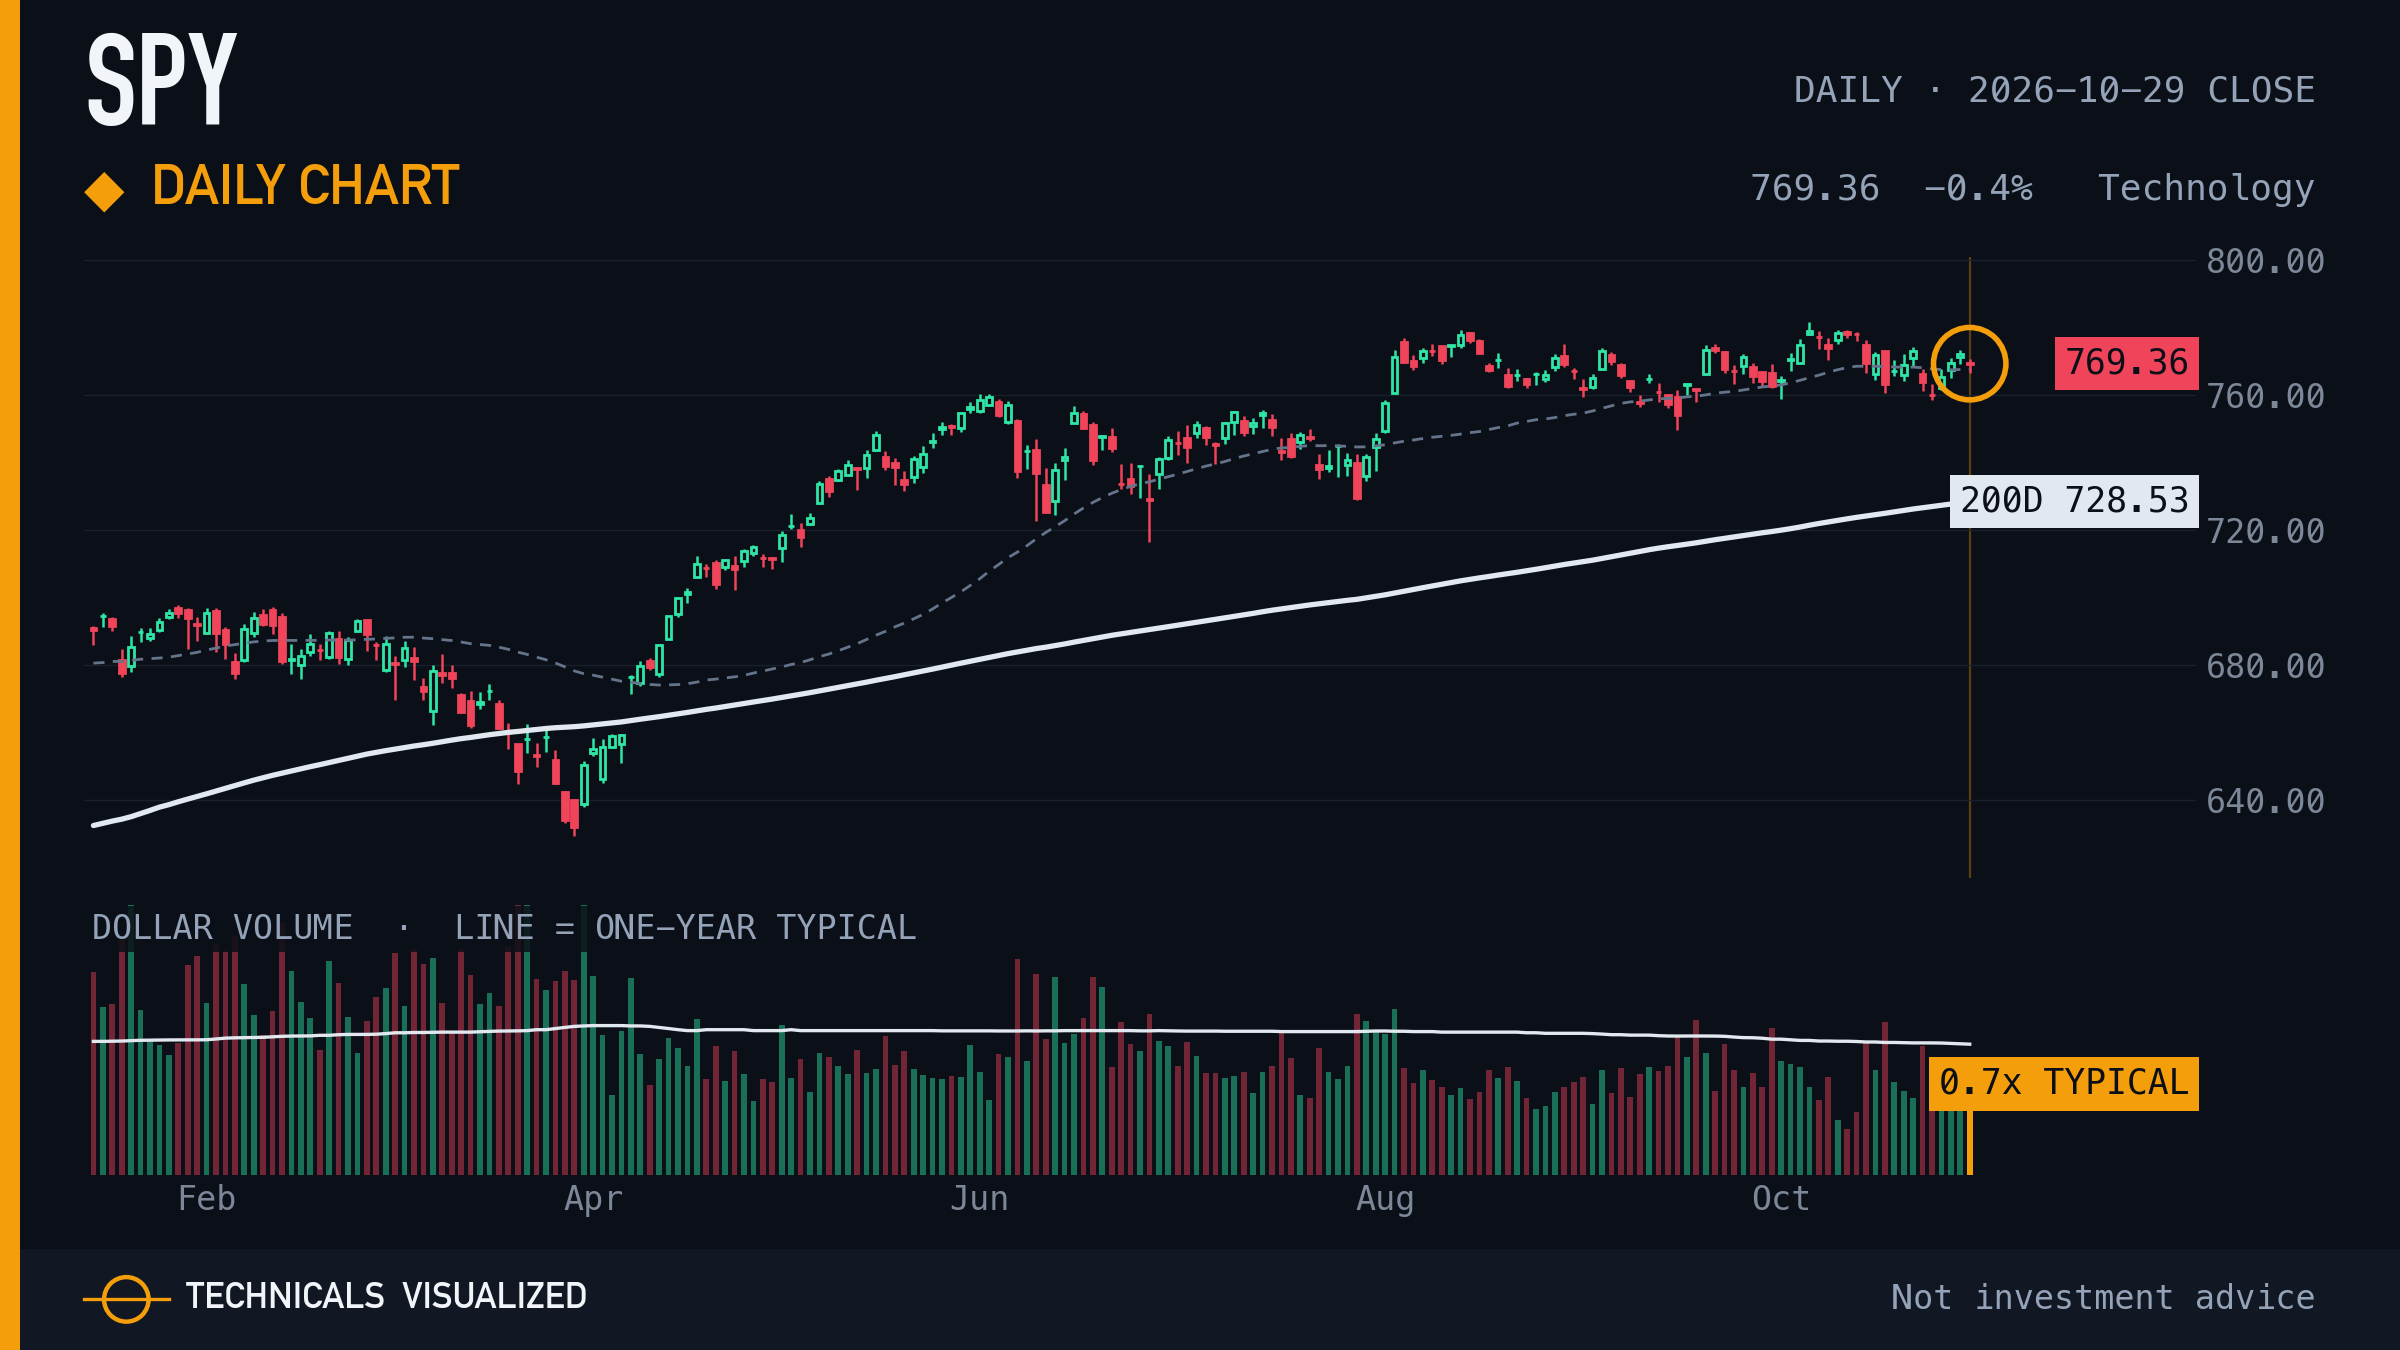
SPDR S&P 500 ETF closed at $769.36, -0.4% on the day, 5.6% above its 200-day average.
Shown in every edition, whether or not it printed a reading. The amber ring marks this close.
|
|
02 · Invesco QQQ Trust (QQQ) · Daily chart
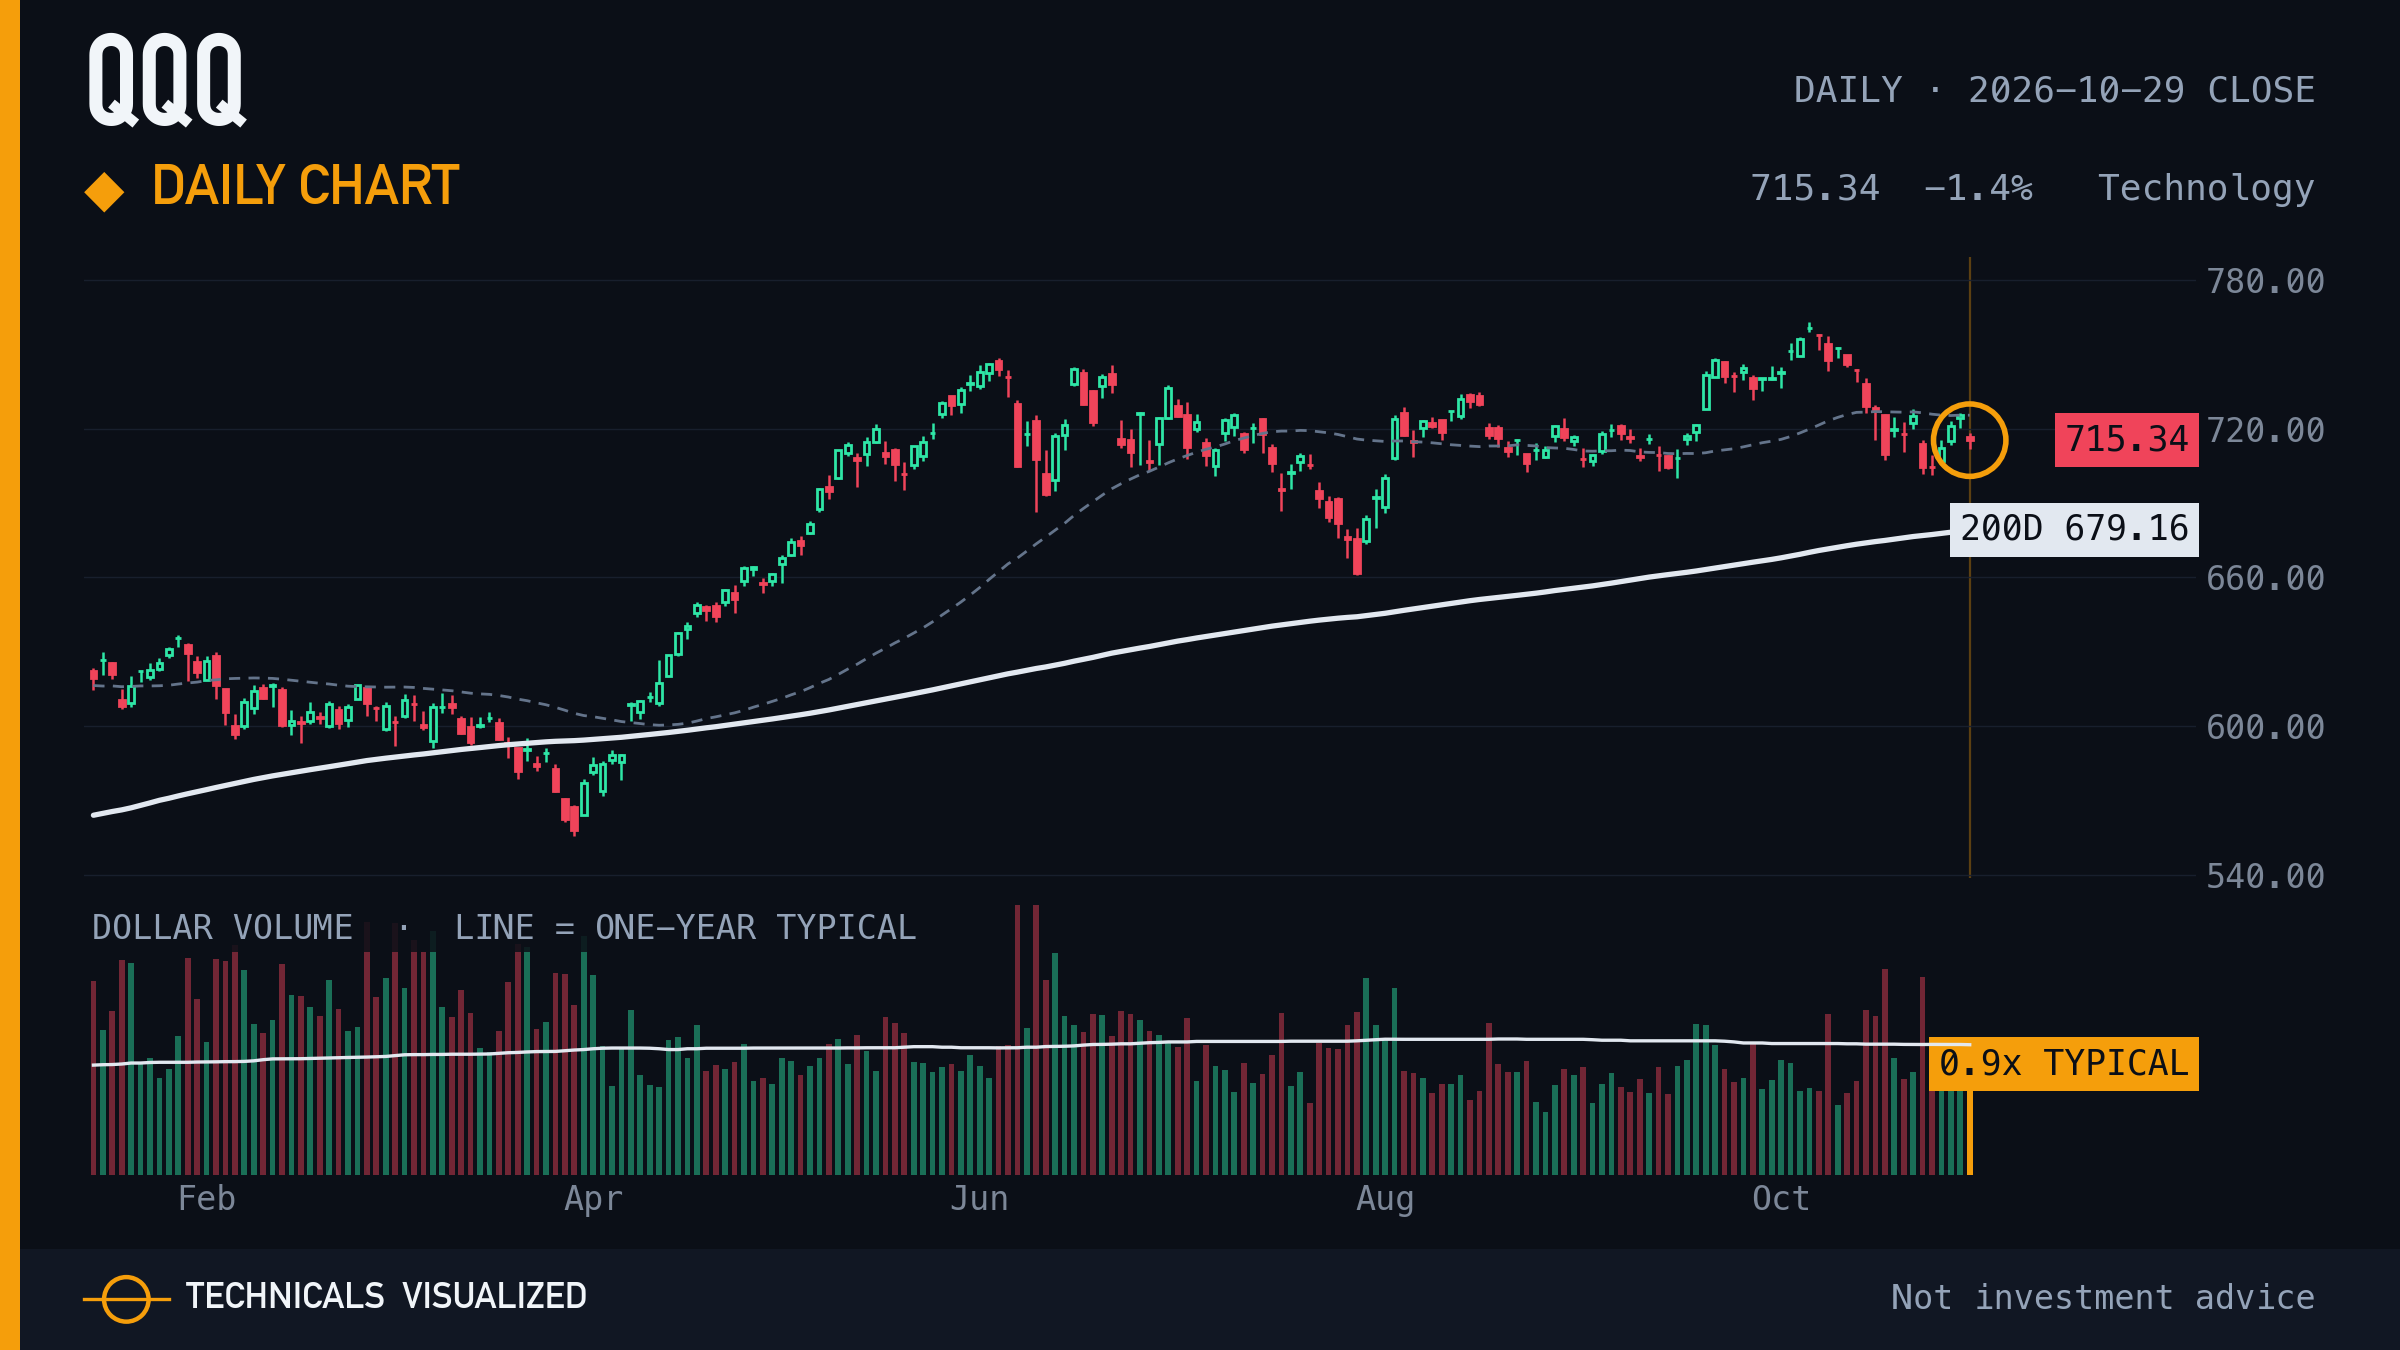
Invesco QQQ Trust closed at $715.34, -1.4% on the day, 5.3% above its 200-day average.
Shown in every edition, whether or not it printed a reading. The amber ring marks this close.
|
|
03 · iShares Russell 2000 ETF (IWM) · Daily chart
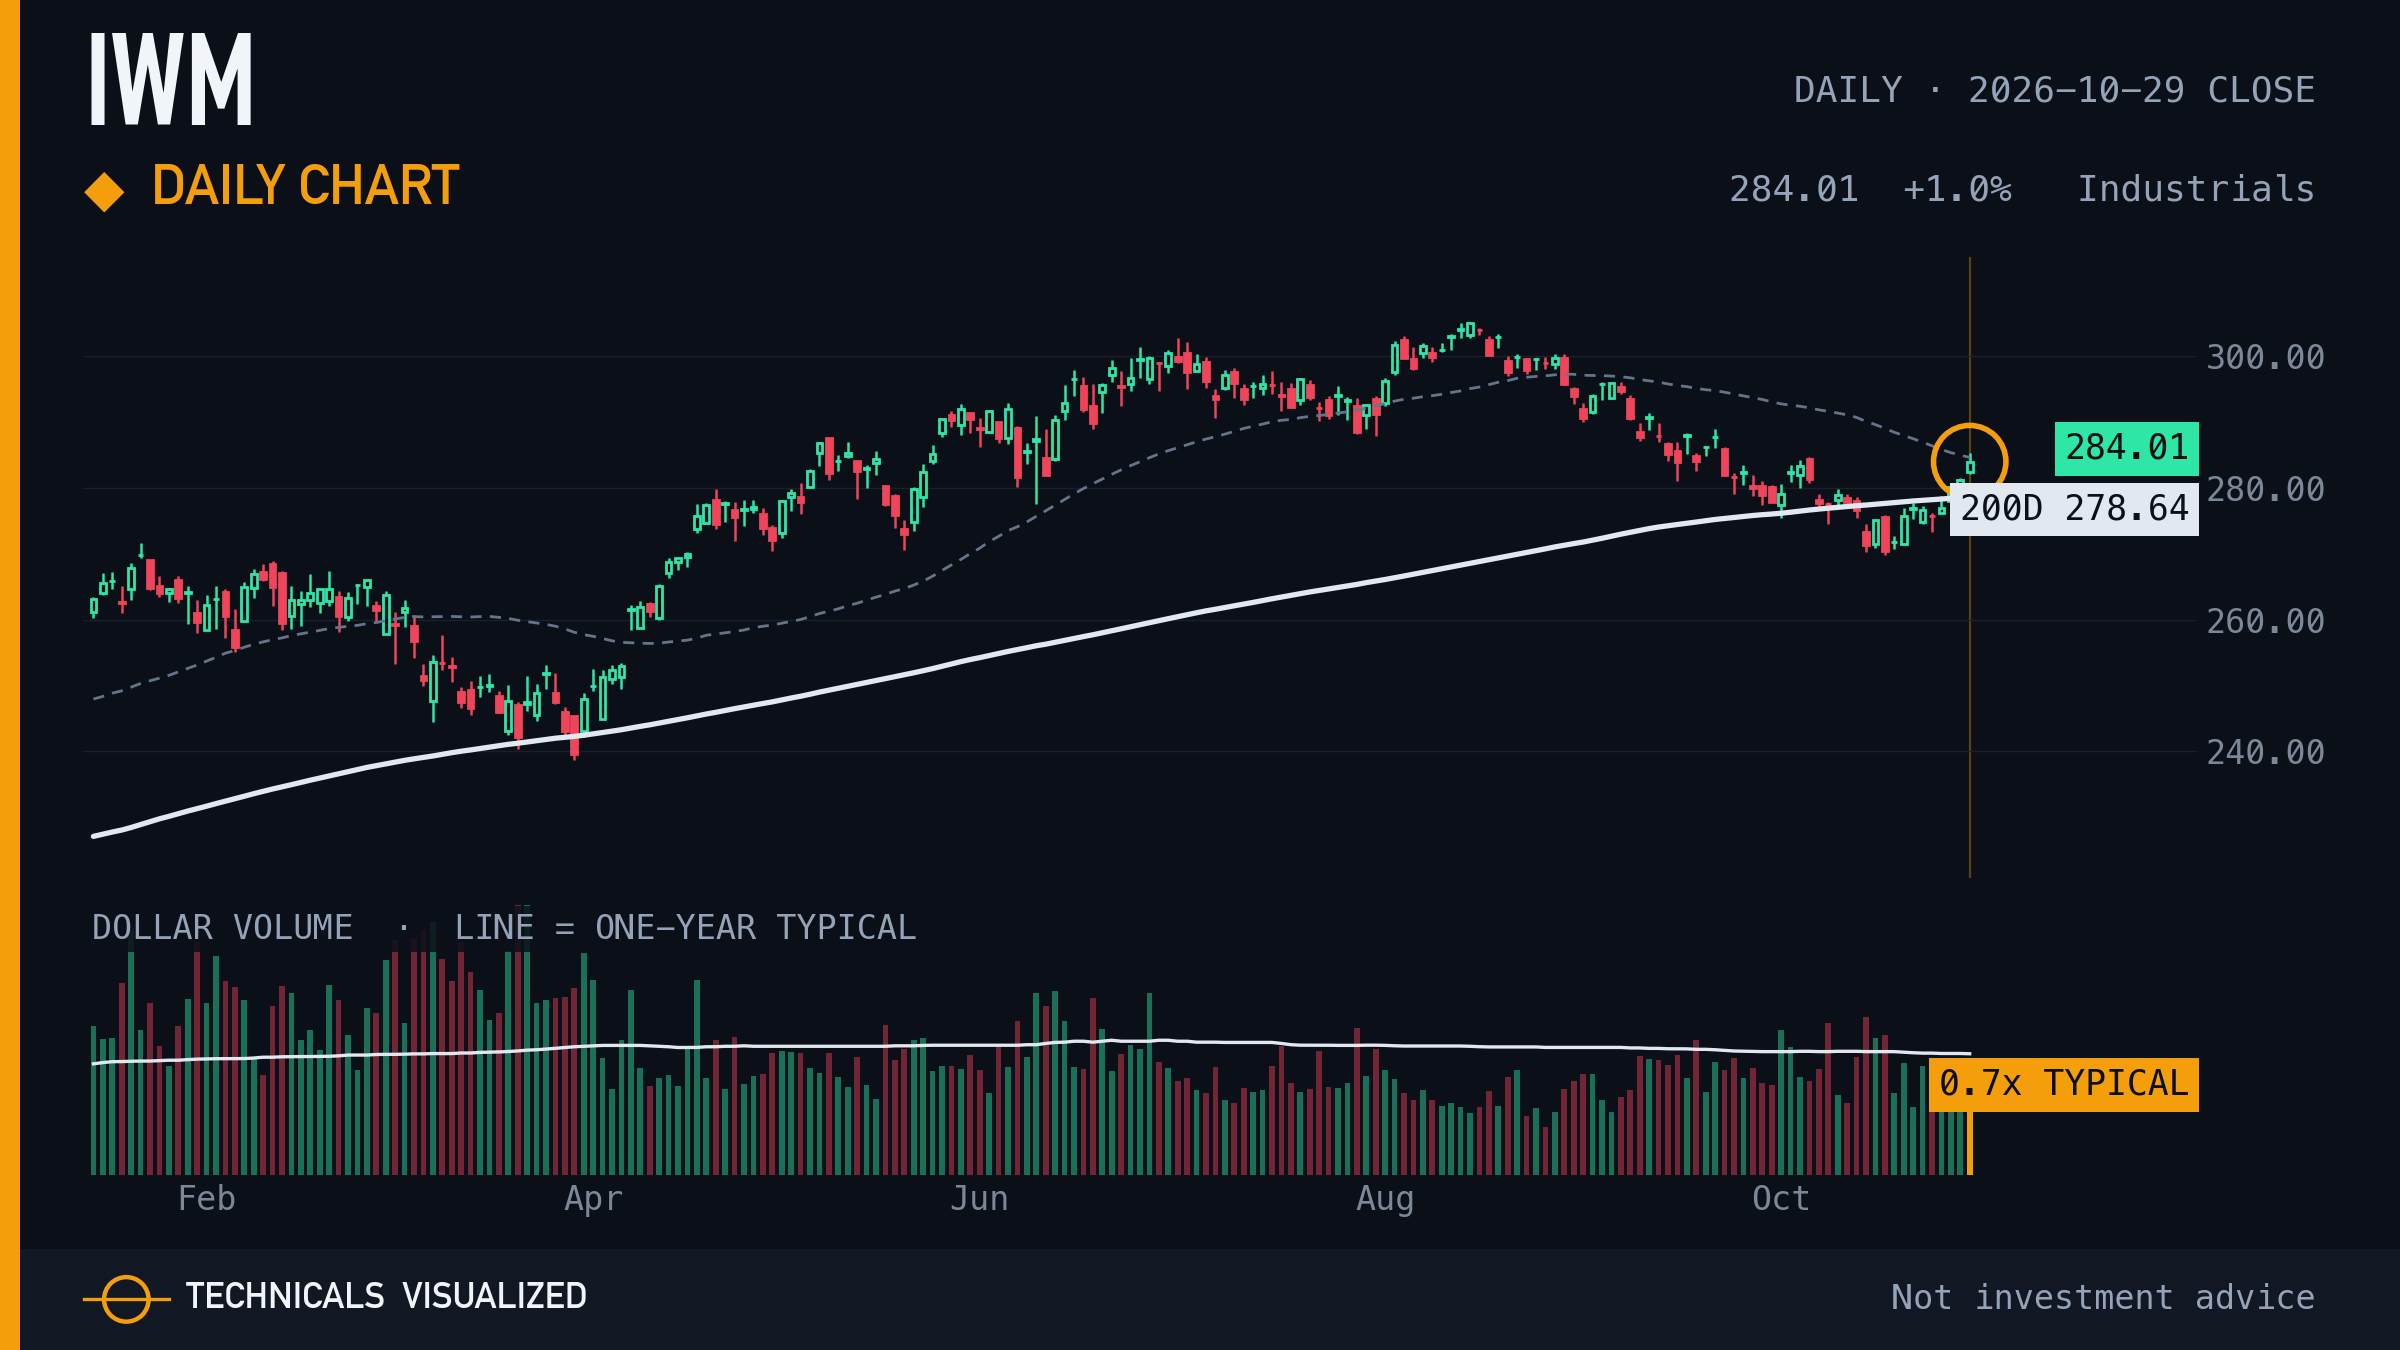
iShares Russell 2000 ETF closed at $284.01, +1.0% on the day, 1.9% above its 200-day average.
Shown in every edition, whether or not it printed a reading. The amber ring marks this close.
|
|
04 · iShares 20+ Year Treasury Bond ETF (TLT) · Daily chart
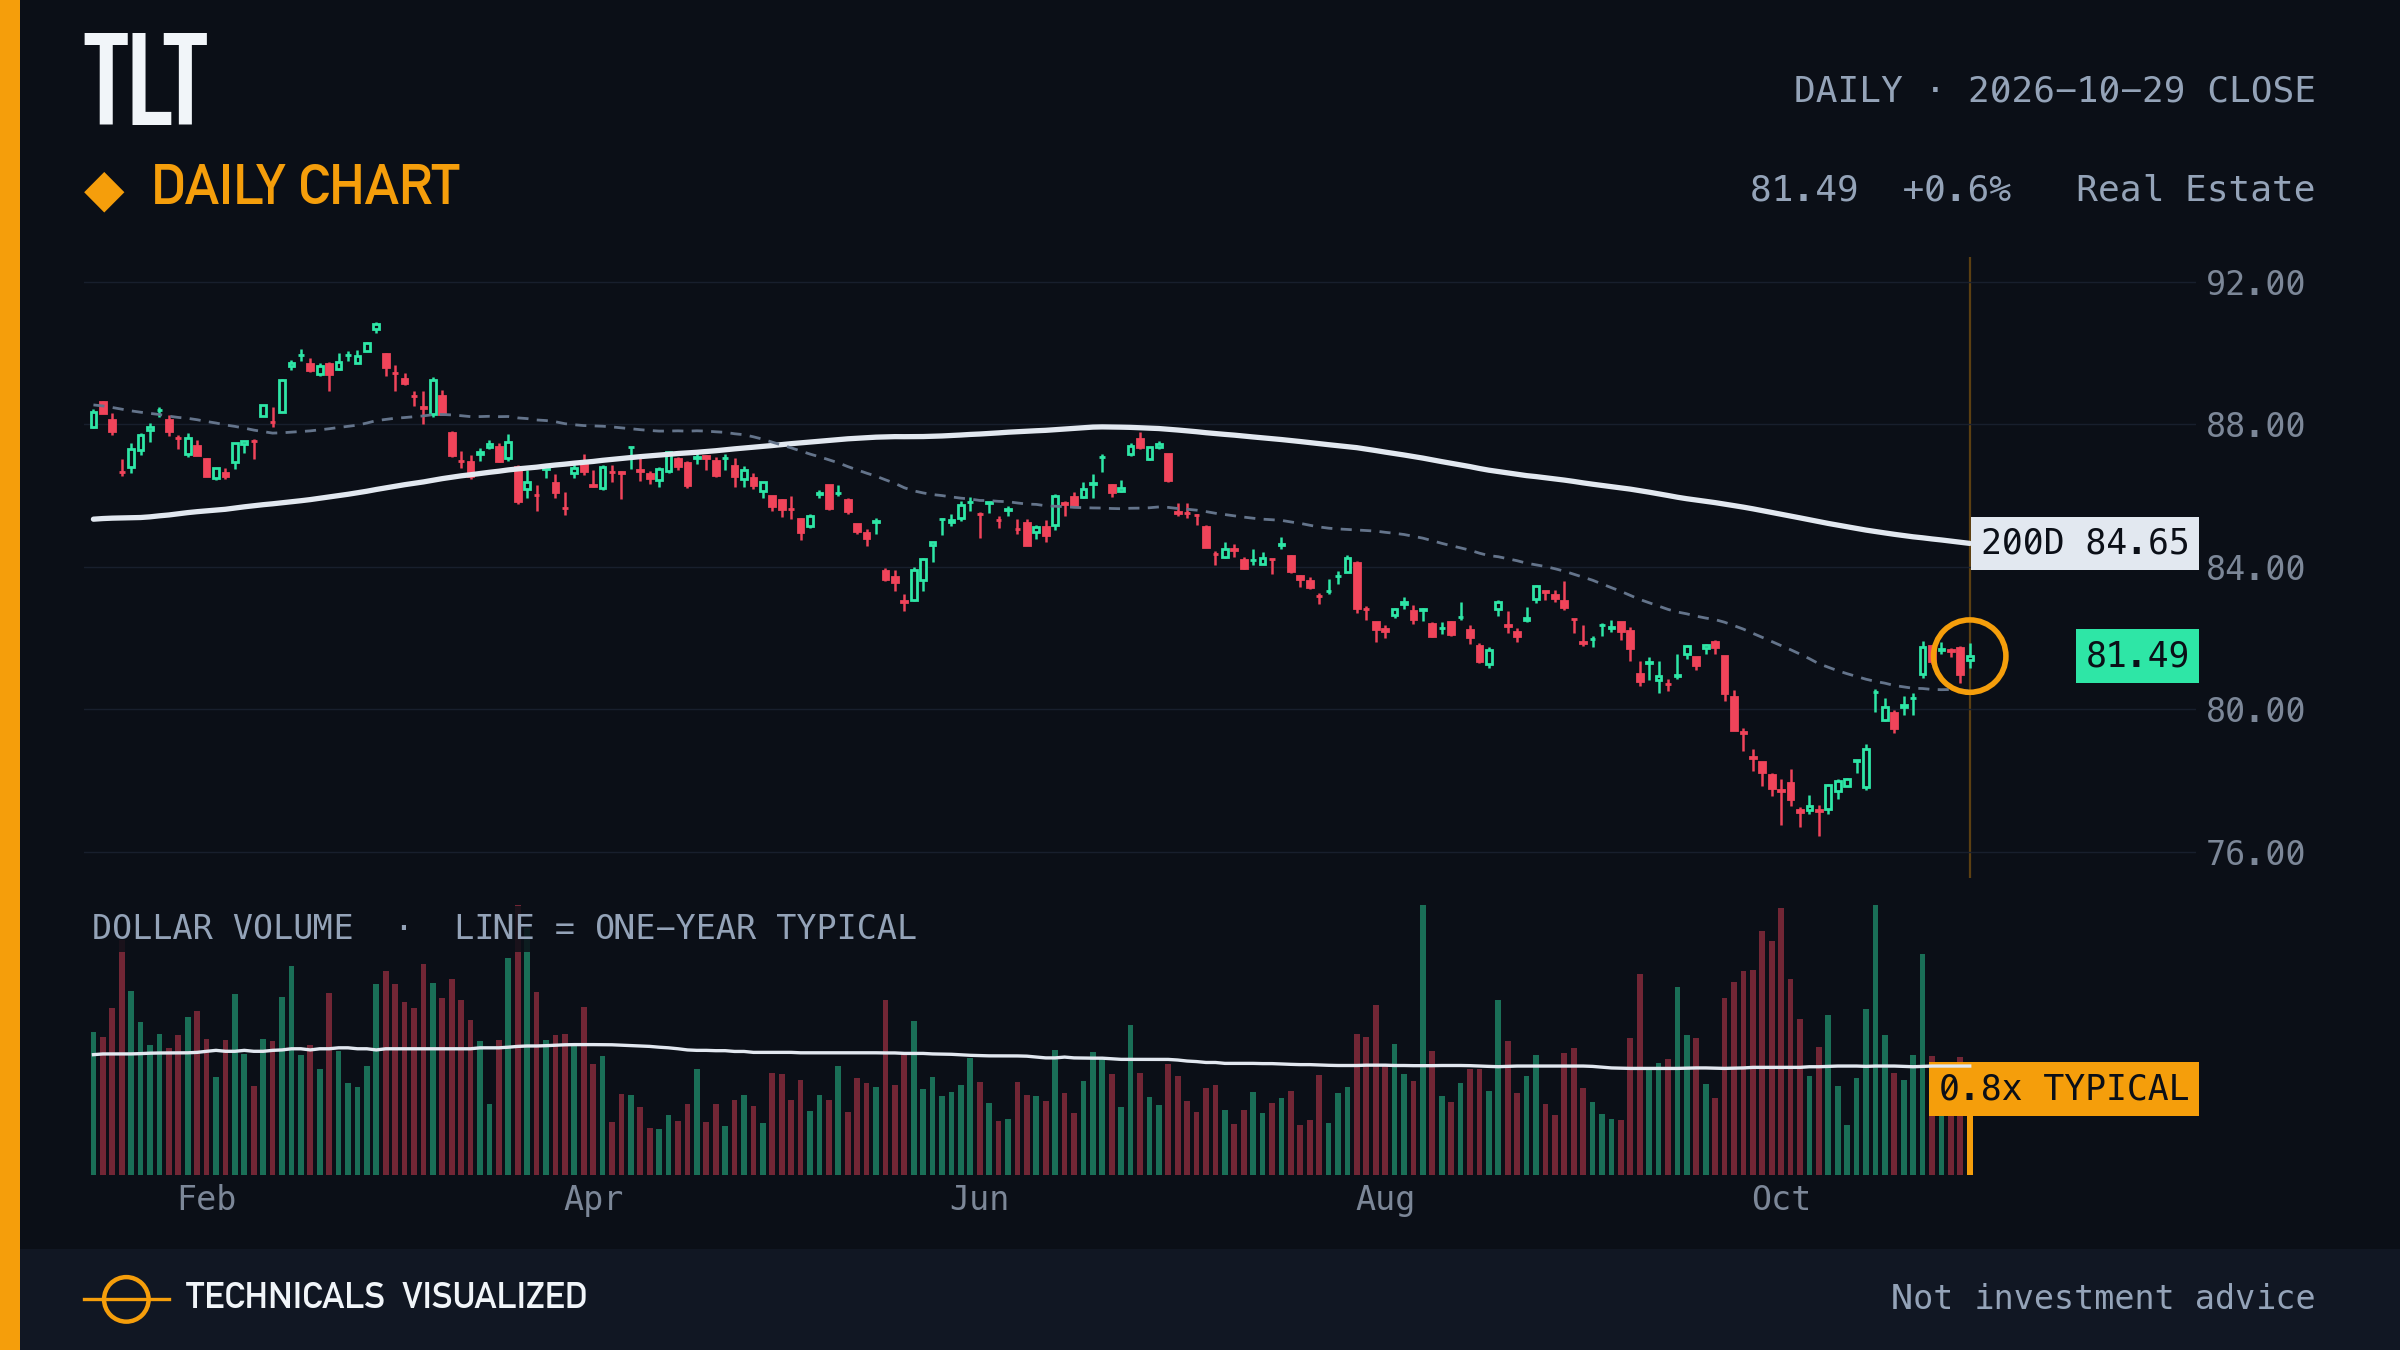
iShares 20+ Year Treasury Bond ETF closed at $81.49, +0.6% on the day, 3.7% below its 200-day average.
Shown in every edition, whether or not it printed a reading. The amber ring marks this close.
|
|
05 · United States Oil Fund (USO) · Daily chart
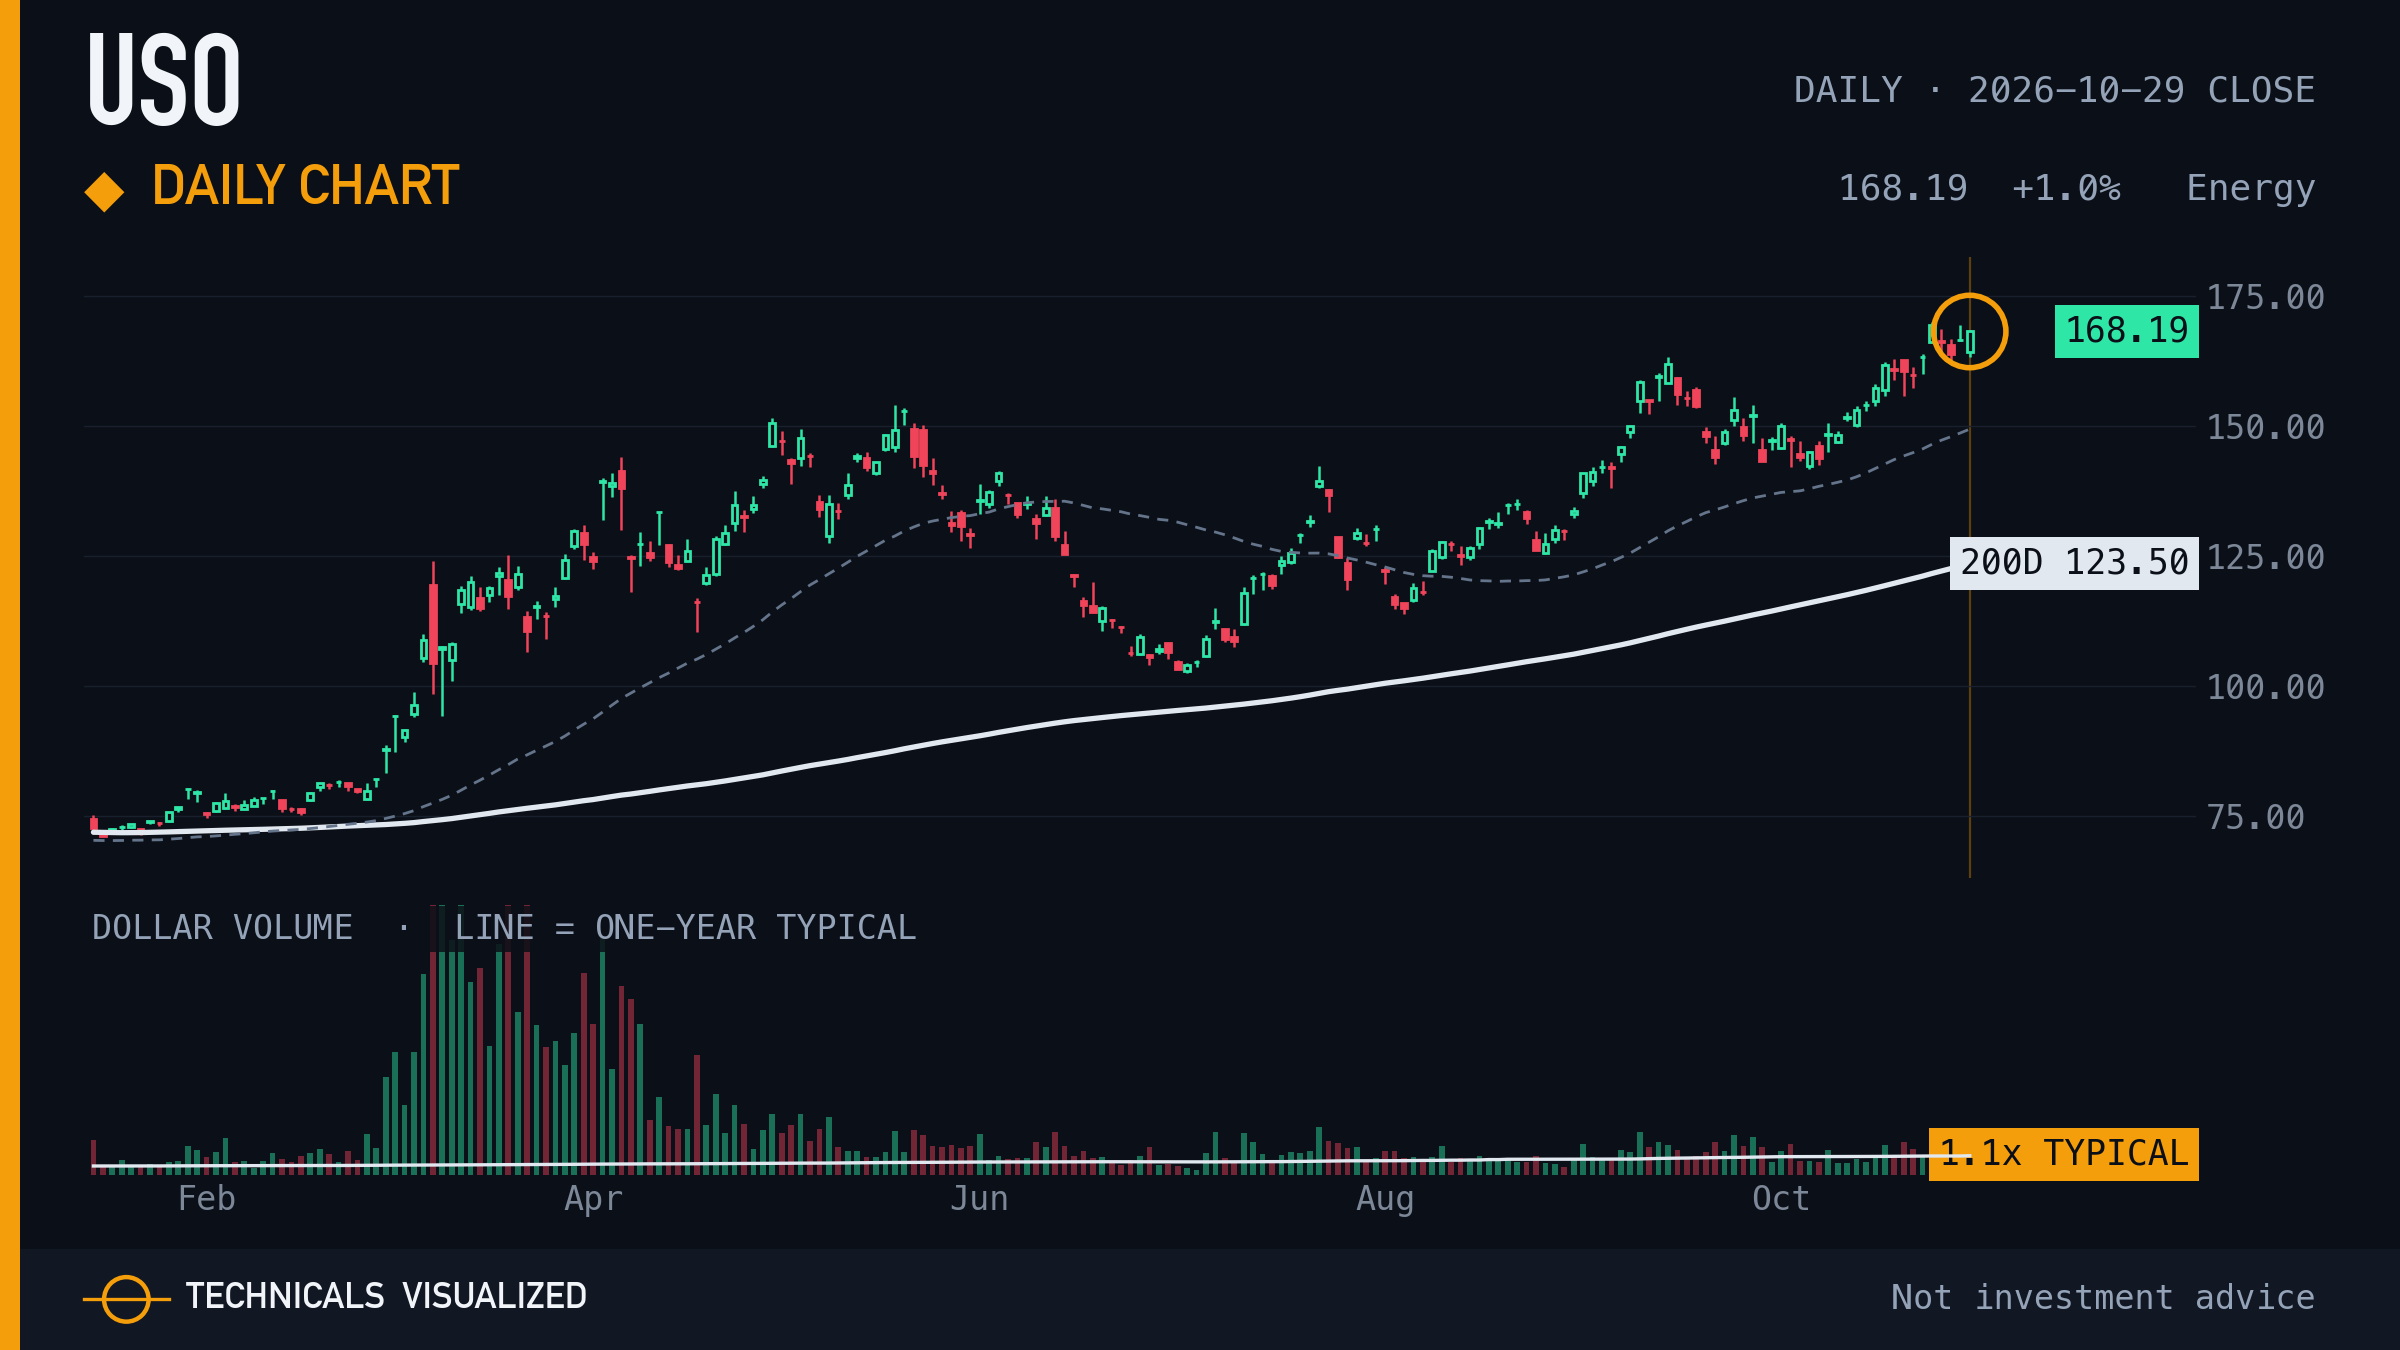
United States Oil Fund closed at $168.19, +1.0% on the day, 36.2% above its 200-day average.
Shown in every edition, whether or not it printed a reading. The amber ring marks this close.
|
Today's readings |
|
06 · Alphabet (GOOGL) · Outsized session
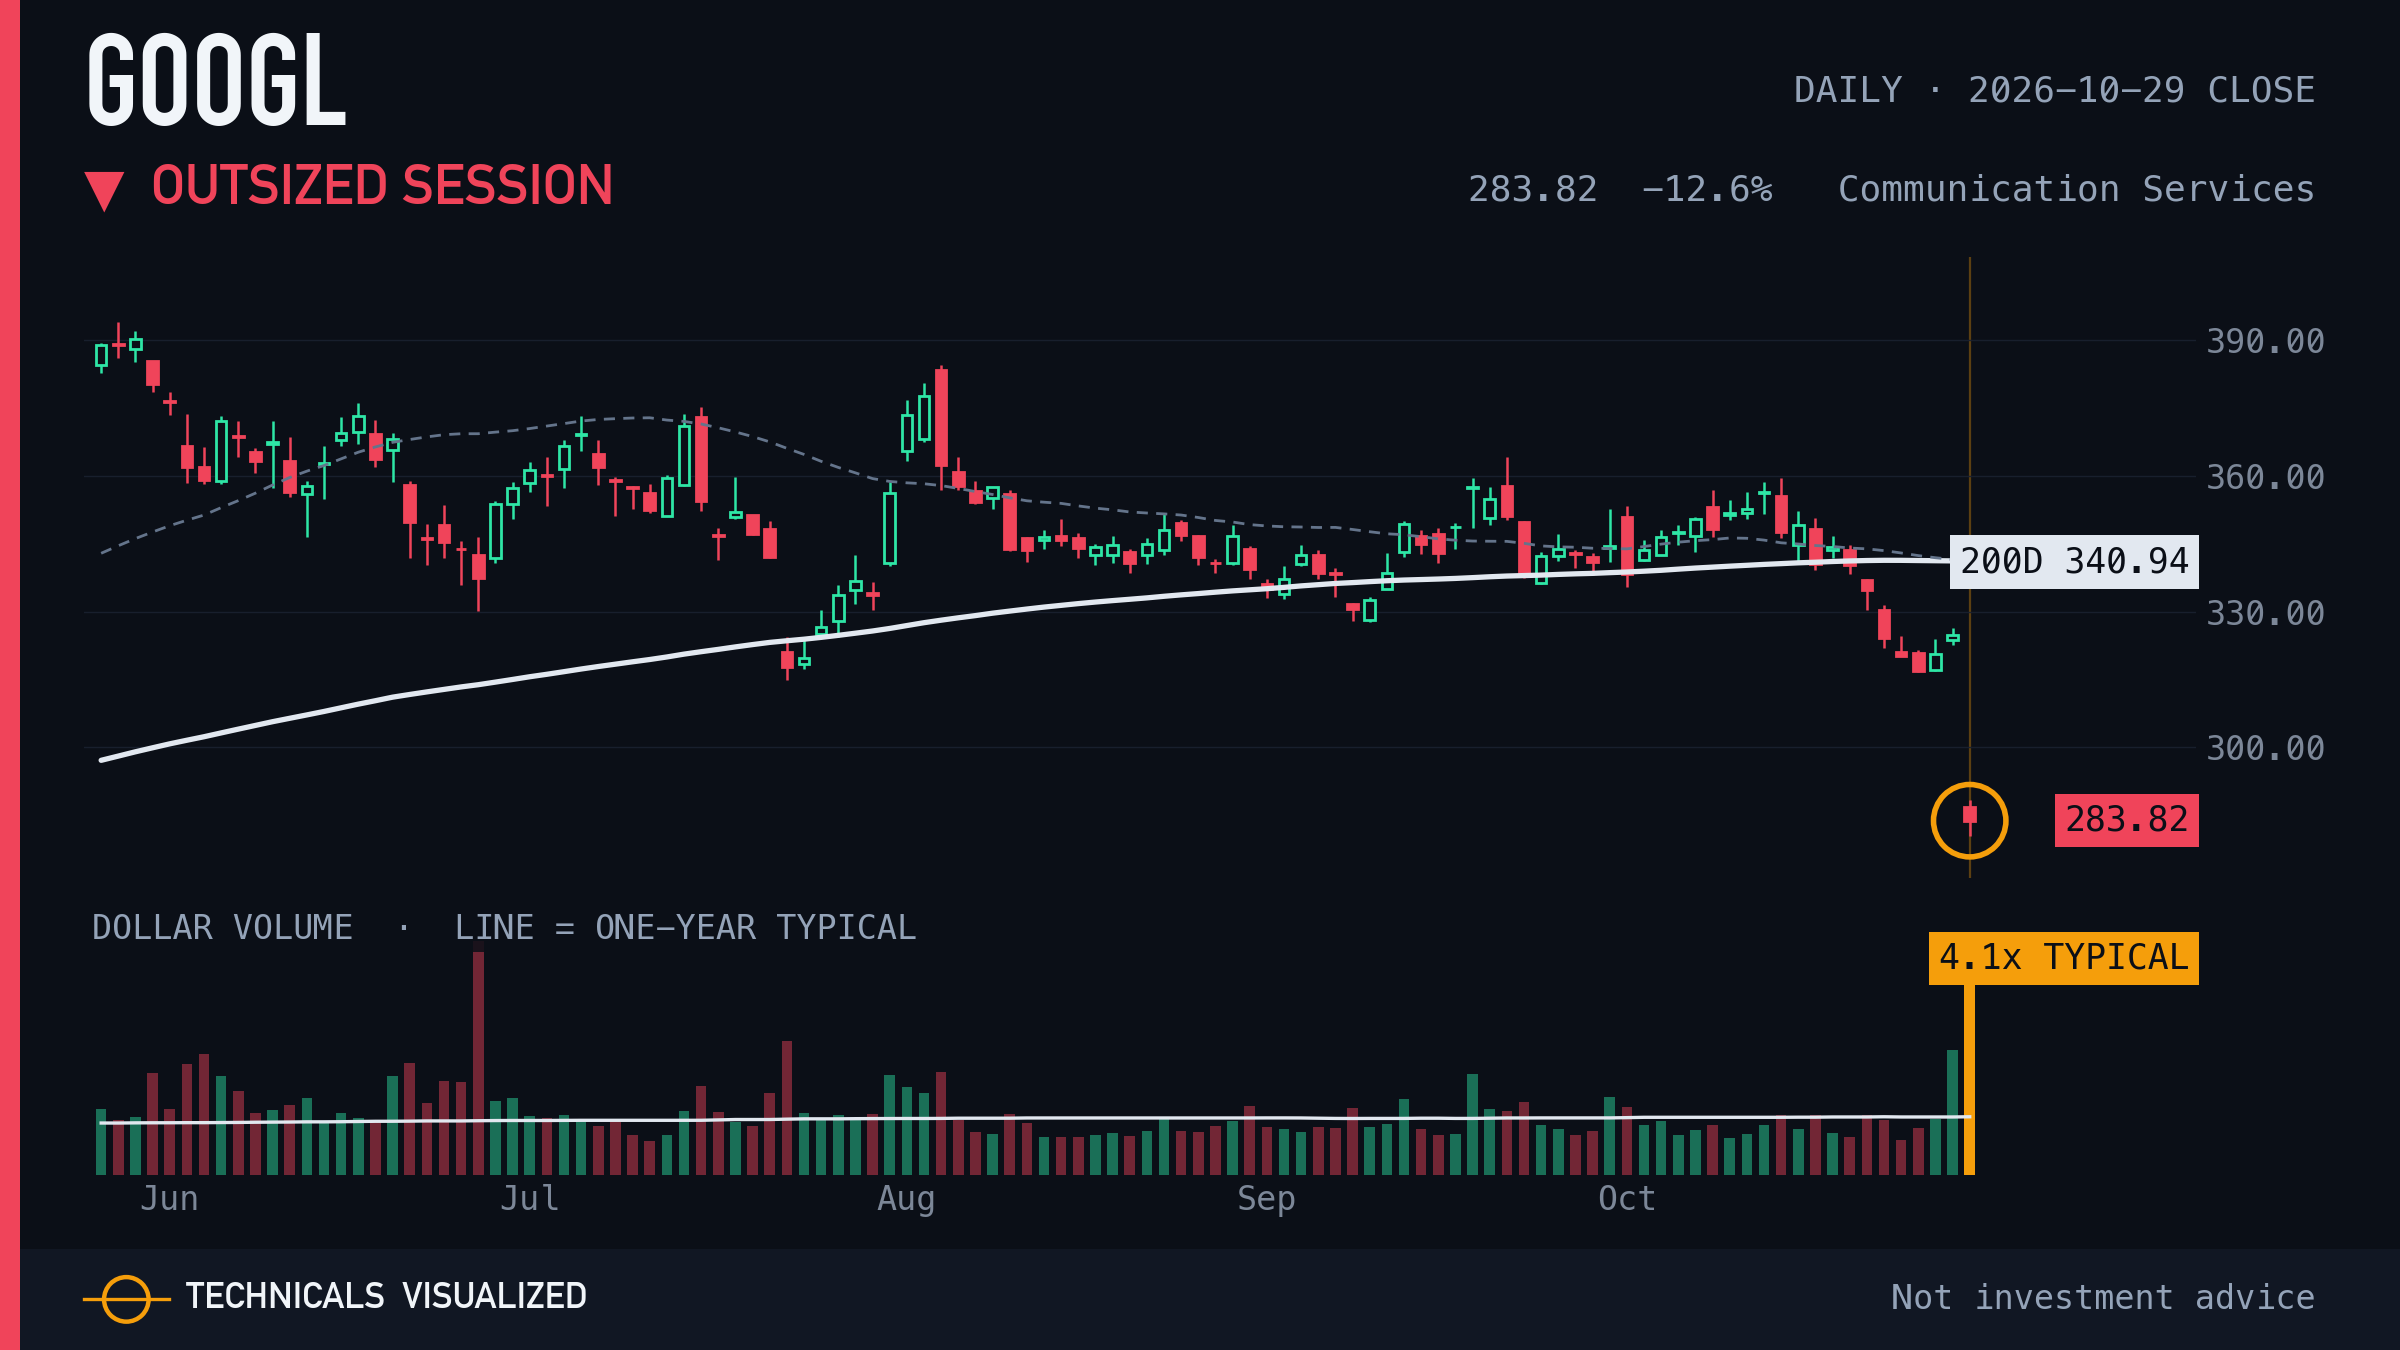
Alphabet moved -12.6% in one session, 8.9 times its usual daily move.
One session, measured against this chart's own usual move. It describes the day, not the next one.
|
THE REST OF THIS EDITION IS FOR SUBSCRIBERS
11 more charts from the Oct 29 close, listed below by name. Subscribers get every chart, drawn and captioned, in their inbox each morning.
Get every chart by email
|
|
07 · Alphabet (GOOG) · Outsized session · subscribers
|
|
08 · ServiceNow (NOW) · Outsized session · subscribers
|
|
09 · Fortinet (FTNT) · Outsized session · subscribers
|
|
10 · Caterpillar (CAT) · Outsized session · subscribers
|
|
11 · iShares Silver Trust (SLV) · Relative strength: one-year low · subscribers
|
|
12 · WEC Energy Group (WEC) · Volume surge · subscribers
|
|
13 · iShares MSCI Brazil ETF (EWZ) · Relative strength: one-year low · subscribers
|
|
14 · Archer-Daniels-Midland (ADM) · Lost the 200-day · subscribers
|
|
15 · Consumer Discretionary Select Sector SPDR (XLY) · 200-day reclaim · subscribers
|
|
16 · Thermo Fisher Scientific (TMO) · Exhaustion count (daily) · subscribers
|
|
17 · Valero Energy (VLO) · Exhaustion count (daily) · subscribers
|