MajorsThe same three every day: Bitcoin, Ethereum and Solana. Hyperliquid and Zcash join when they print a reading. |
|
01 · Bitcoin (BTC) · Daily chart
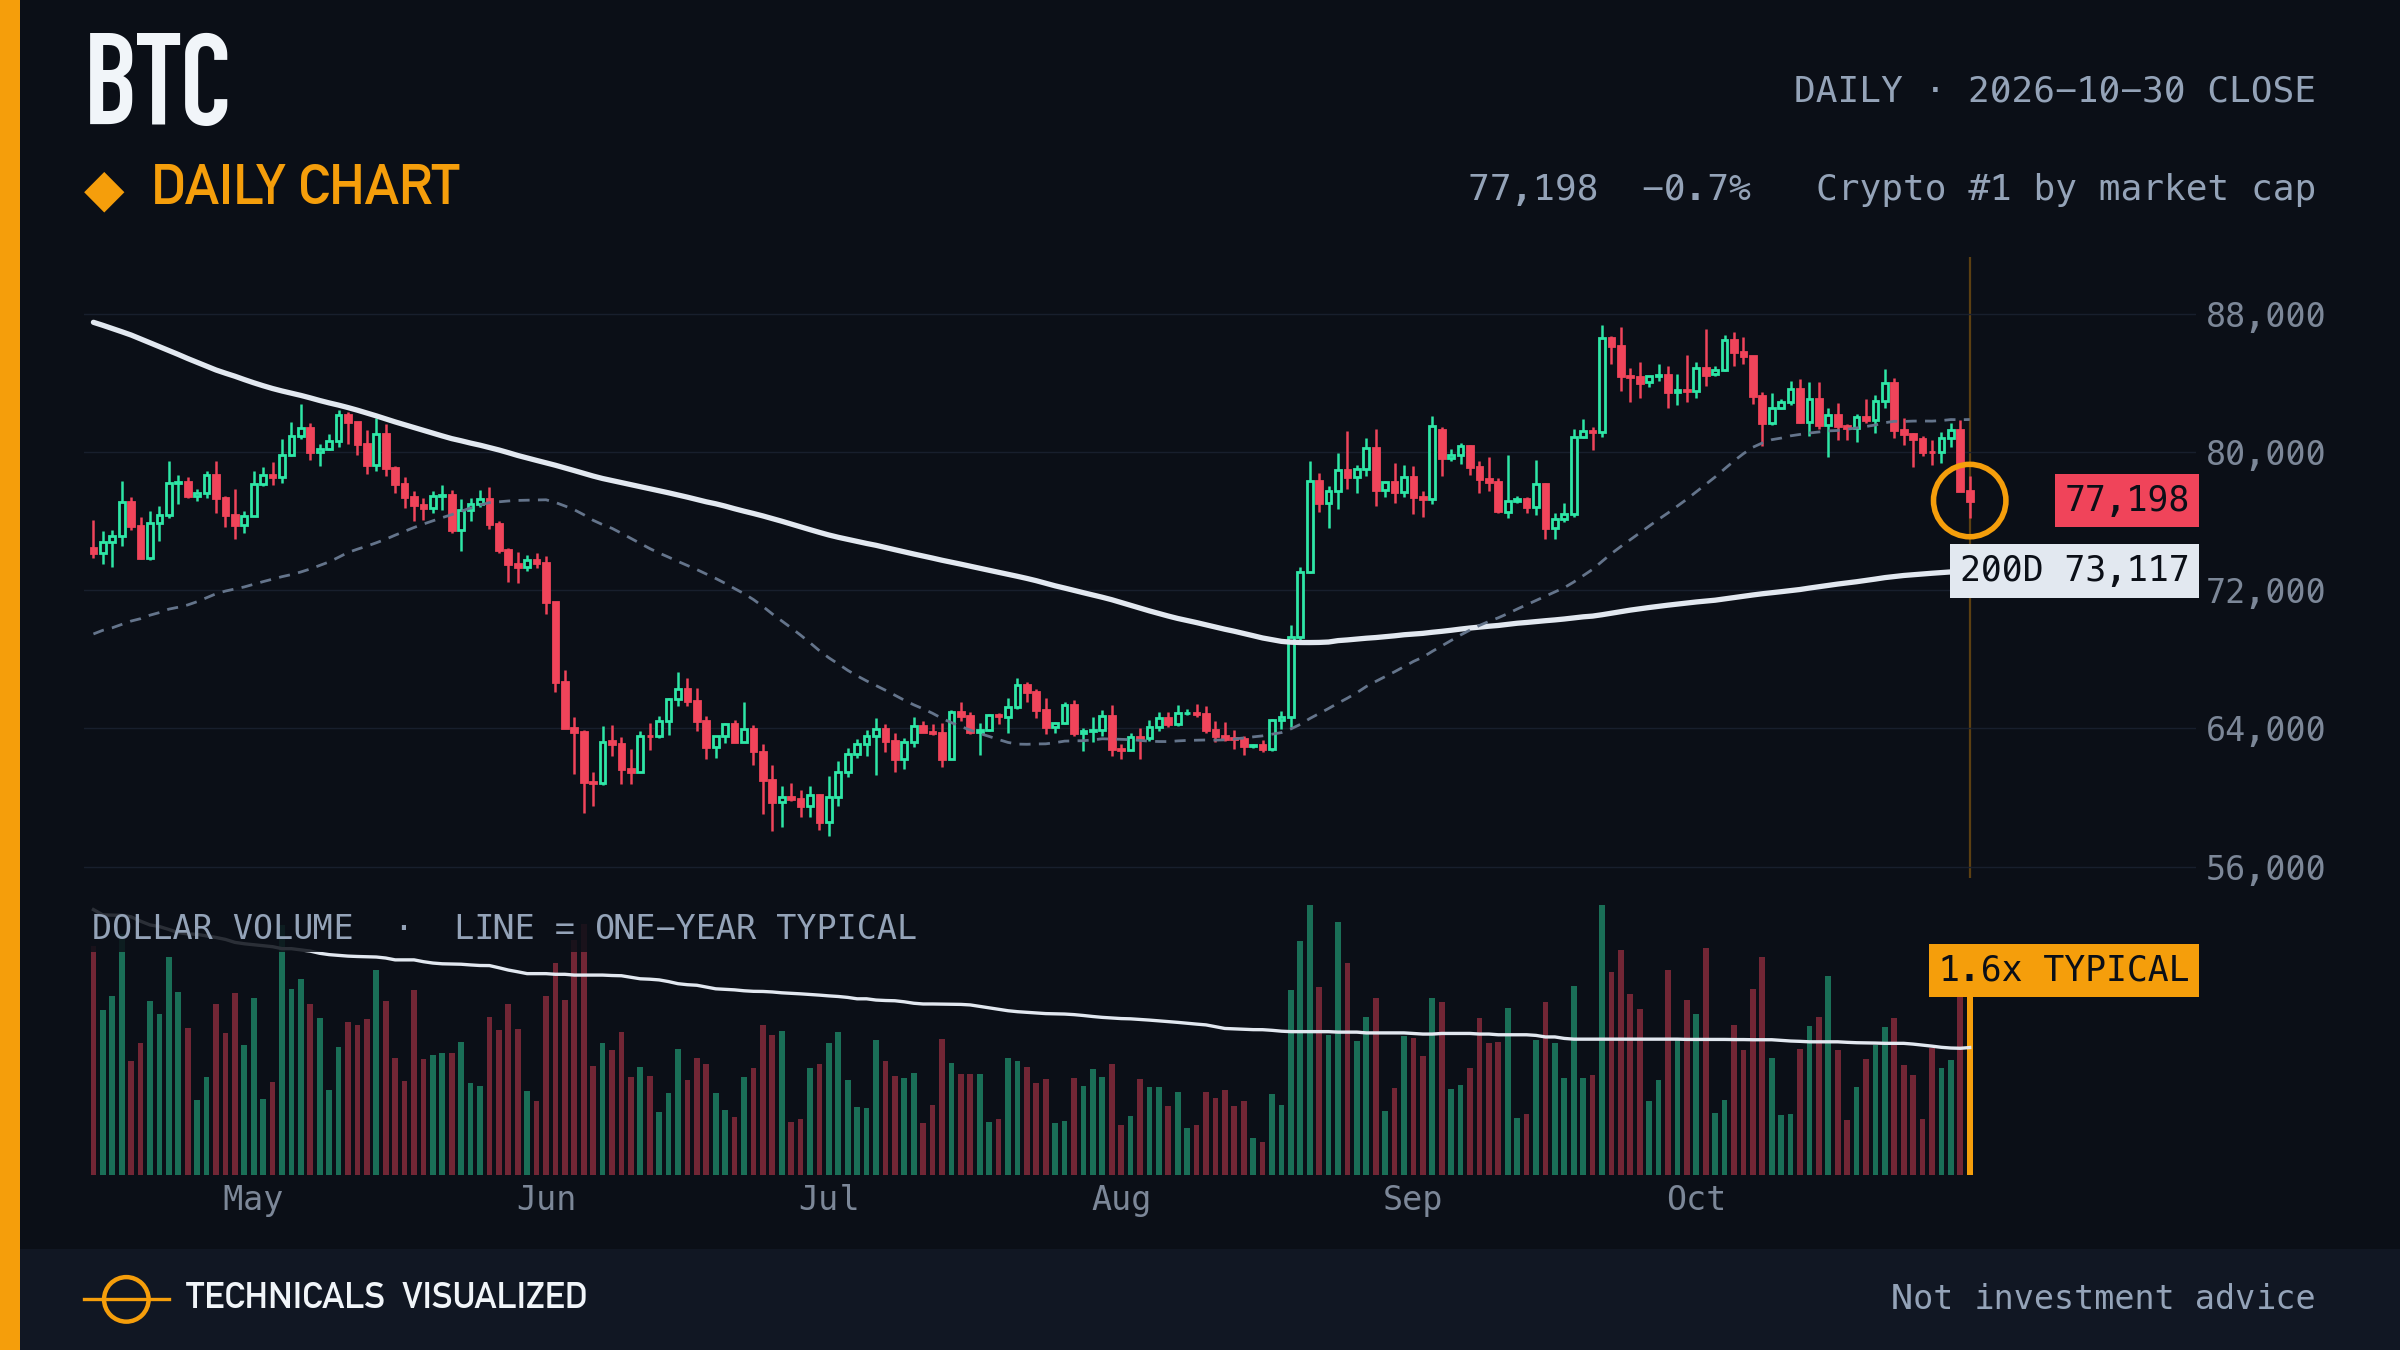
Bitcoin closed at $77,198, -0.7% on the day, 5.6% above its 200-day average.
Shown in every edition, whether or not it printed a reading. The amber ring marks this close.
|
|
02 · Ethereum (ETH) · Daily chart
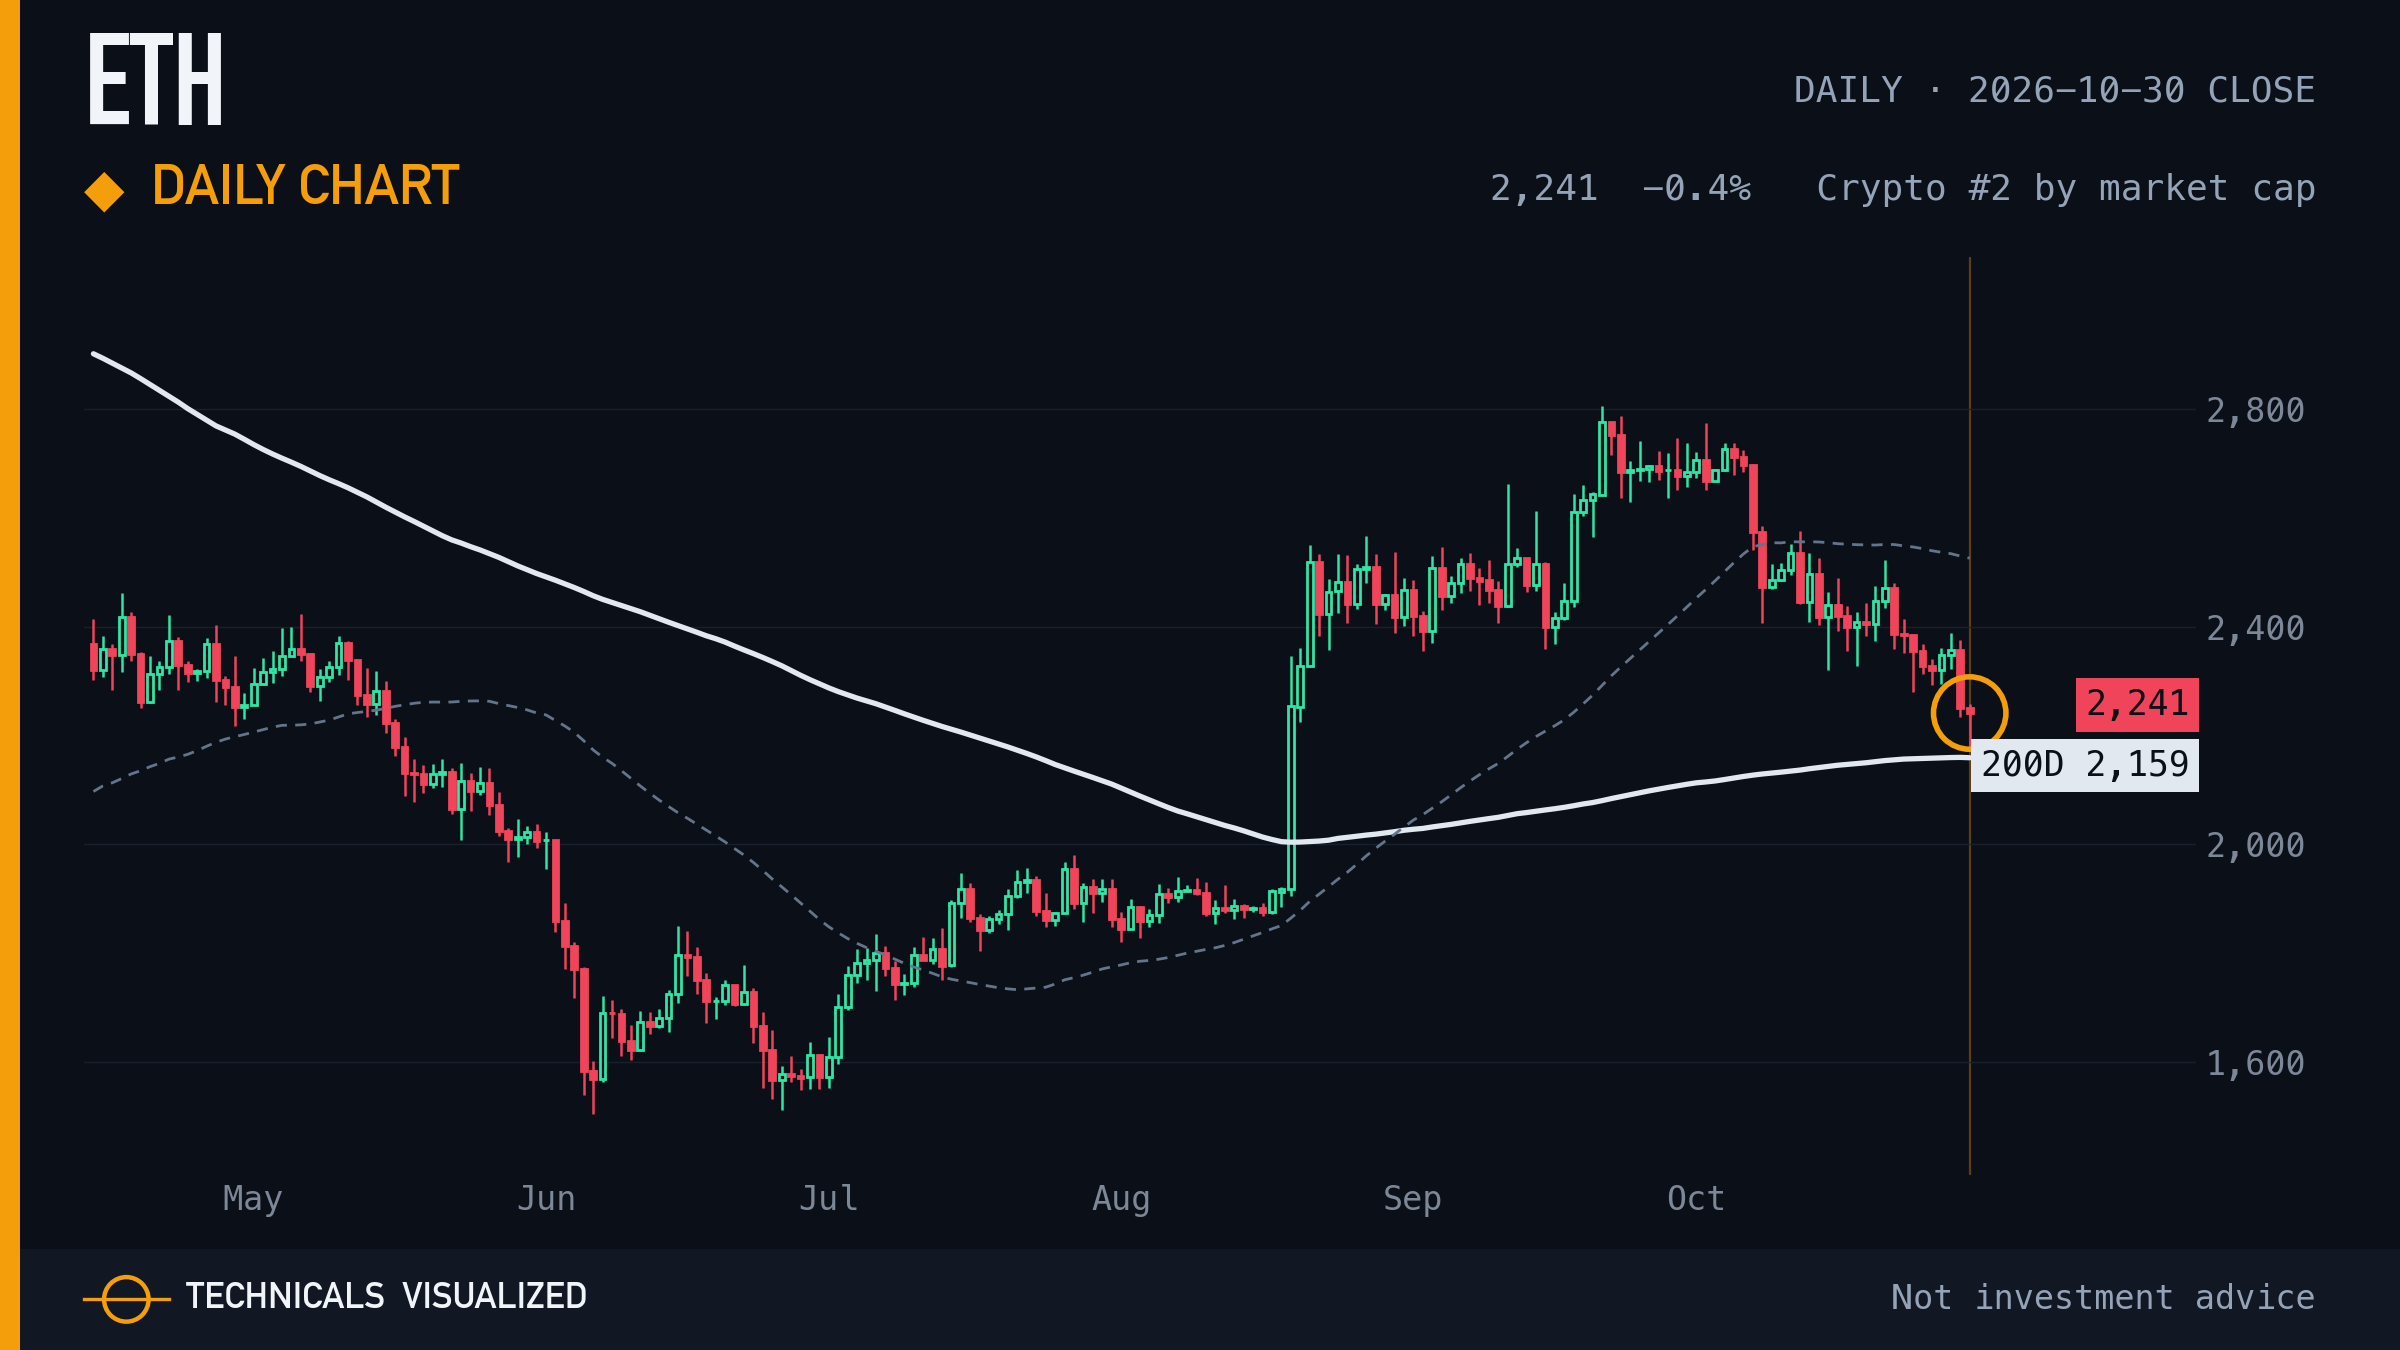
Ethereum closed at $2,241, -0.4% on the day, 3.8% above its 200-day average.
Shown in every edition, whether or not it printed a reading. The amber ring marks this close.
|
|
03 · Solana (SOL) · Daily chart
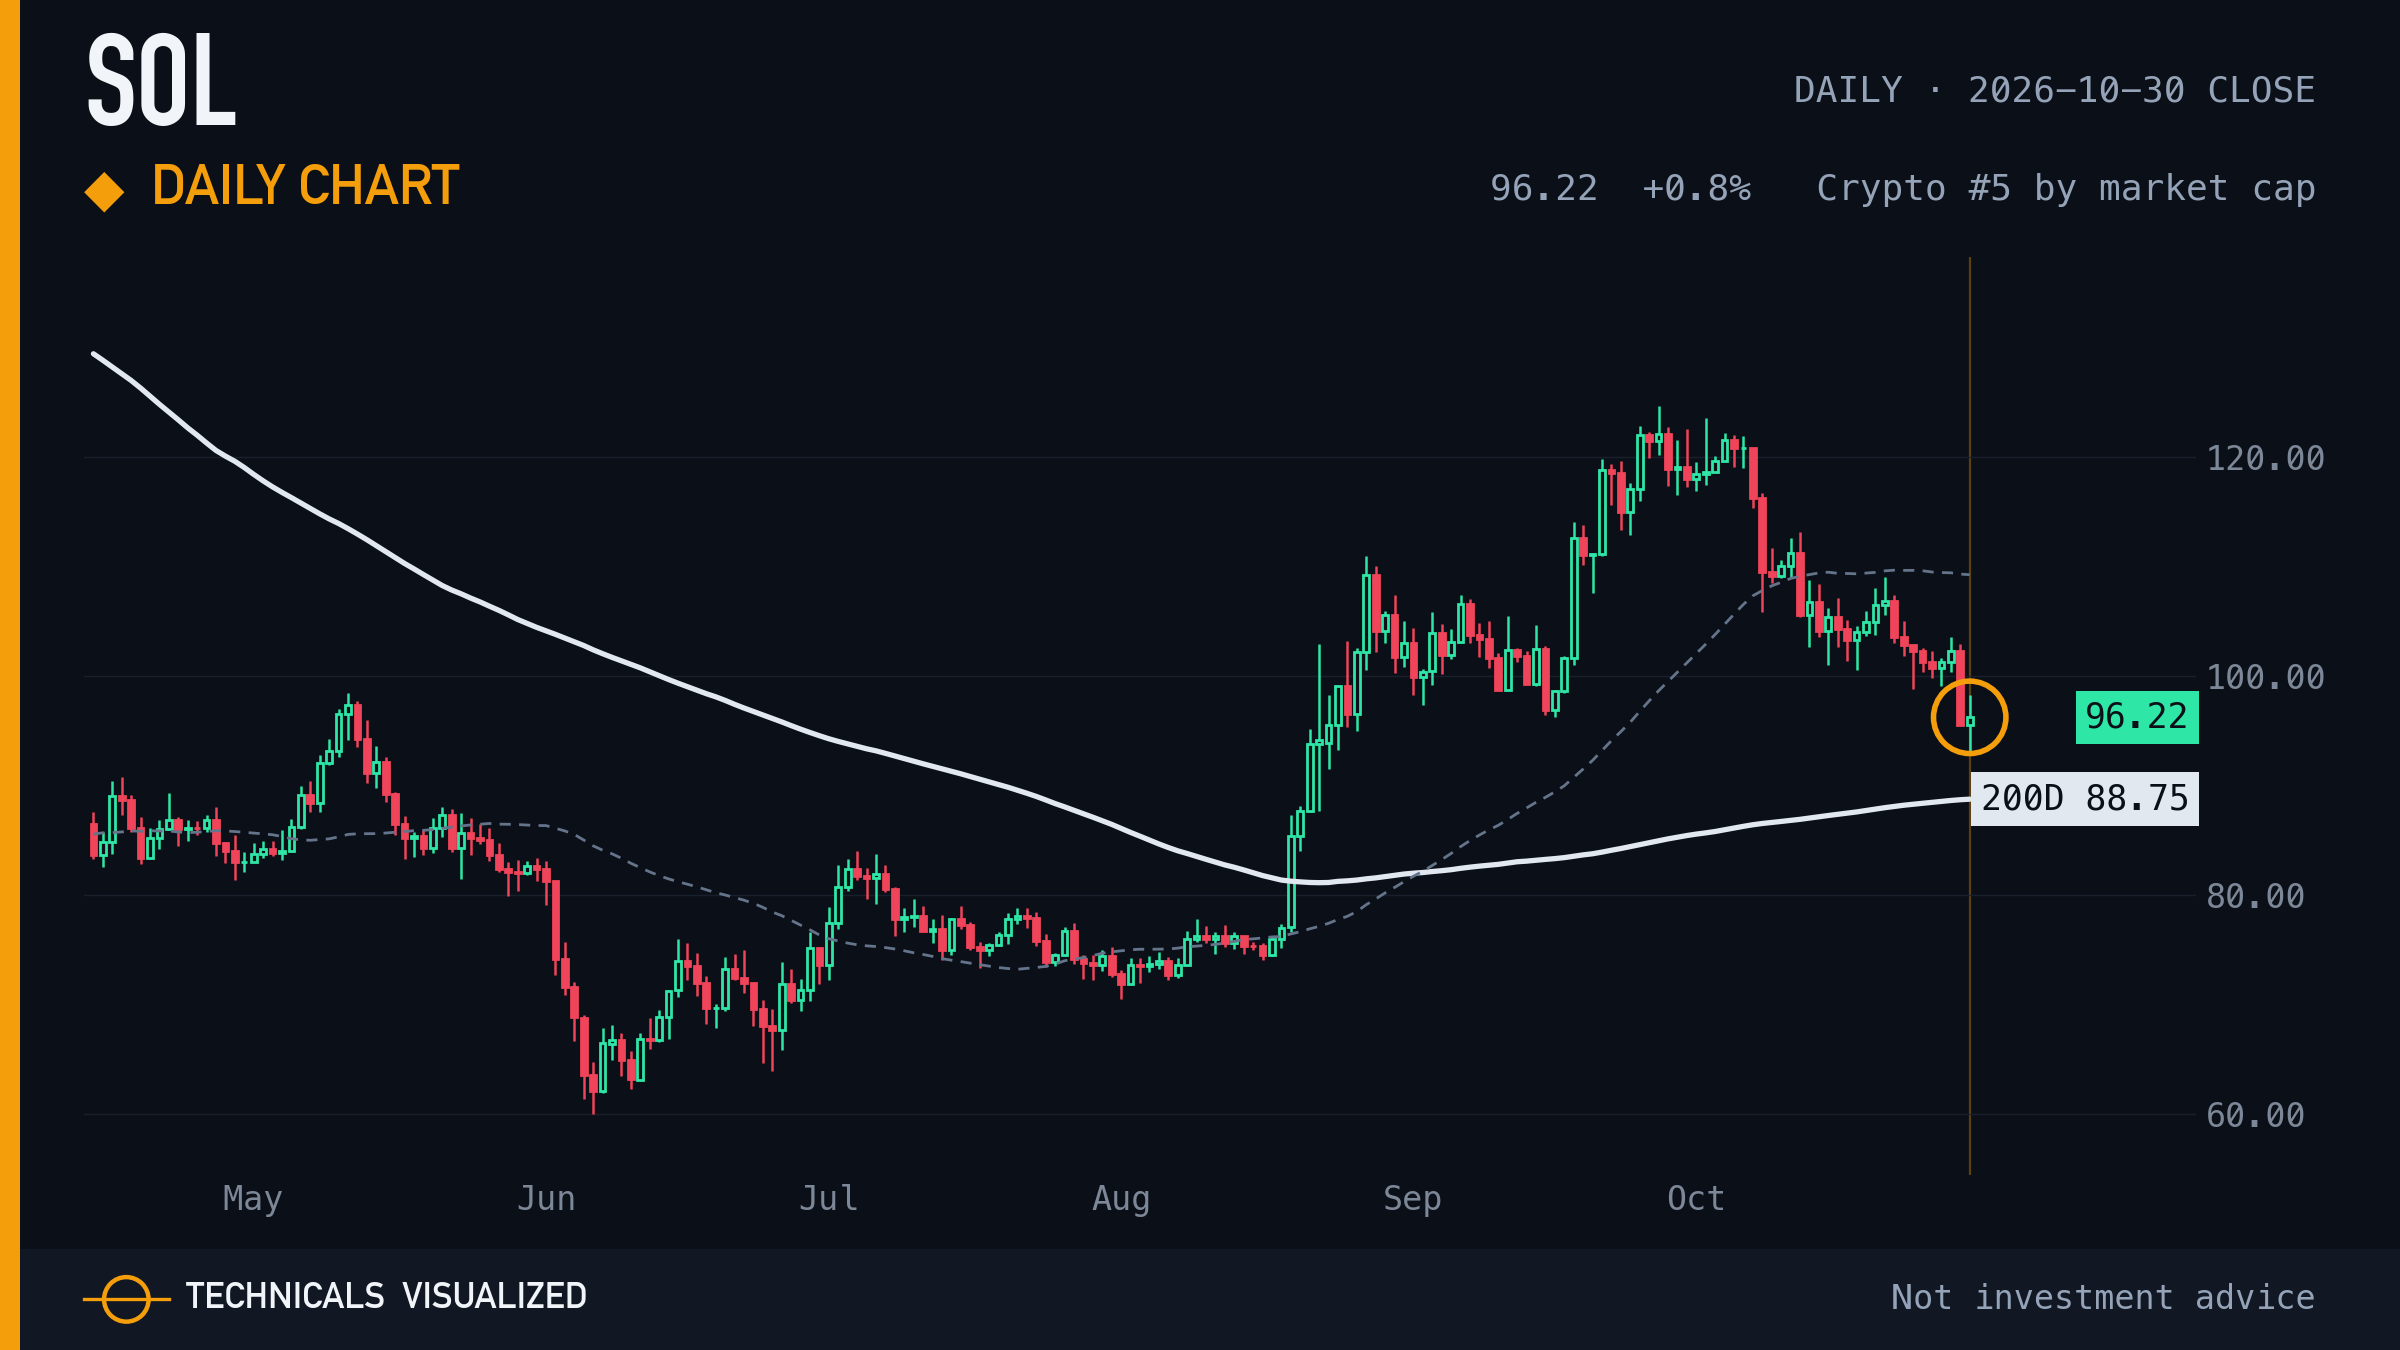
Solana closed at $96.22, +0.8% on the day, 8.4% above its 200-day average.
Shown in every edition, whether or not it printed a reading. The amber ring marks this close.
|
|
04 · Hyperliquid (HYPE) · Relative strength: one-year high
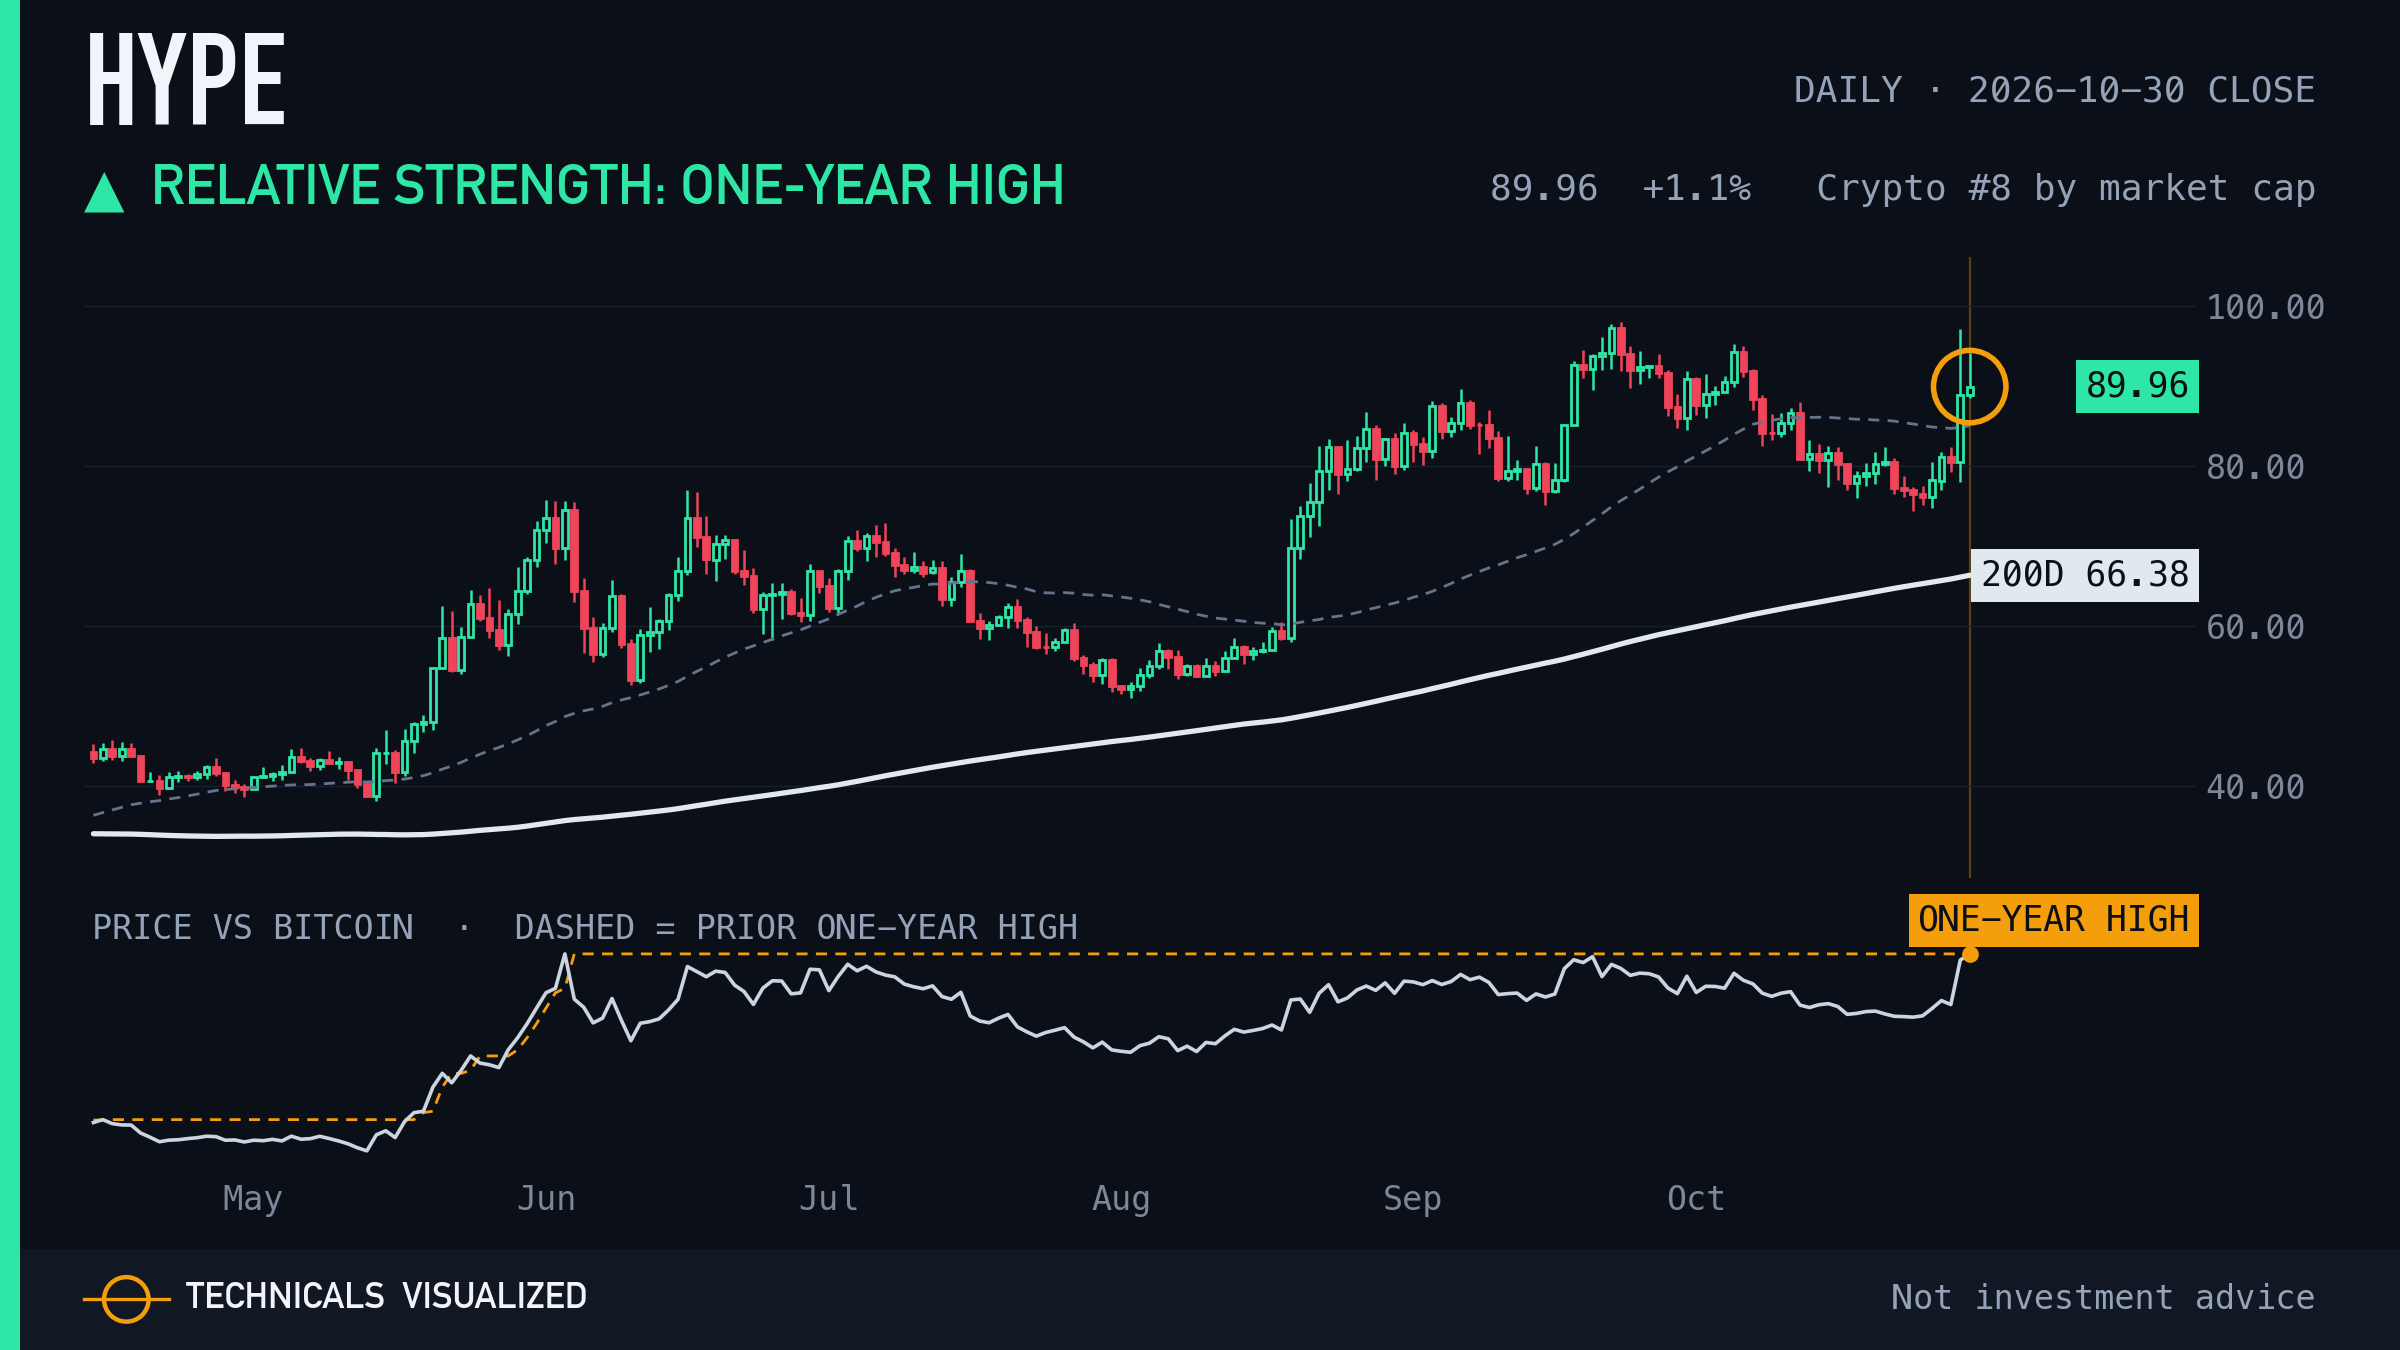
Hyperliquid price relative to the benchmark made its first one-year high in 60+ sessions.
Measured against Bitcoin.
|
Today's readings |
|
05 · Beam · Outsized session
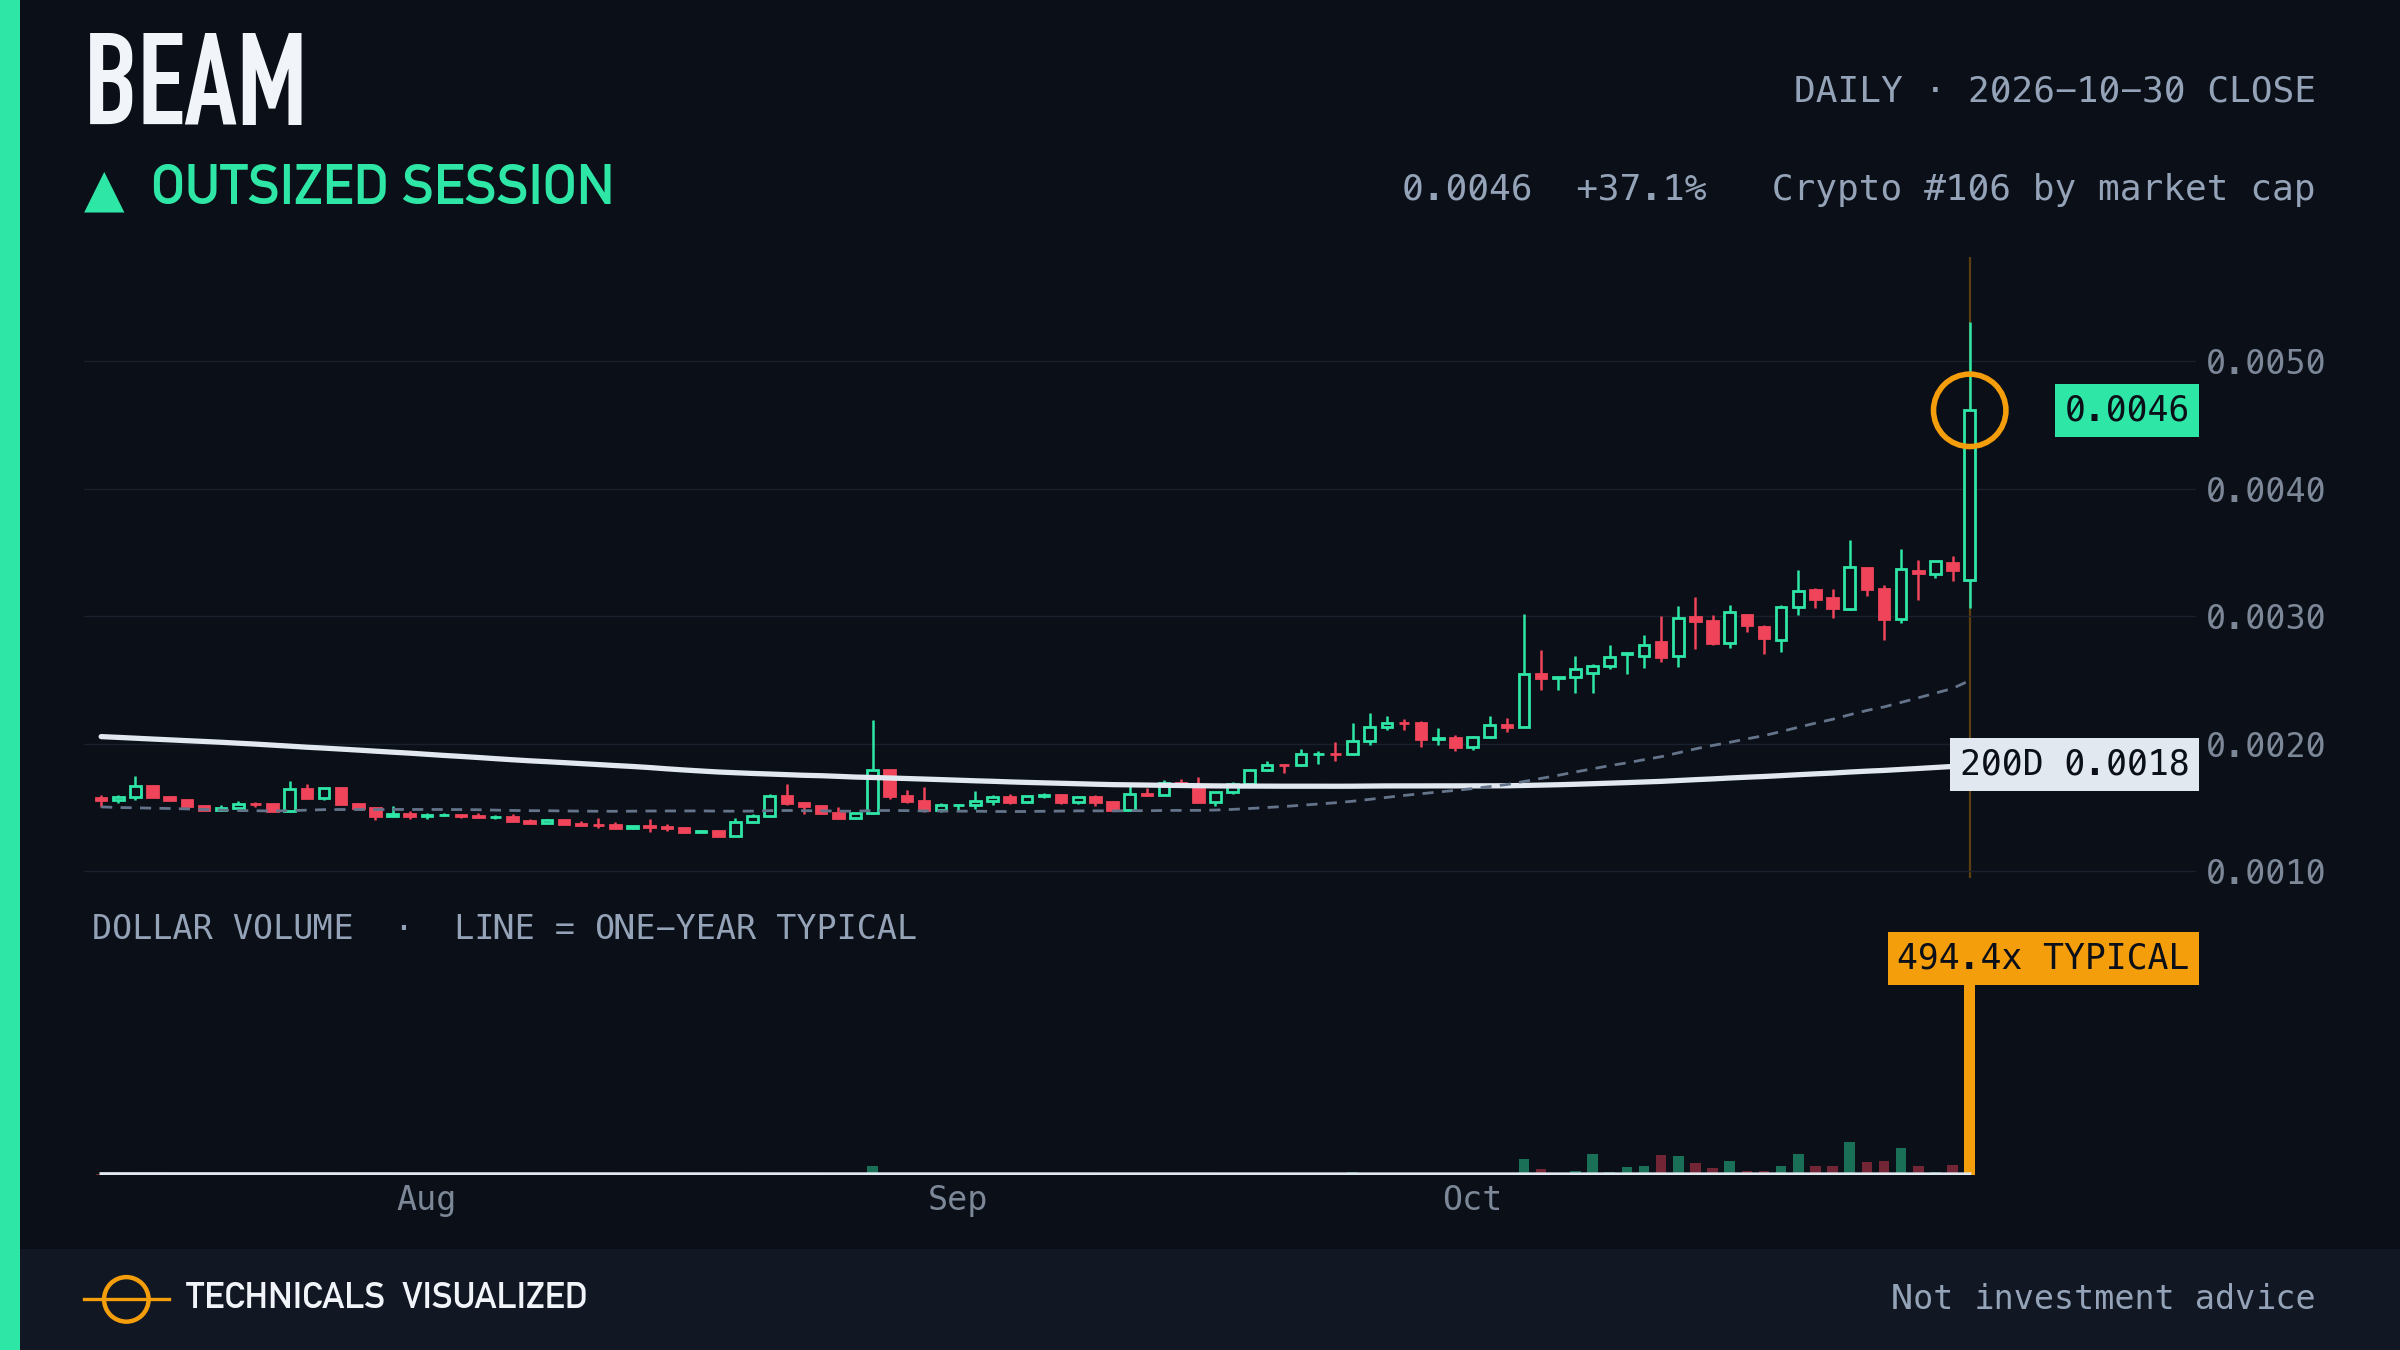
Beam moved +37.1% in one session, 6.4 times its usual daily move.
One session, measured against this chart's own usual move. It describes the day, not the next one.
|
|
06 · Pepe · Relative strength: one-year high
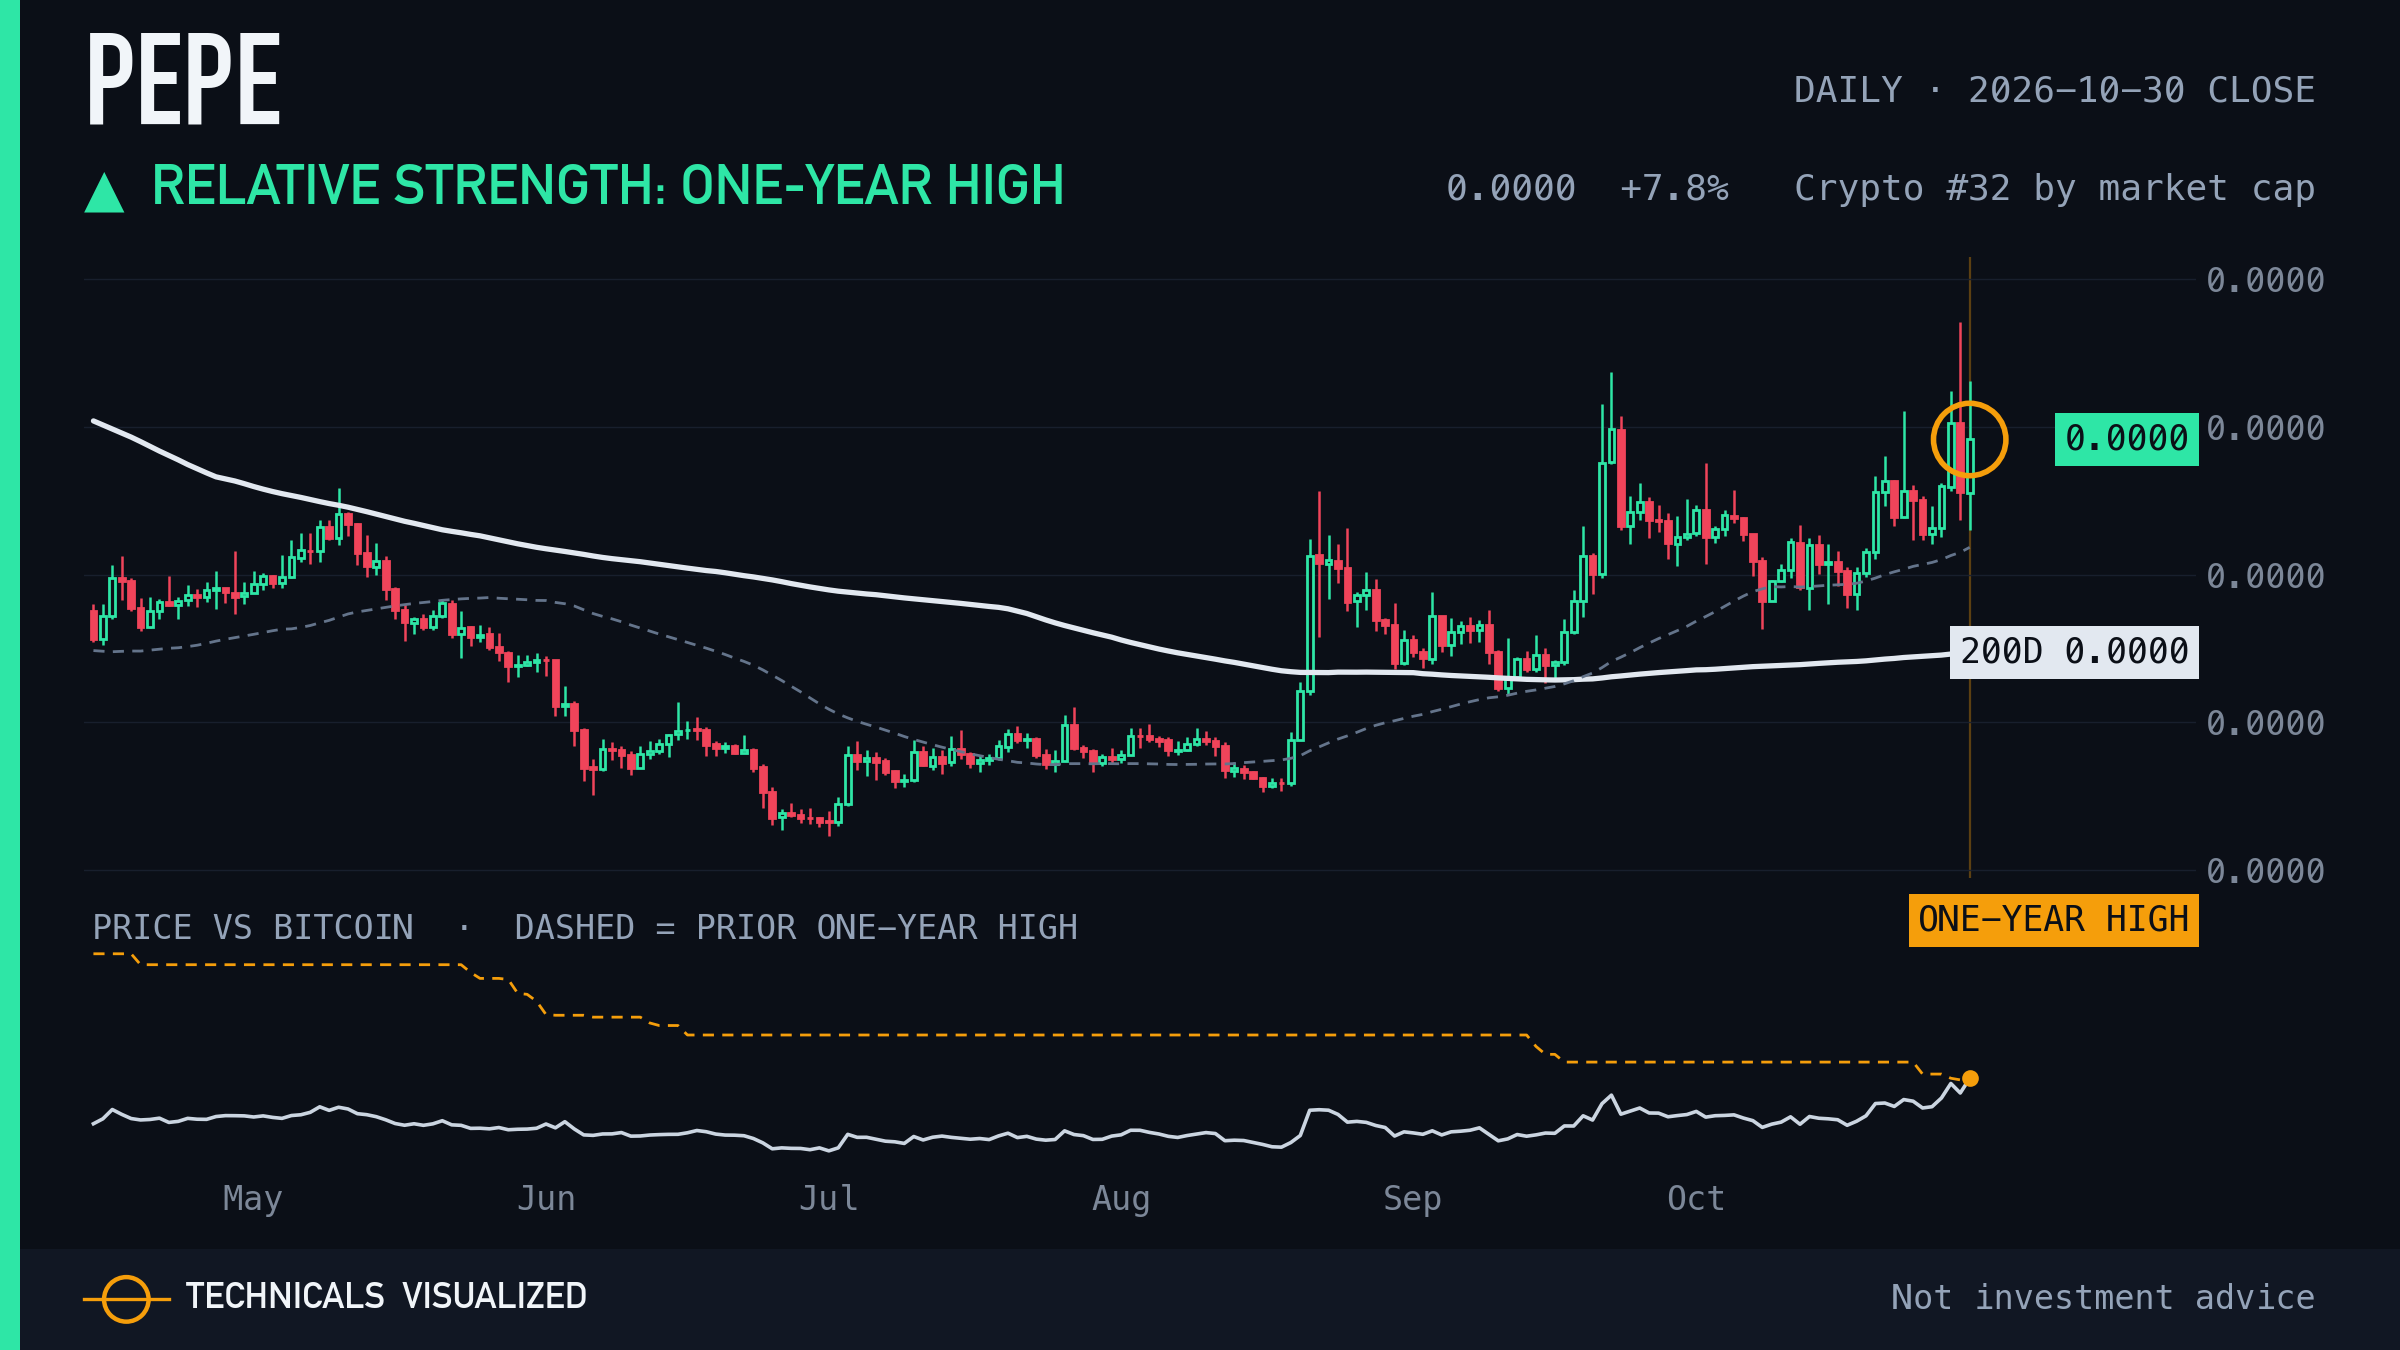
Pepe price relative to the benchmark made its first one-year high in 60+ sessions.
Measured against Bitcoin.
|
|
07 · Aave · Exhaustion count (daily)
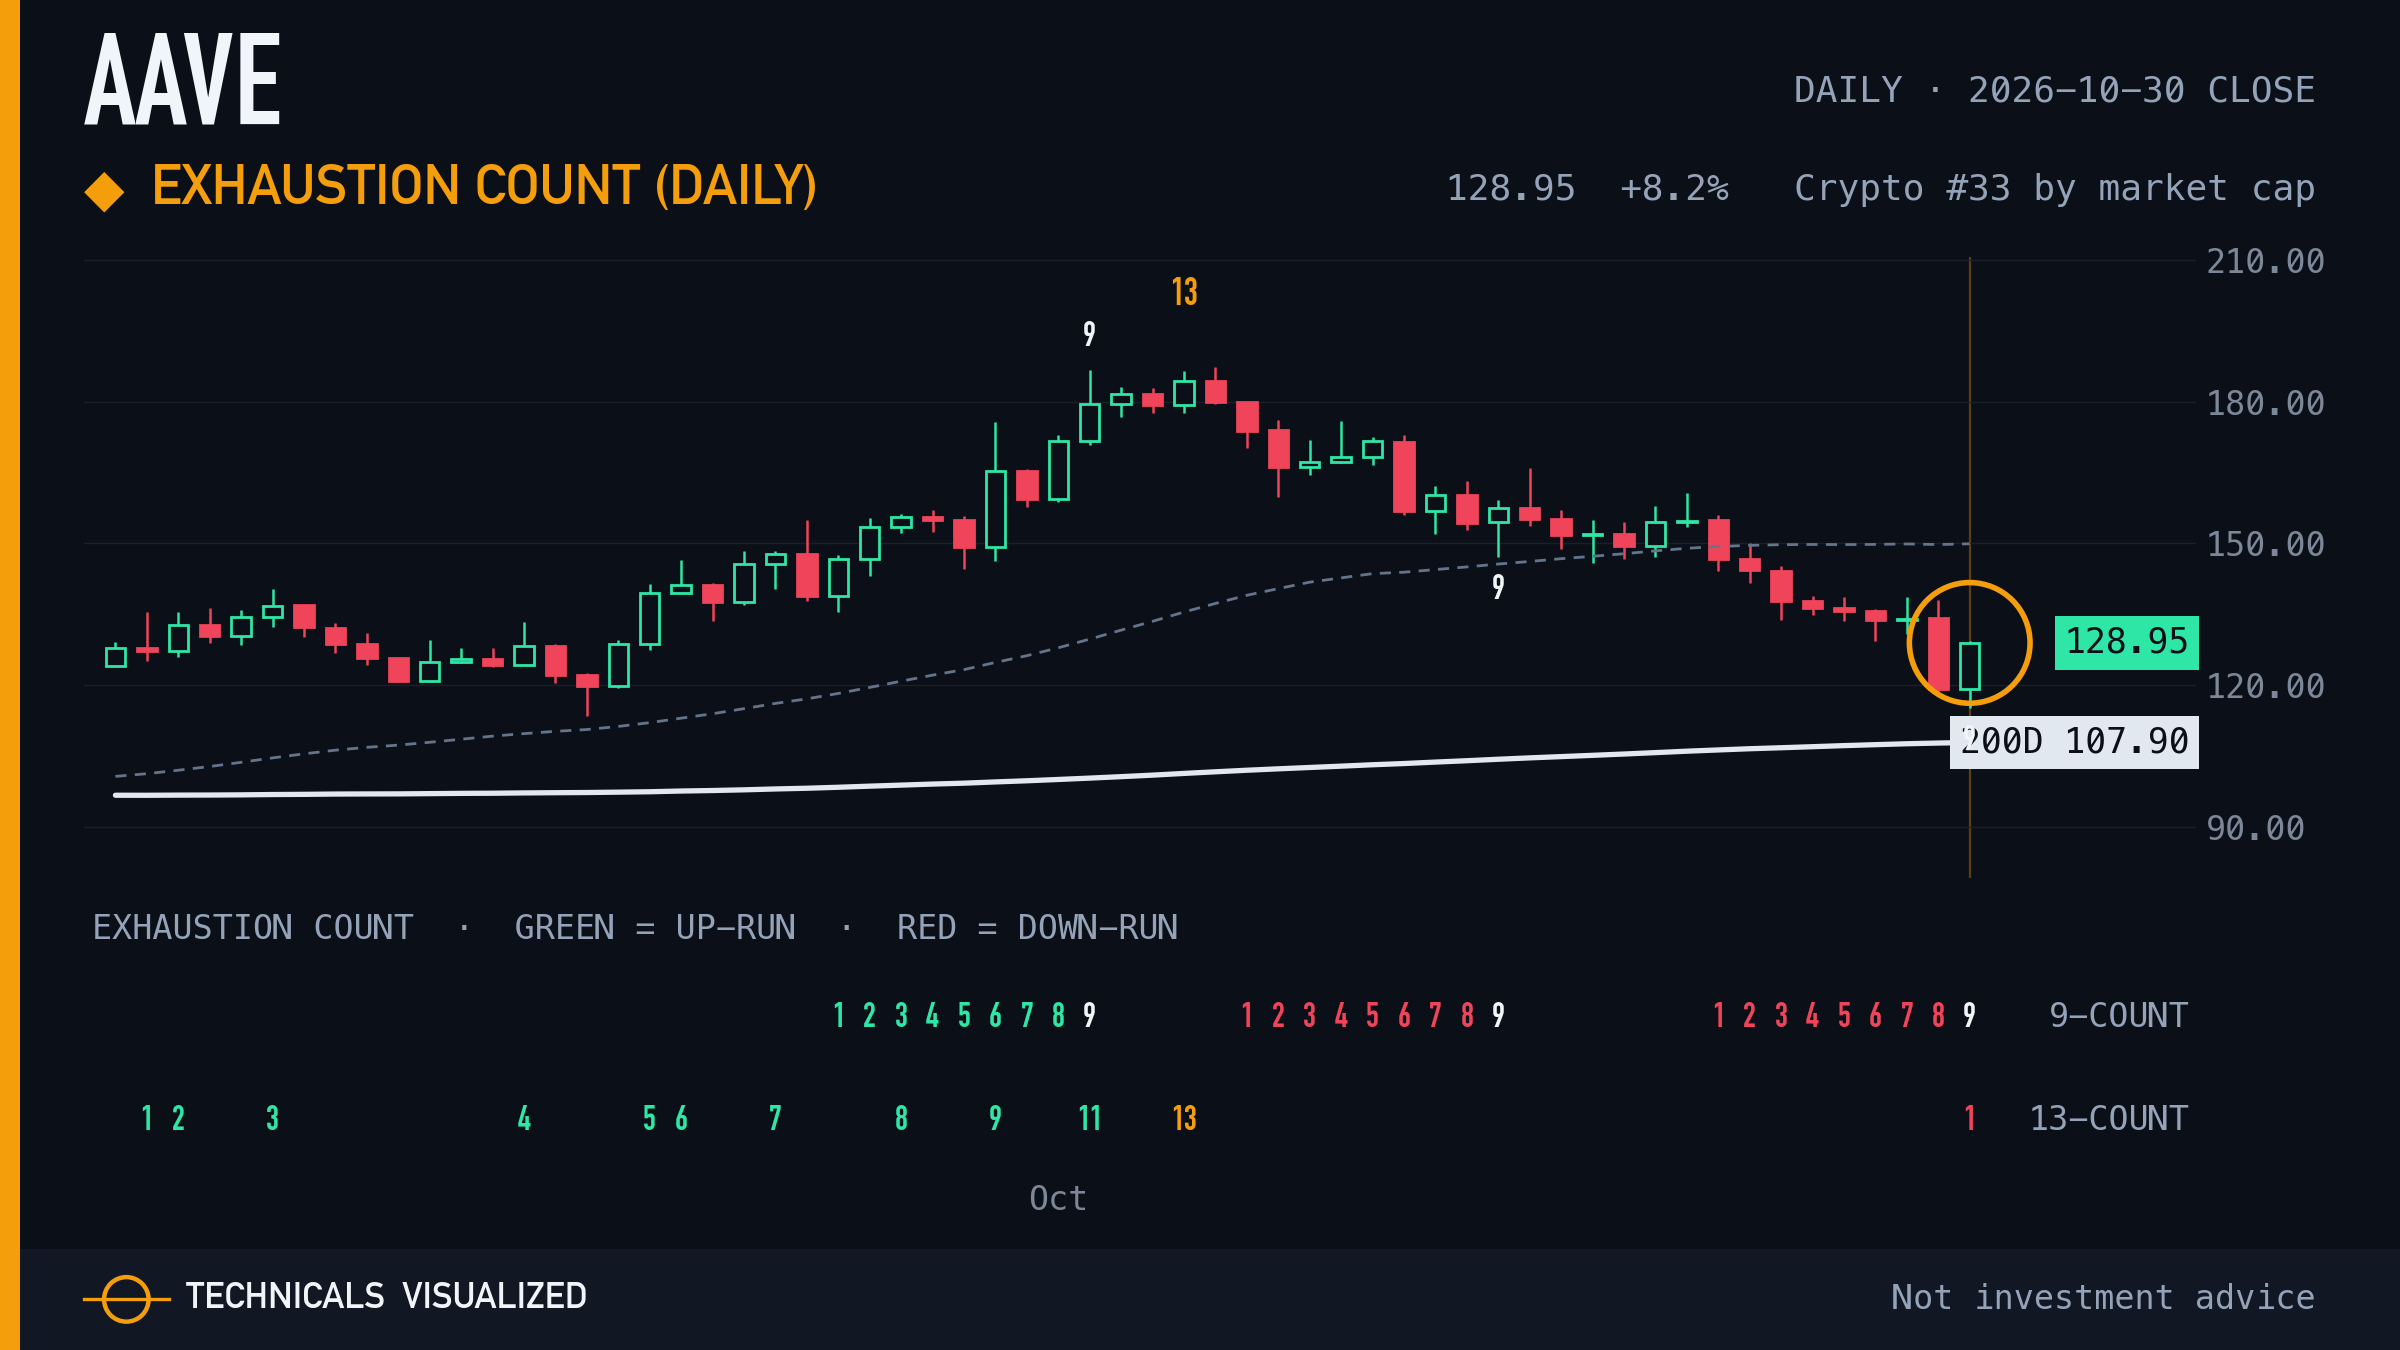
Aave daily exhaustion count: setup phase complete and qualified (downside count).
A completed setup marks a stretched run. It is a pause marker, not a turn signal.
|
|
08 · Cardano (ADA) · Exhaustion count (daily)
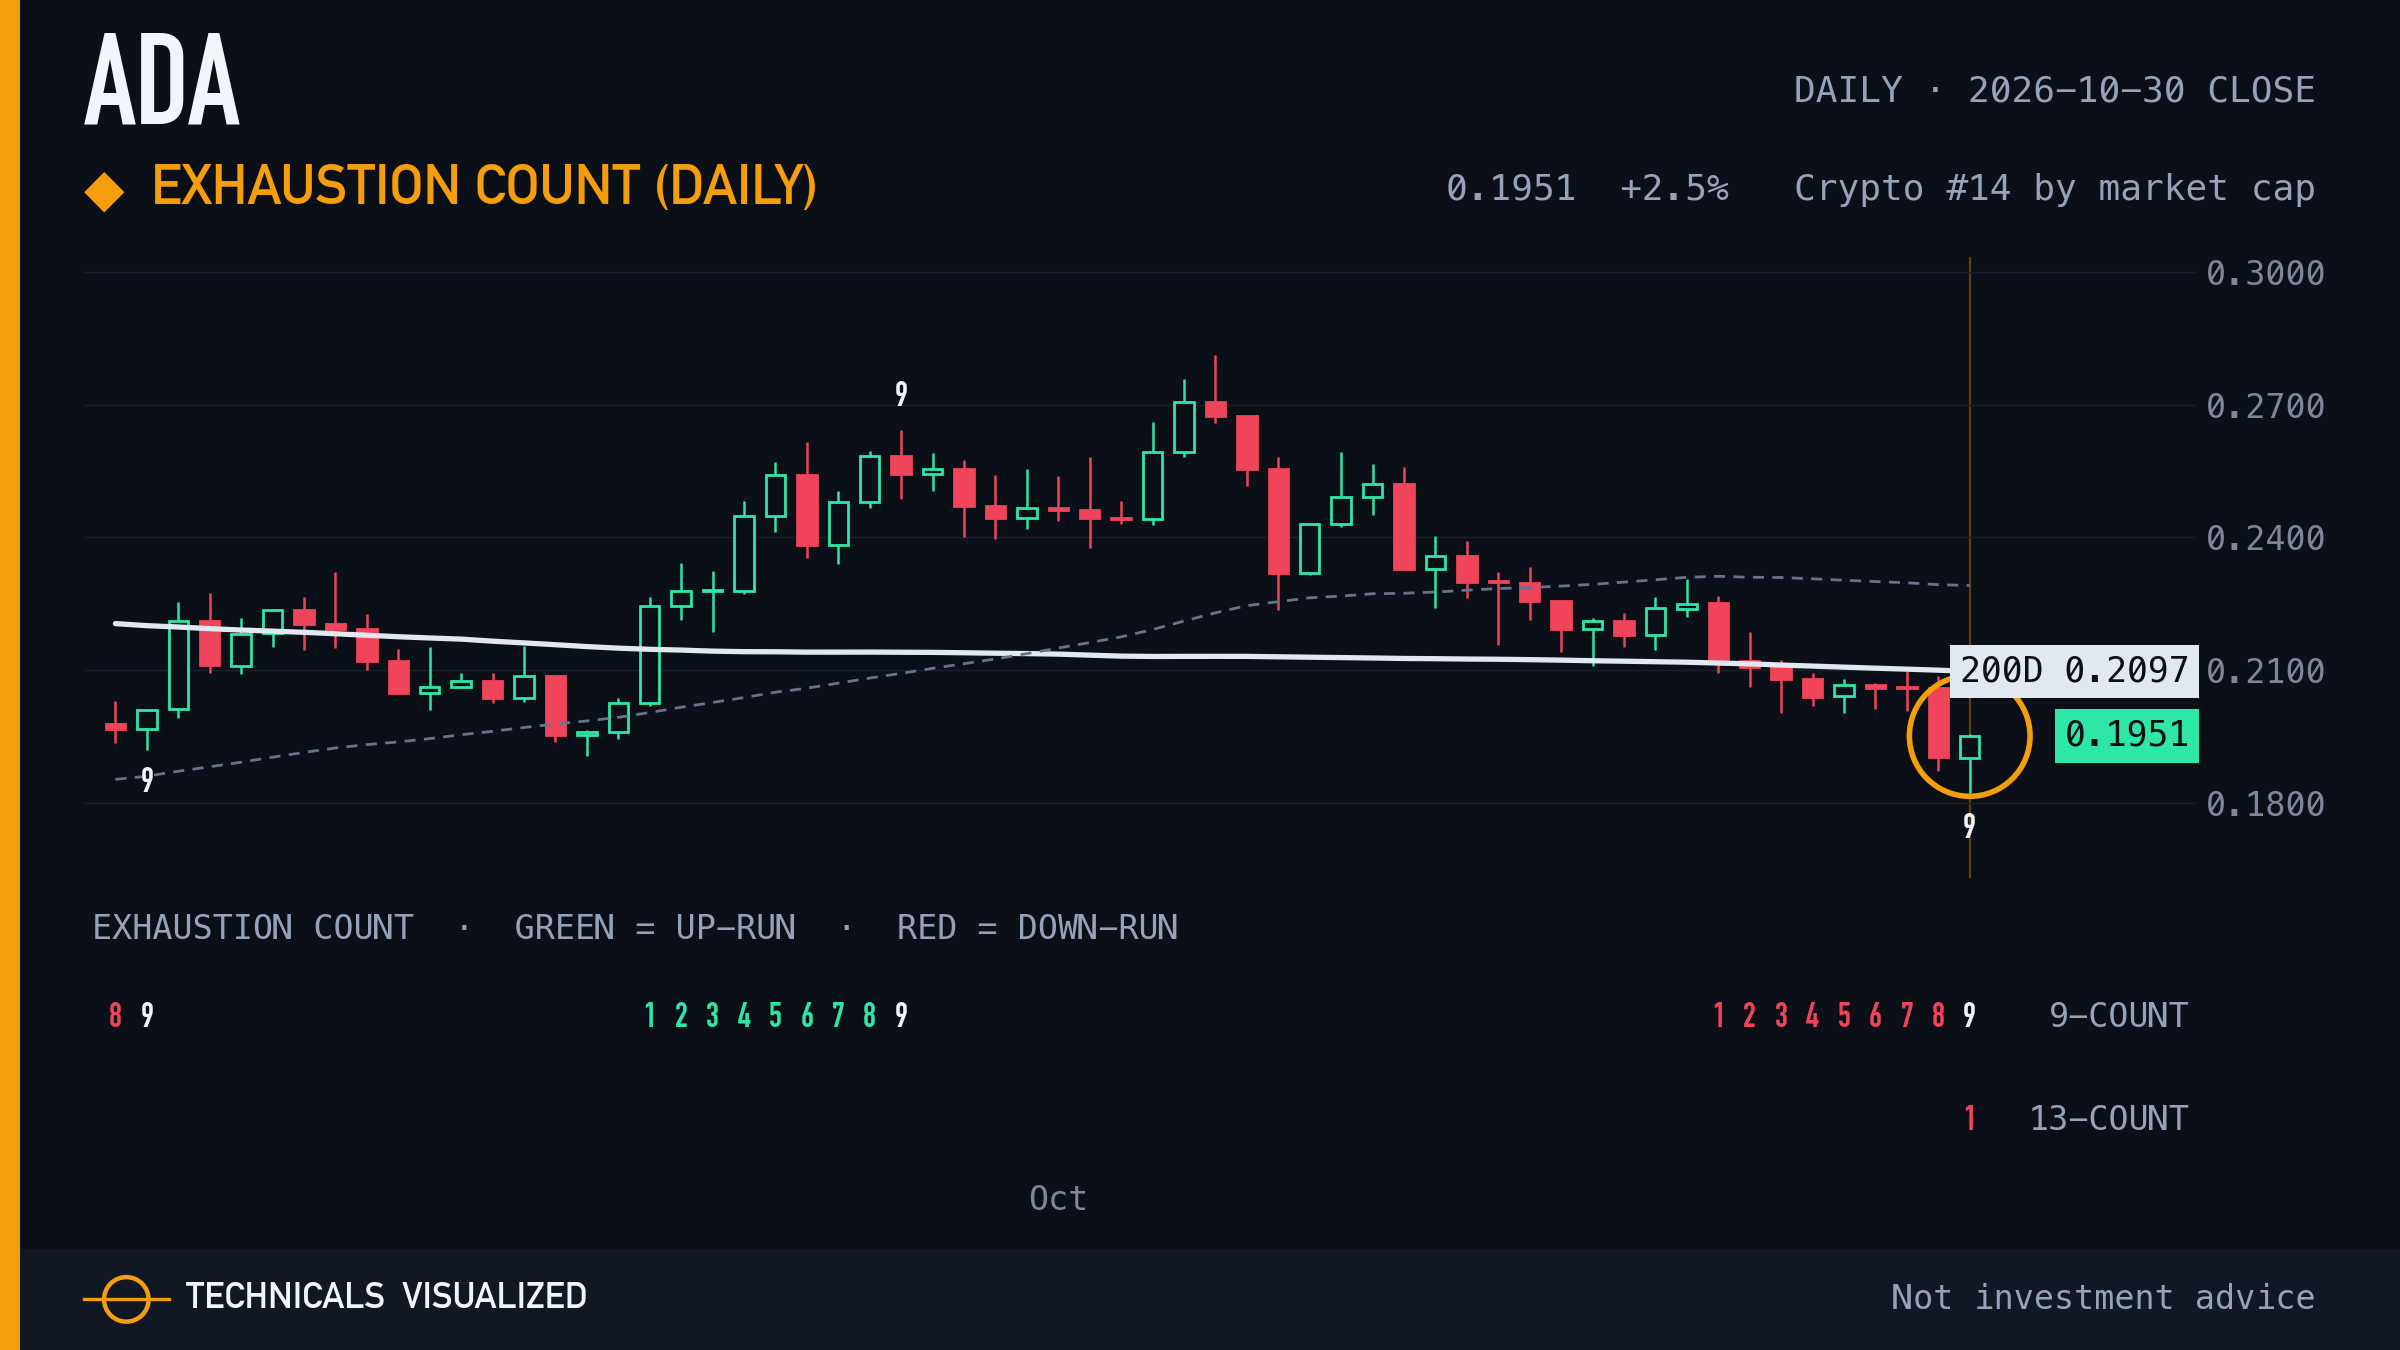
Cardano daily exhaustion count: setup phase complete and qualified (downside count).
A completed setup marks a stretched run. It is a pause marker, not a turn signal.
|
|
09 · Polkadot (DOT) · Exhaustion count (daily)
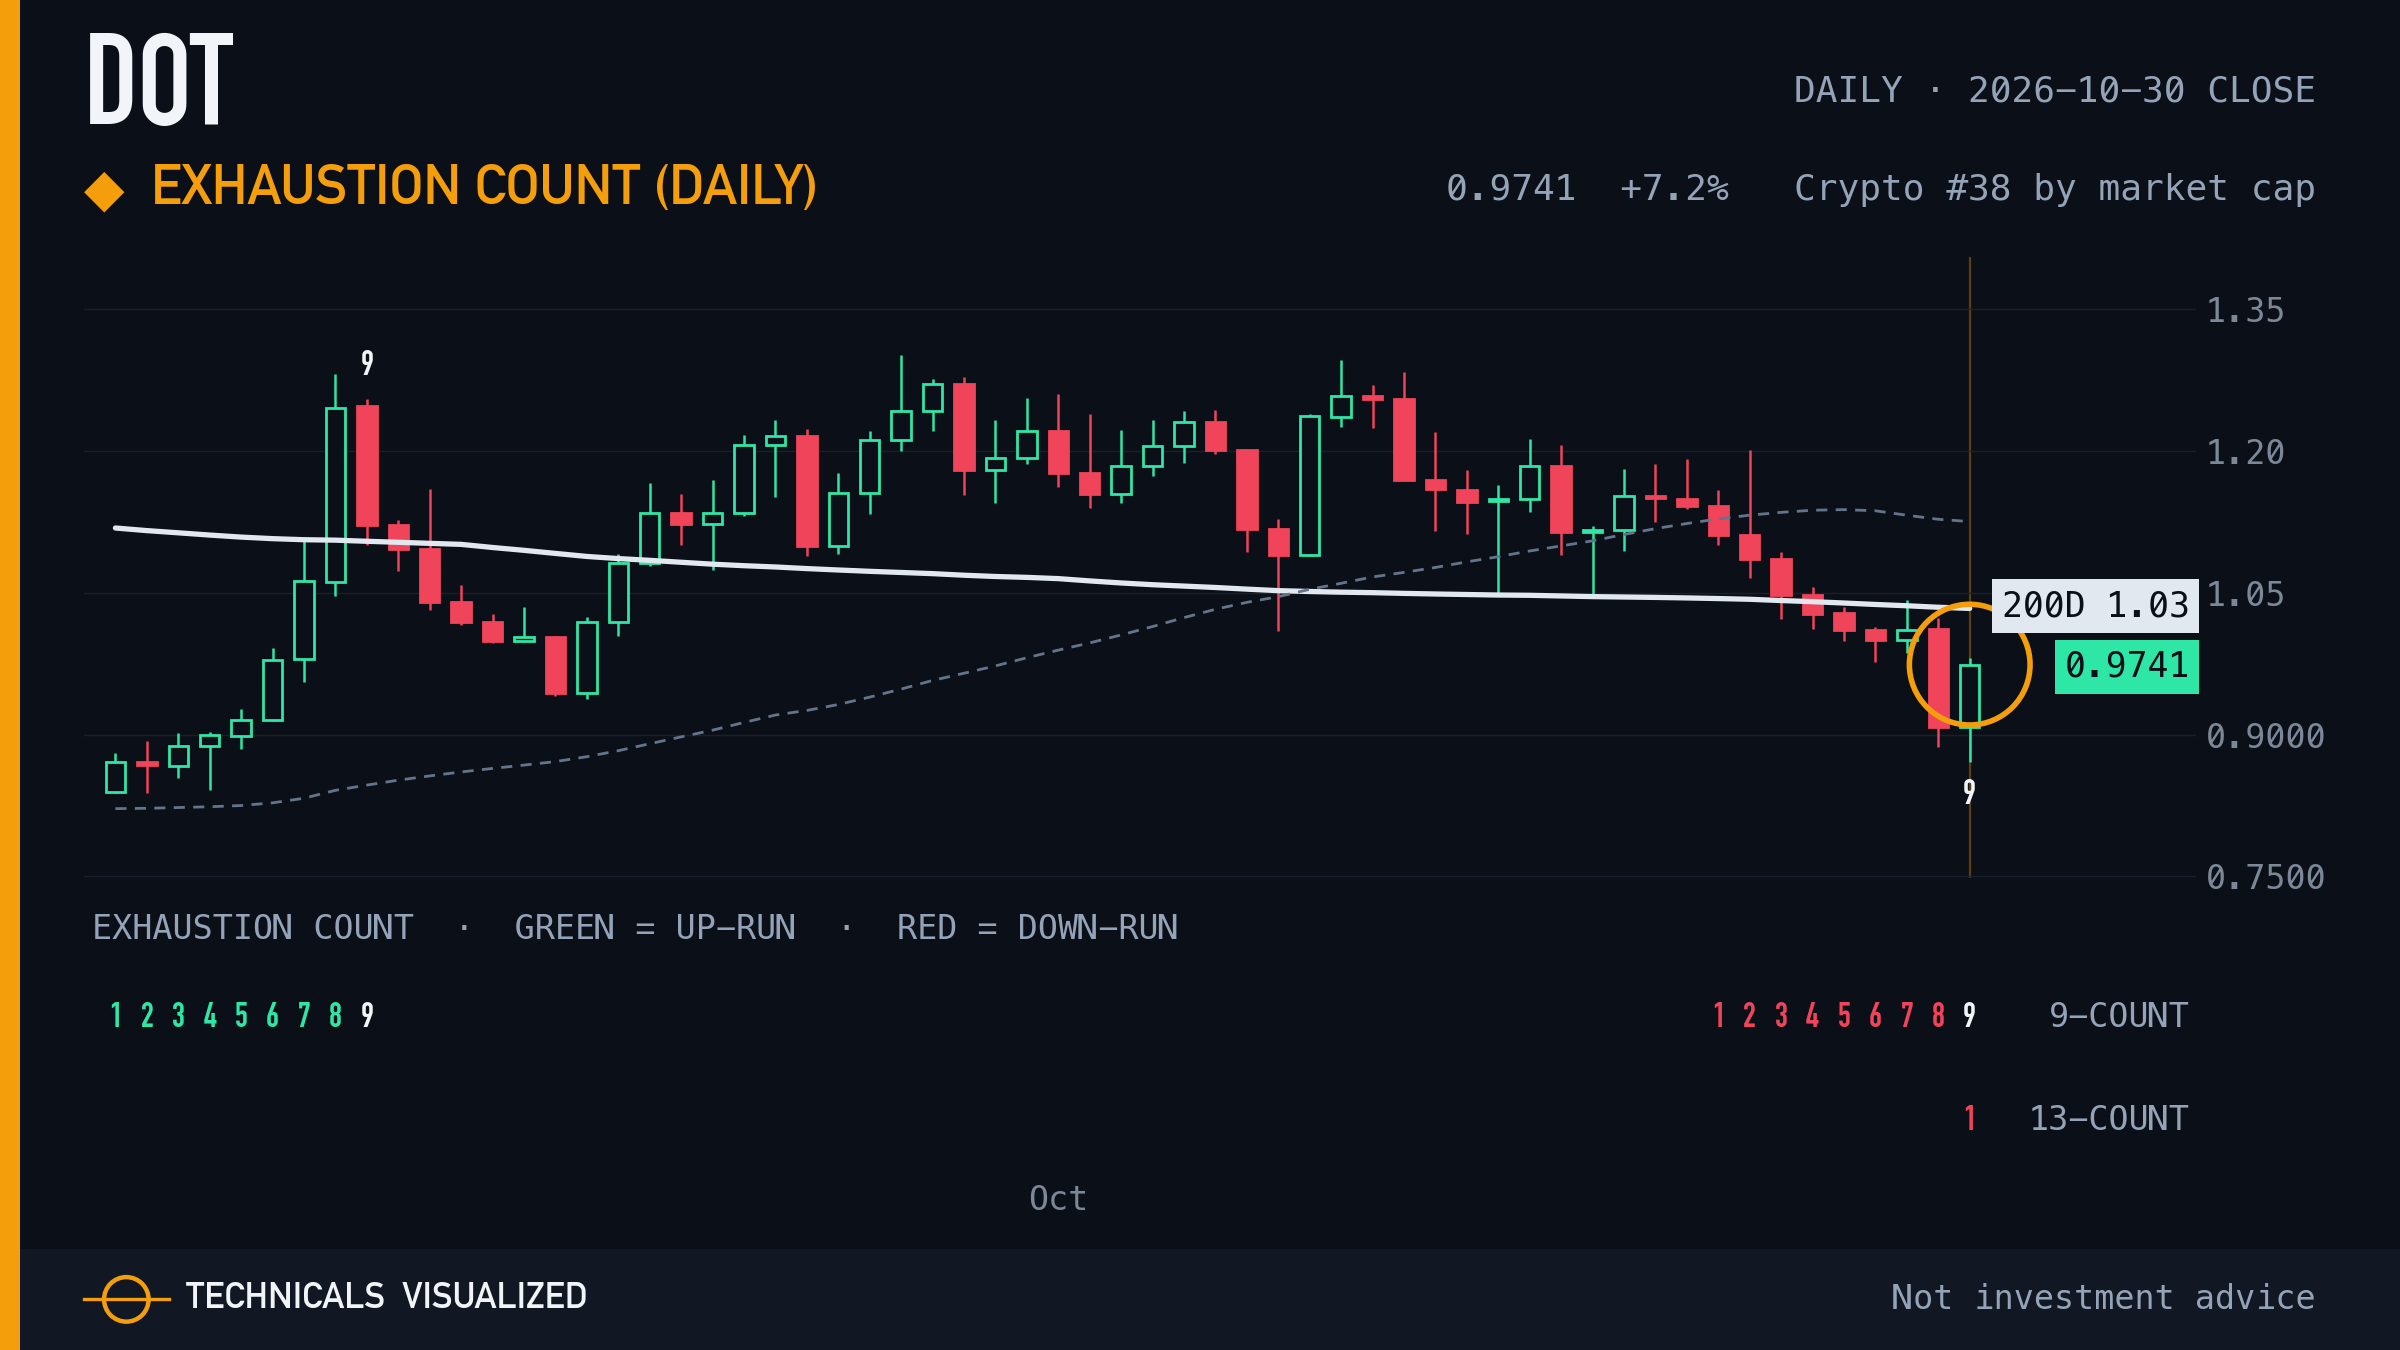
Polkadot daily exhaustion count: setup phase complete and qualified (downside count).
A completed setup marks a stretched run. It is a pause marker, not a turn signal.
|
|
10 · Pendle · Exhaustion count (daily)
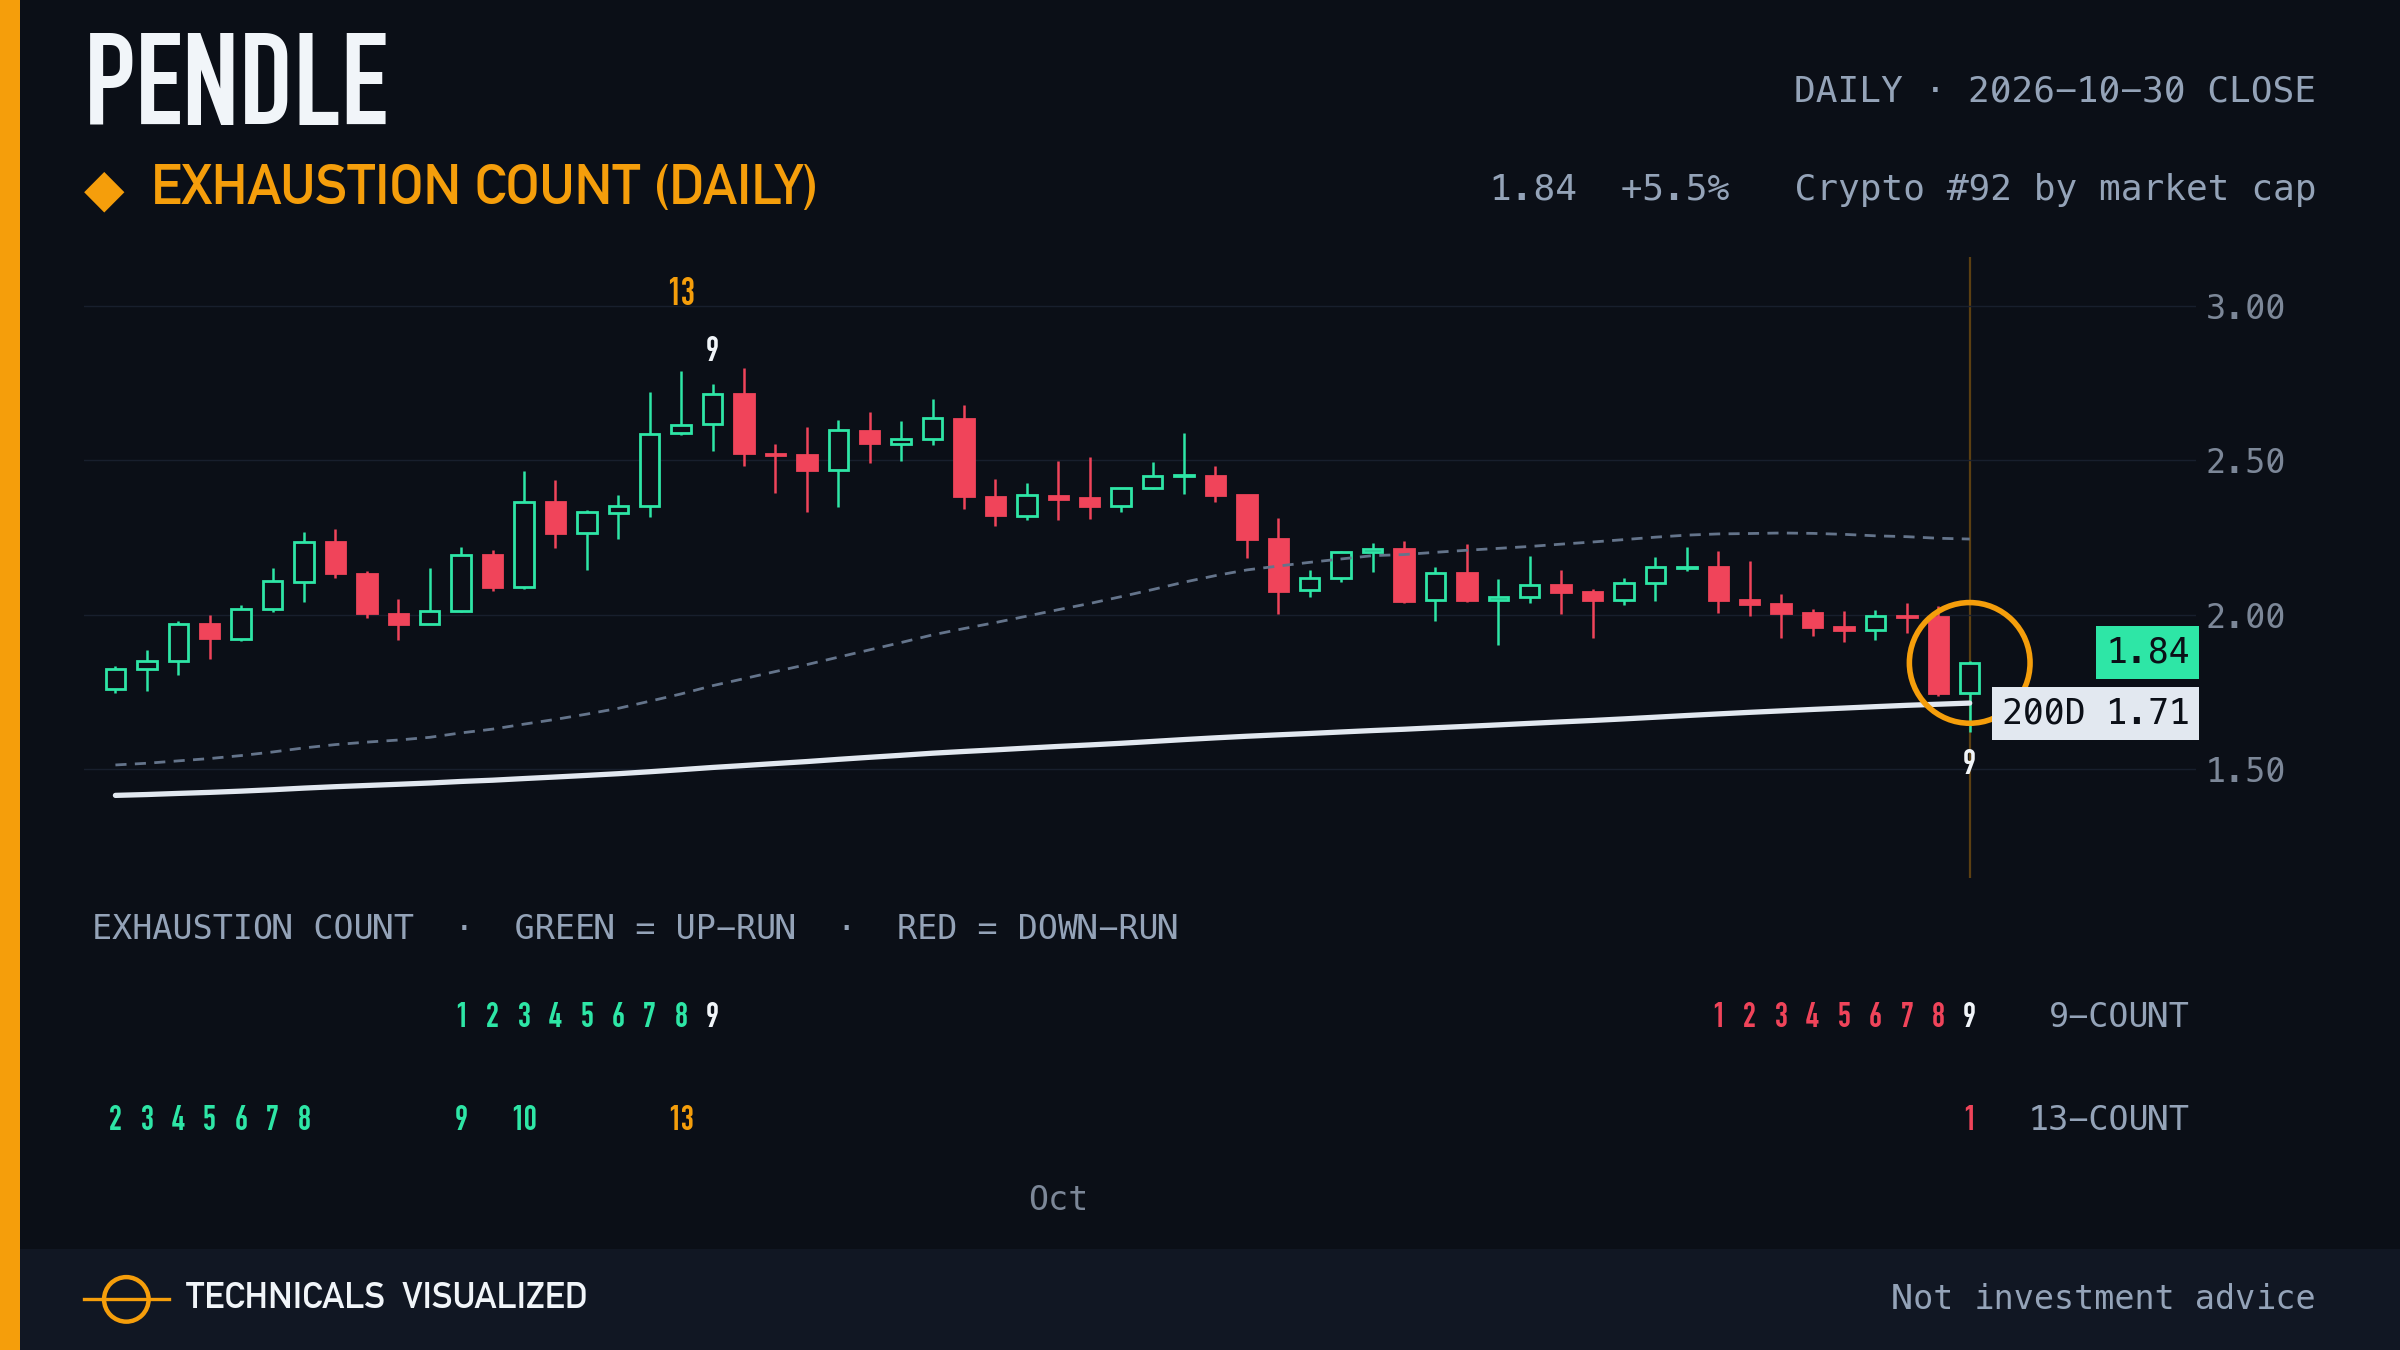
Pendle daily exhaustion count: setup phase complete and qualified (downside count).
A completed setup marks a stretched run. It is a pause marker, not a turn signal.
|
|
11 · Aptos (APT) · Exhaustion count (daily)
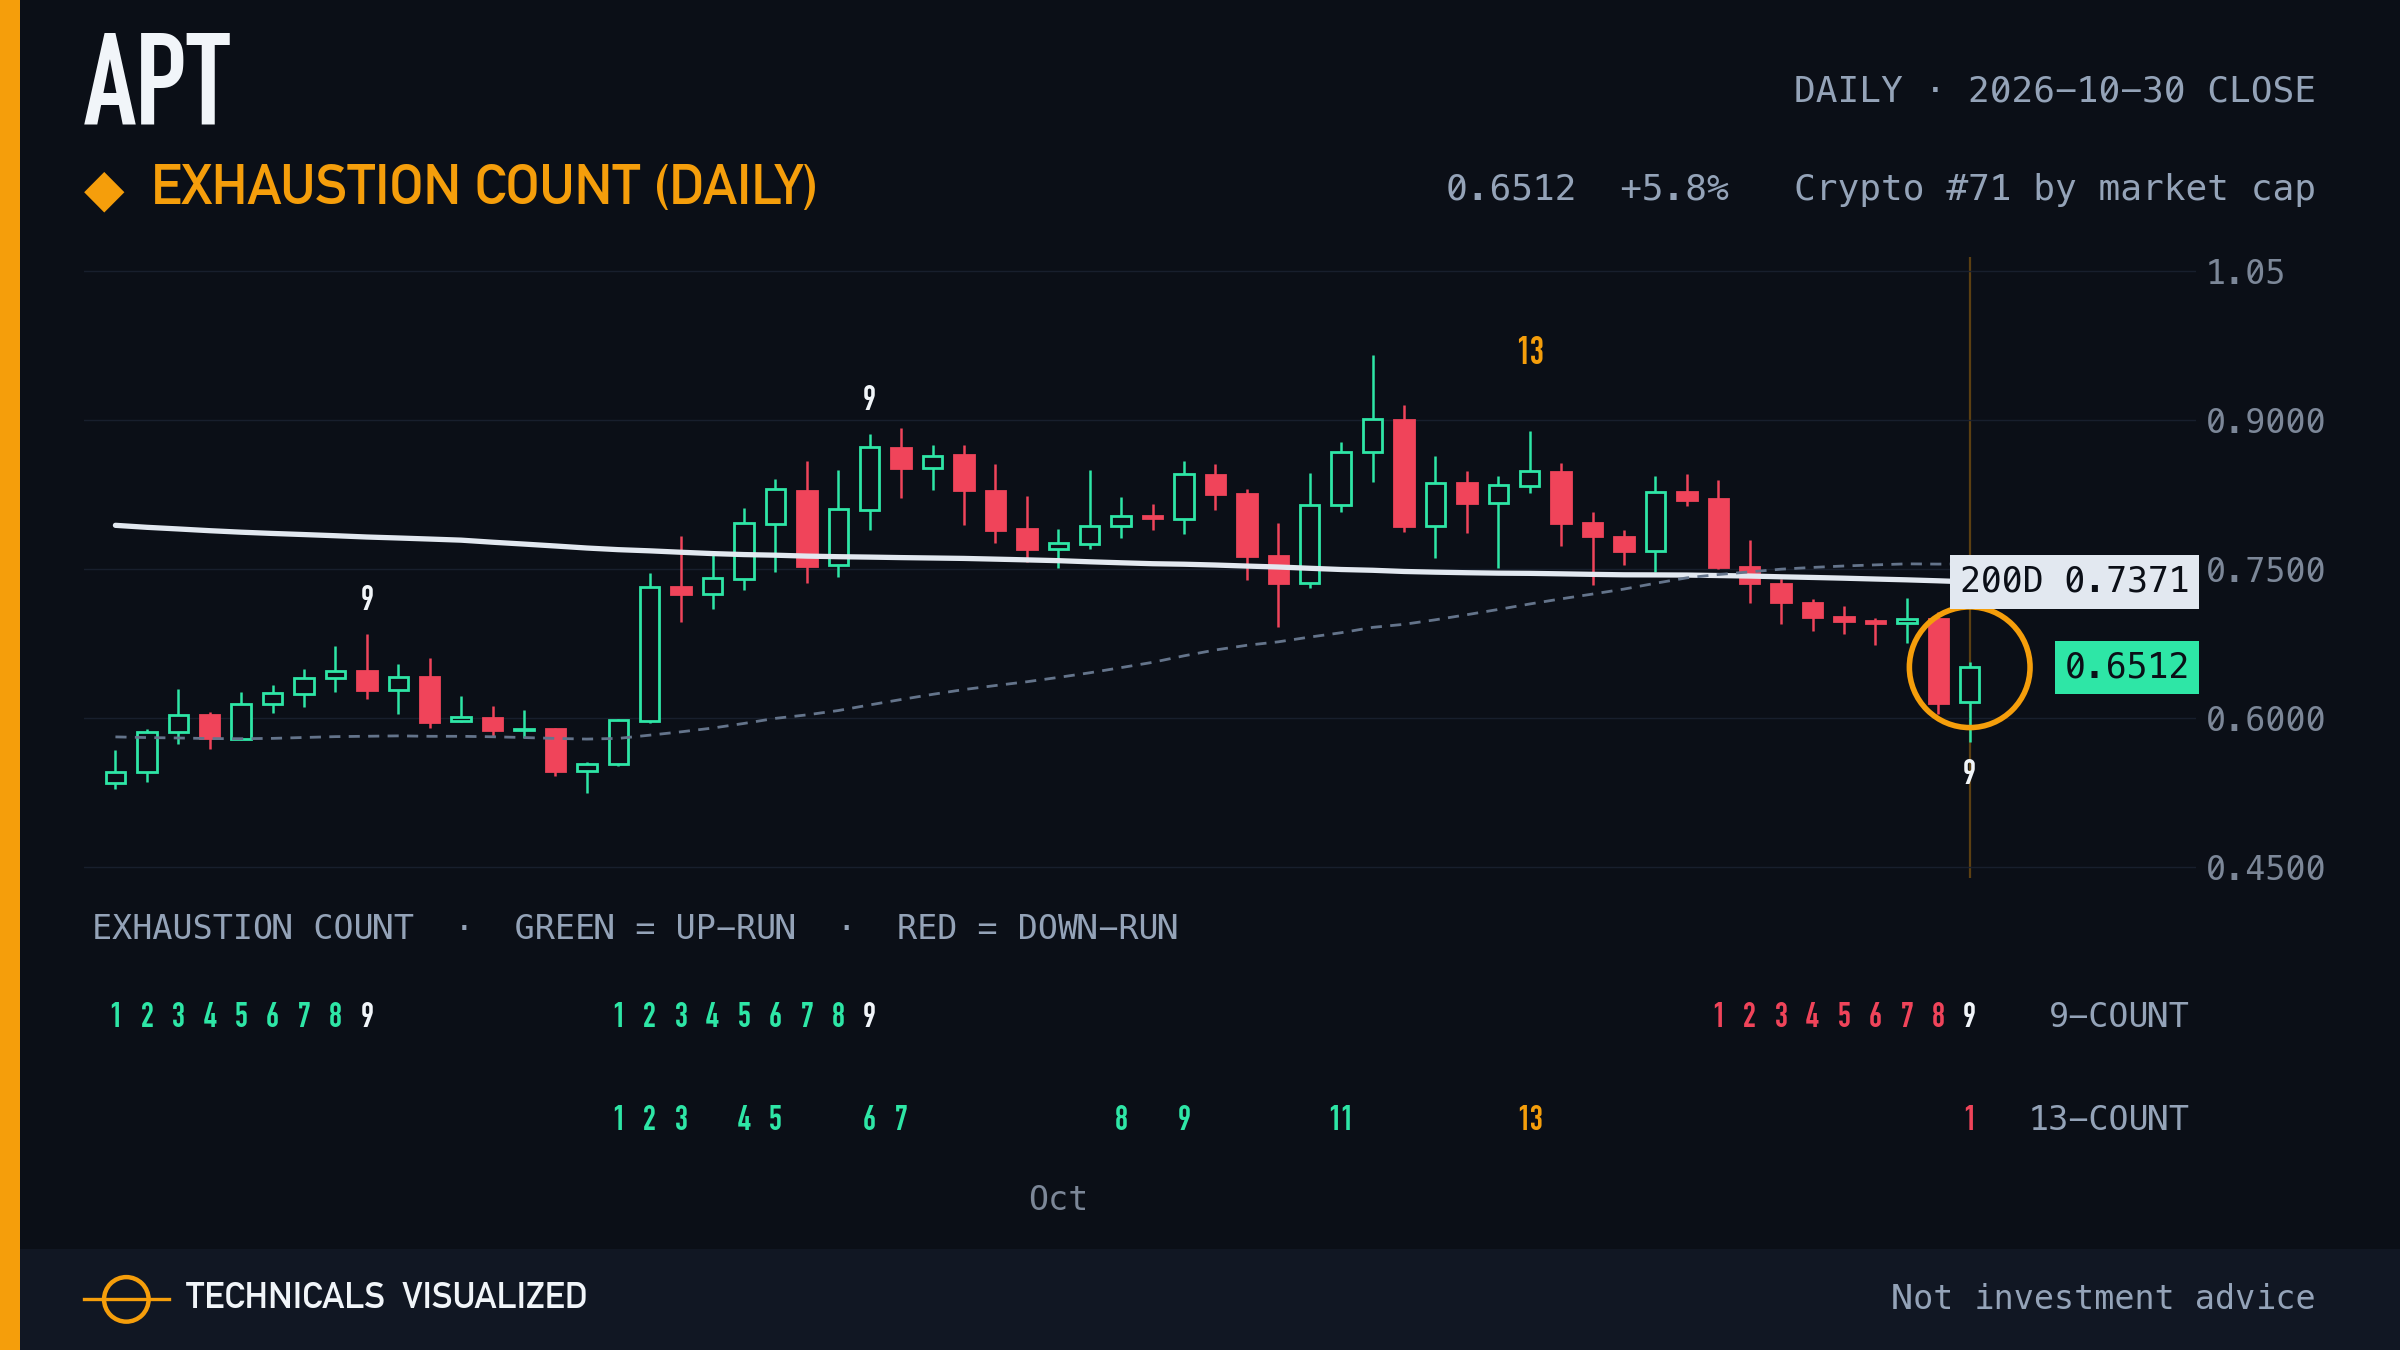
Aptos daily exhaustion count: setup phase complete and qualified (downside count).
A completed setup marks a stretched run. It is a pause marker, not a turn signal.
|