IndicesThe same five every day: US large caps, the Nasdaq 100, small caps, long Treasuries and crude oil. |
|
01 · SPDR S&P 500 ETF (SPY) · Daily chart
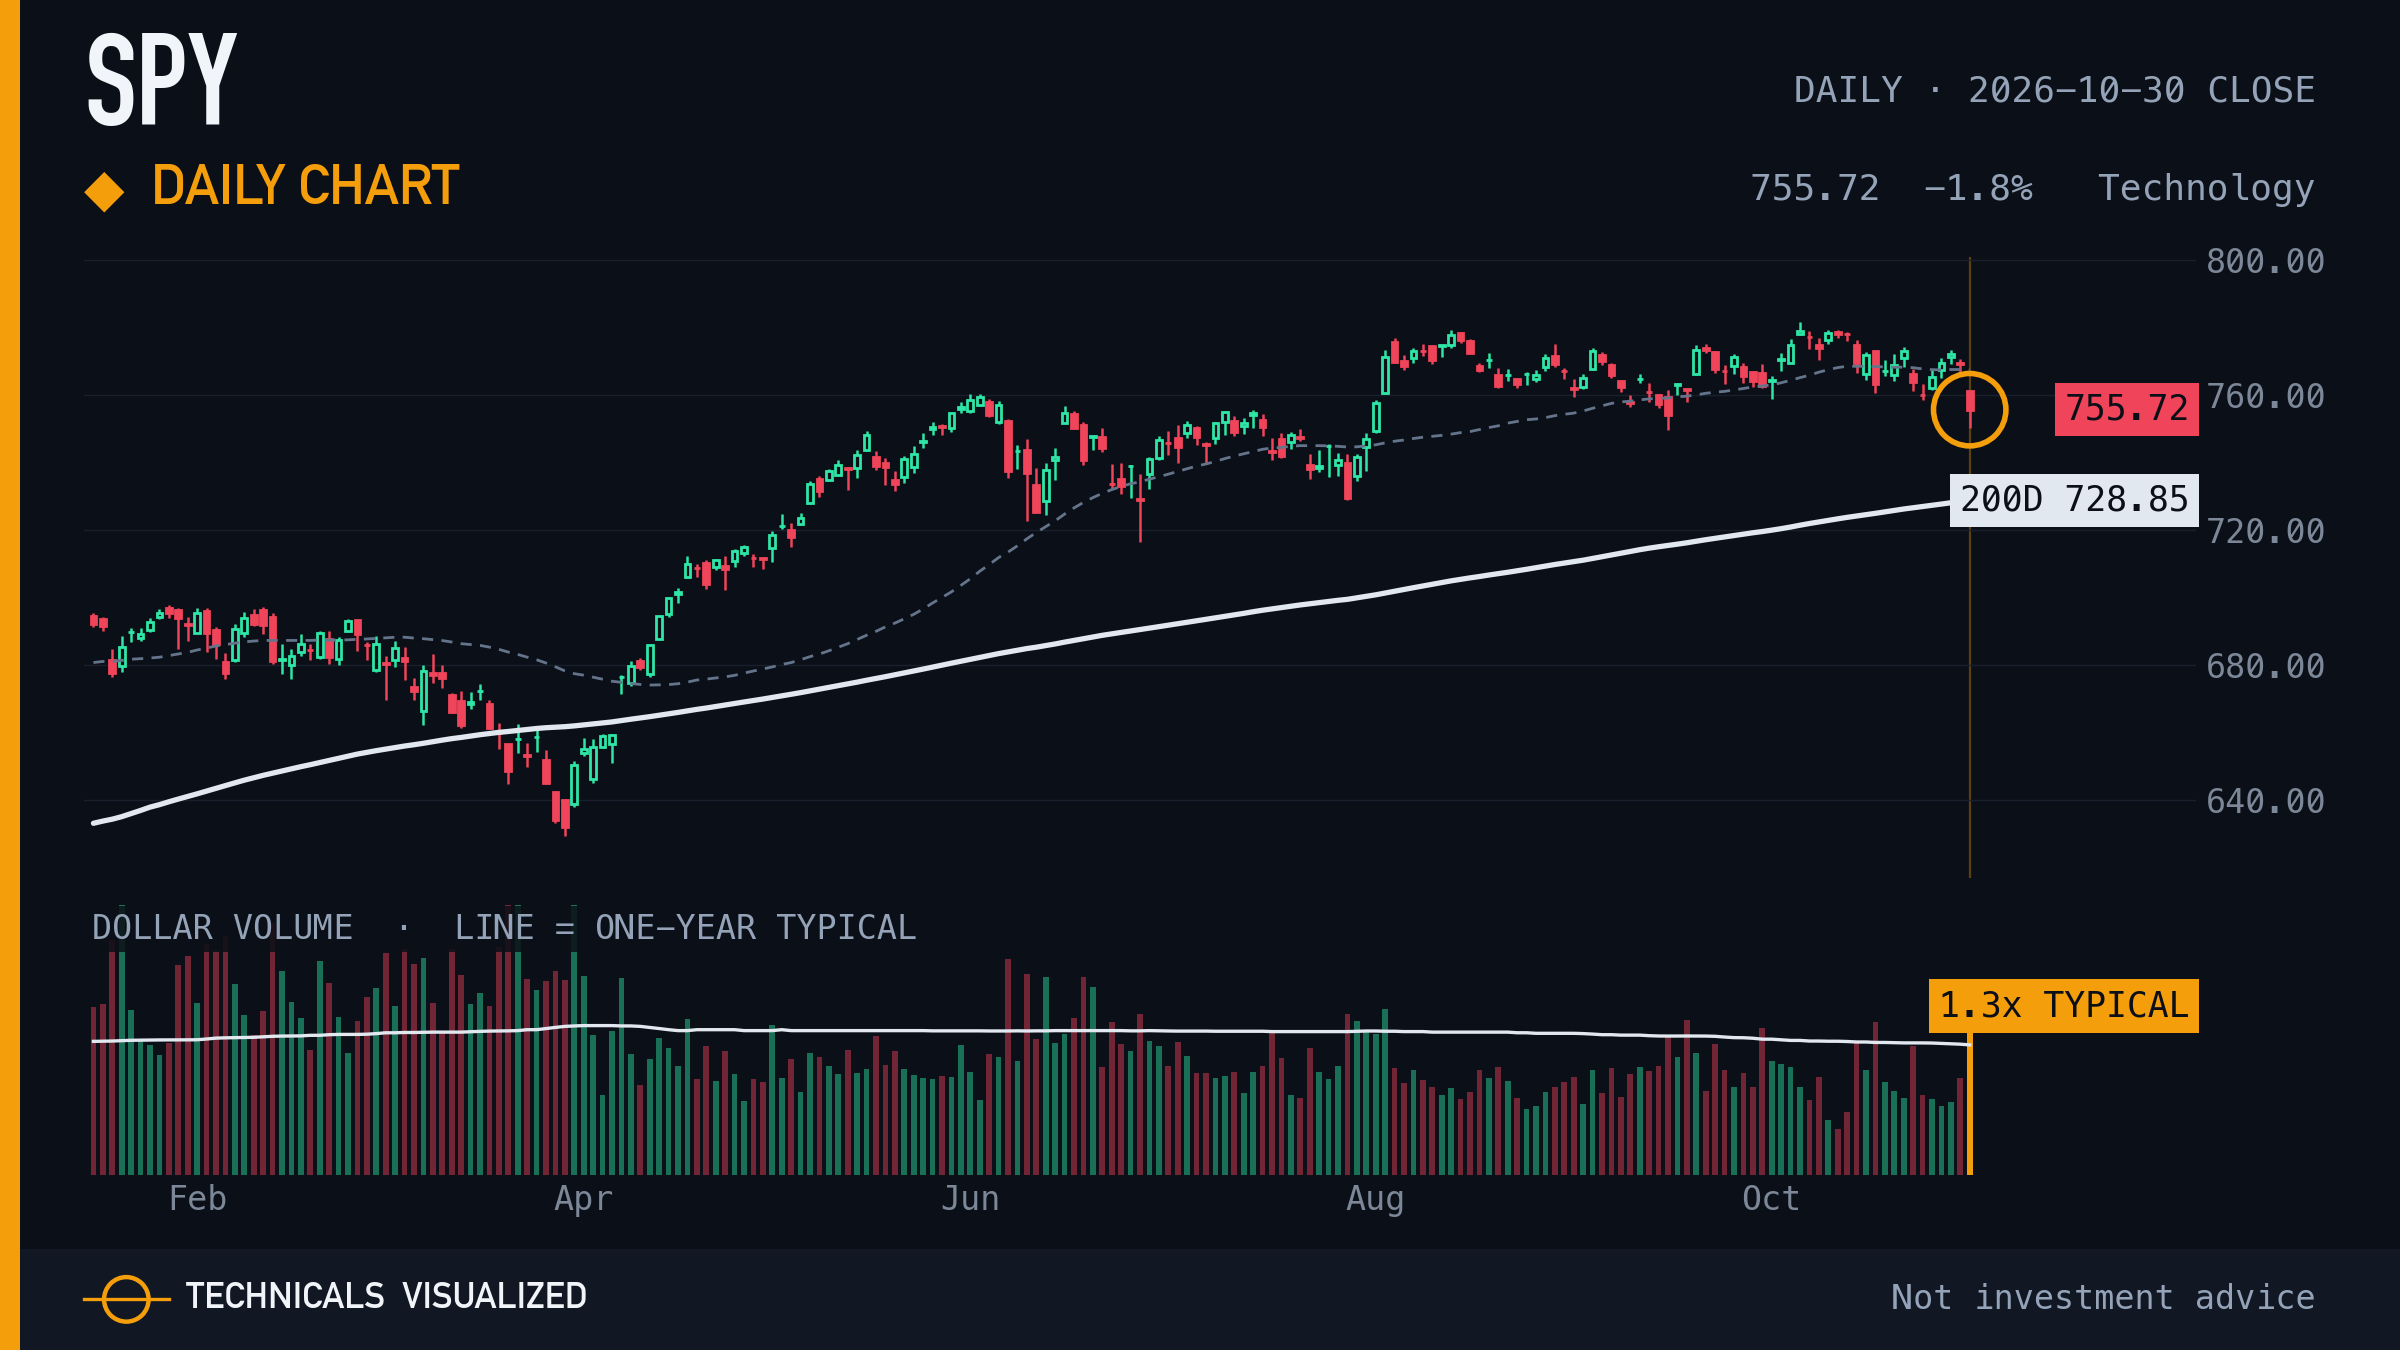
SPDR S&P 500 ETF closed at $755.72, -1.8% on the day, 3.7% above its 200-day average.
Shown in every edition, whether or not it printed a reading. The amber ring marks this close.
|
|
02 · Invesco QQQ Trust (QQQ) · Daily chart
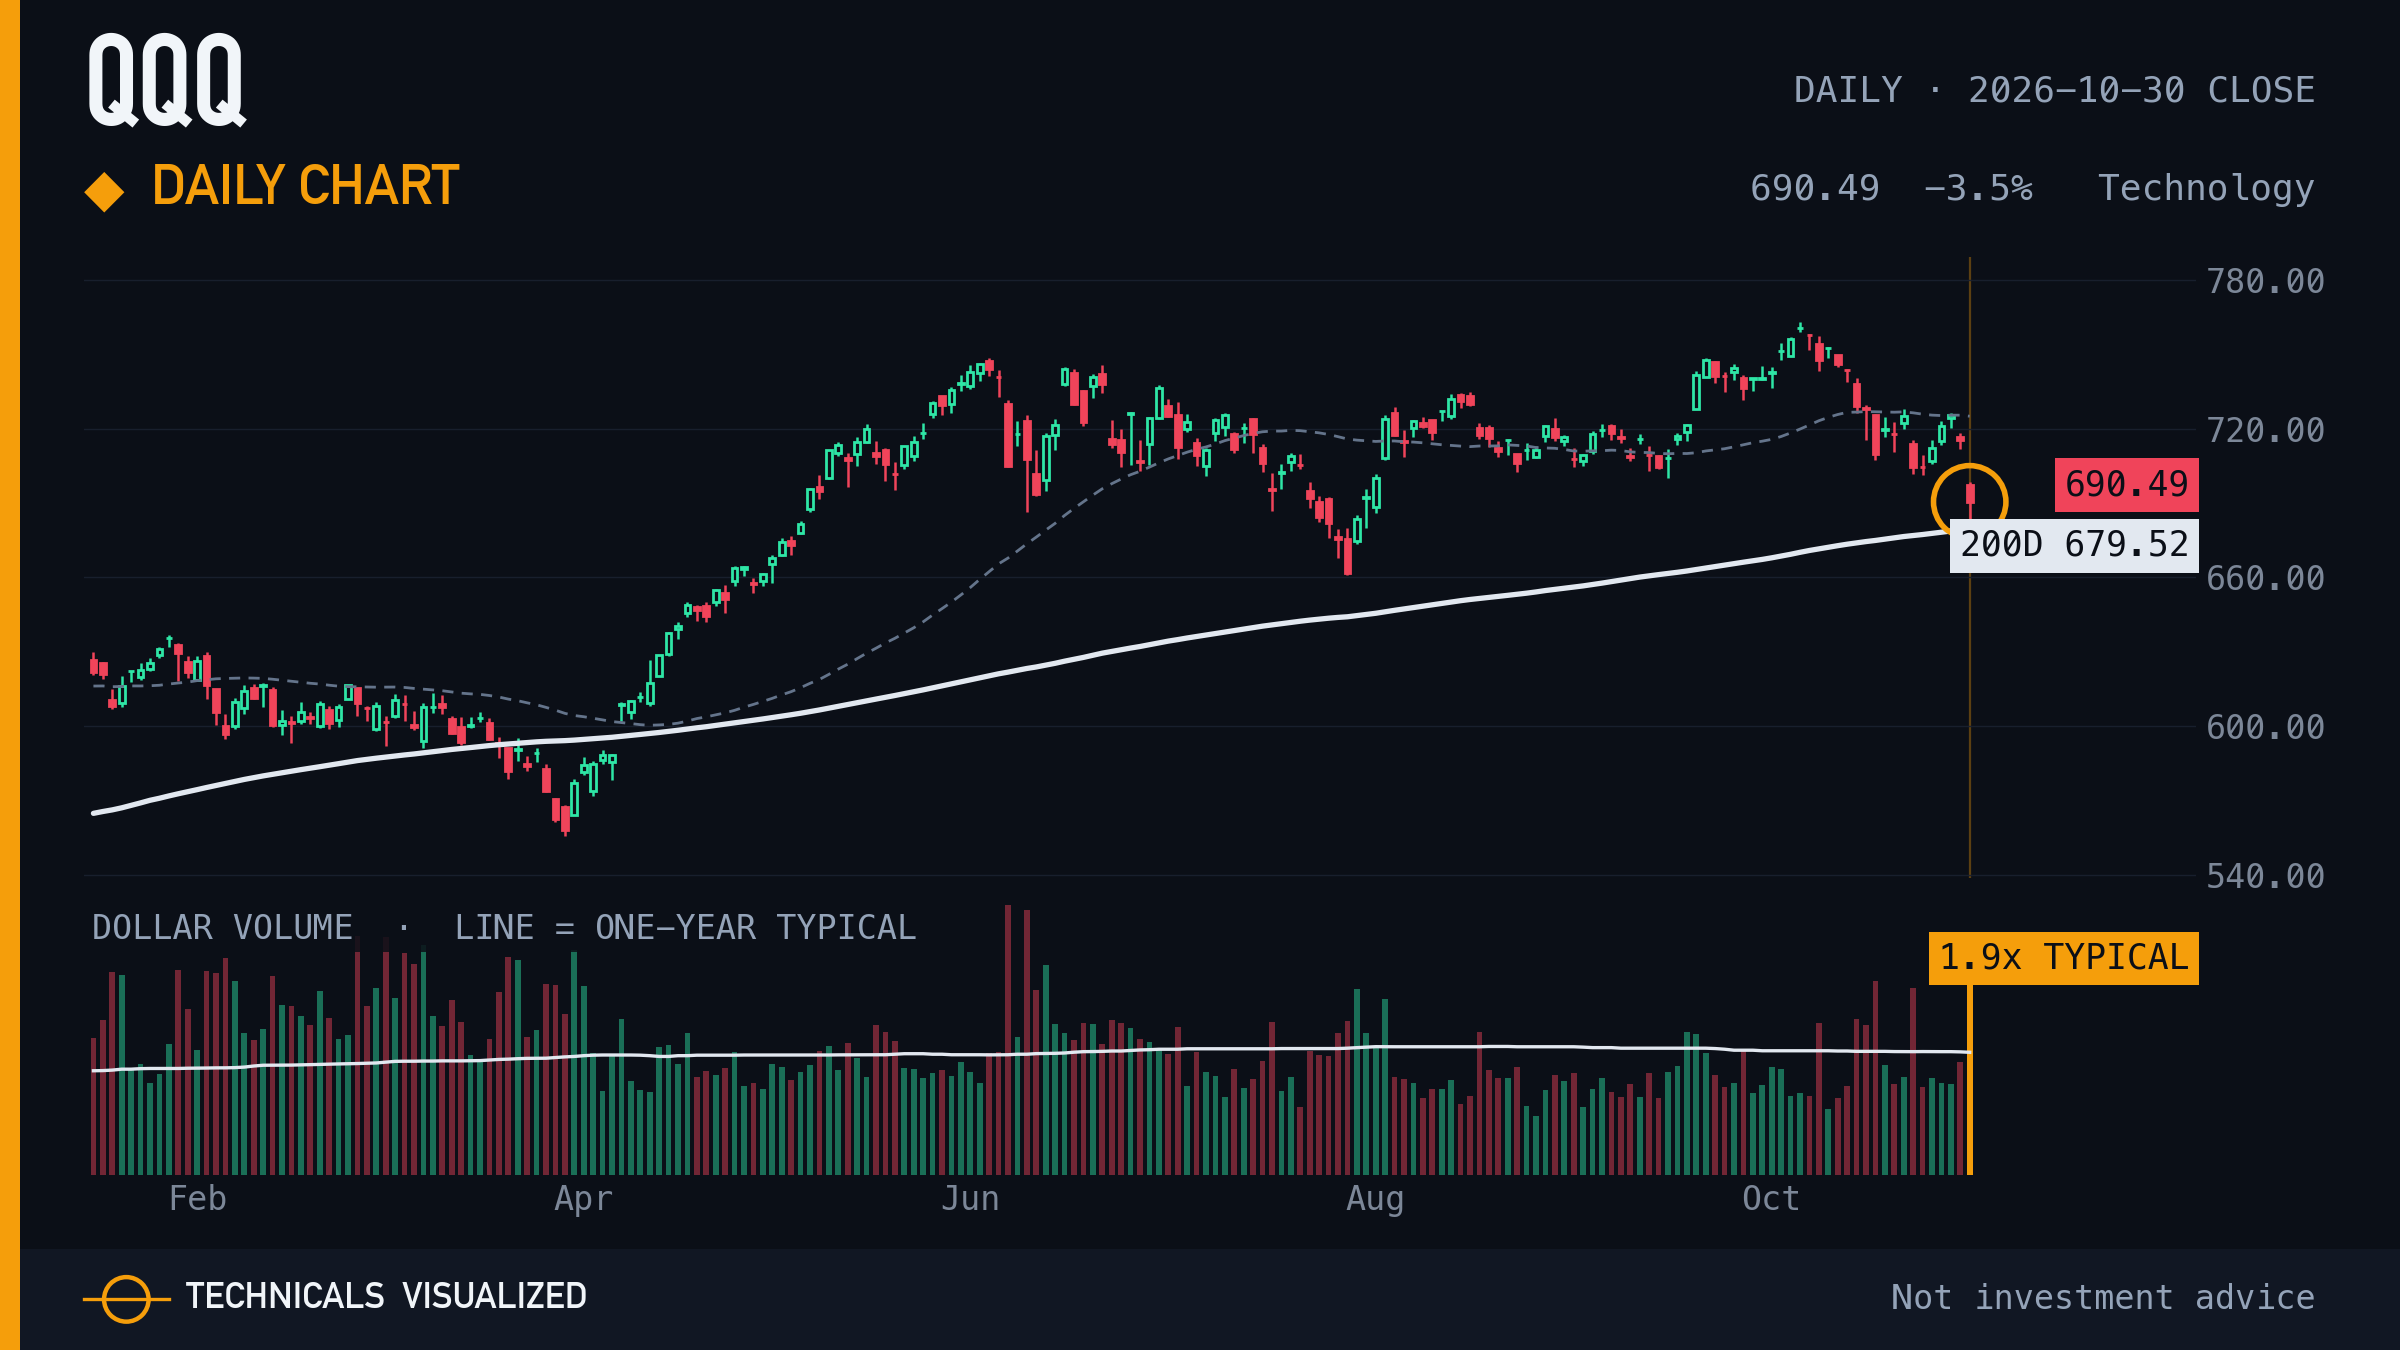
Invesco QQQ Trust closed at $690.49, -3.5% on the day, 1.6% above its 200-day average.
Shown in every edition, whether or not it printed a reading. The amber ring marks this close.
|
|
03 · iShares Russell 2000 ETF (IWM) · Daily chart
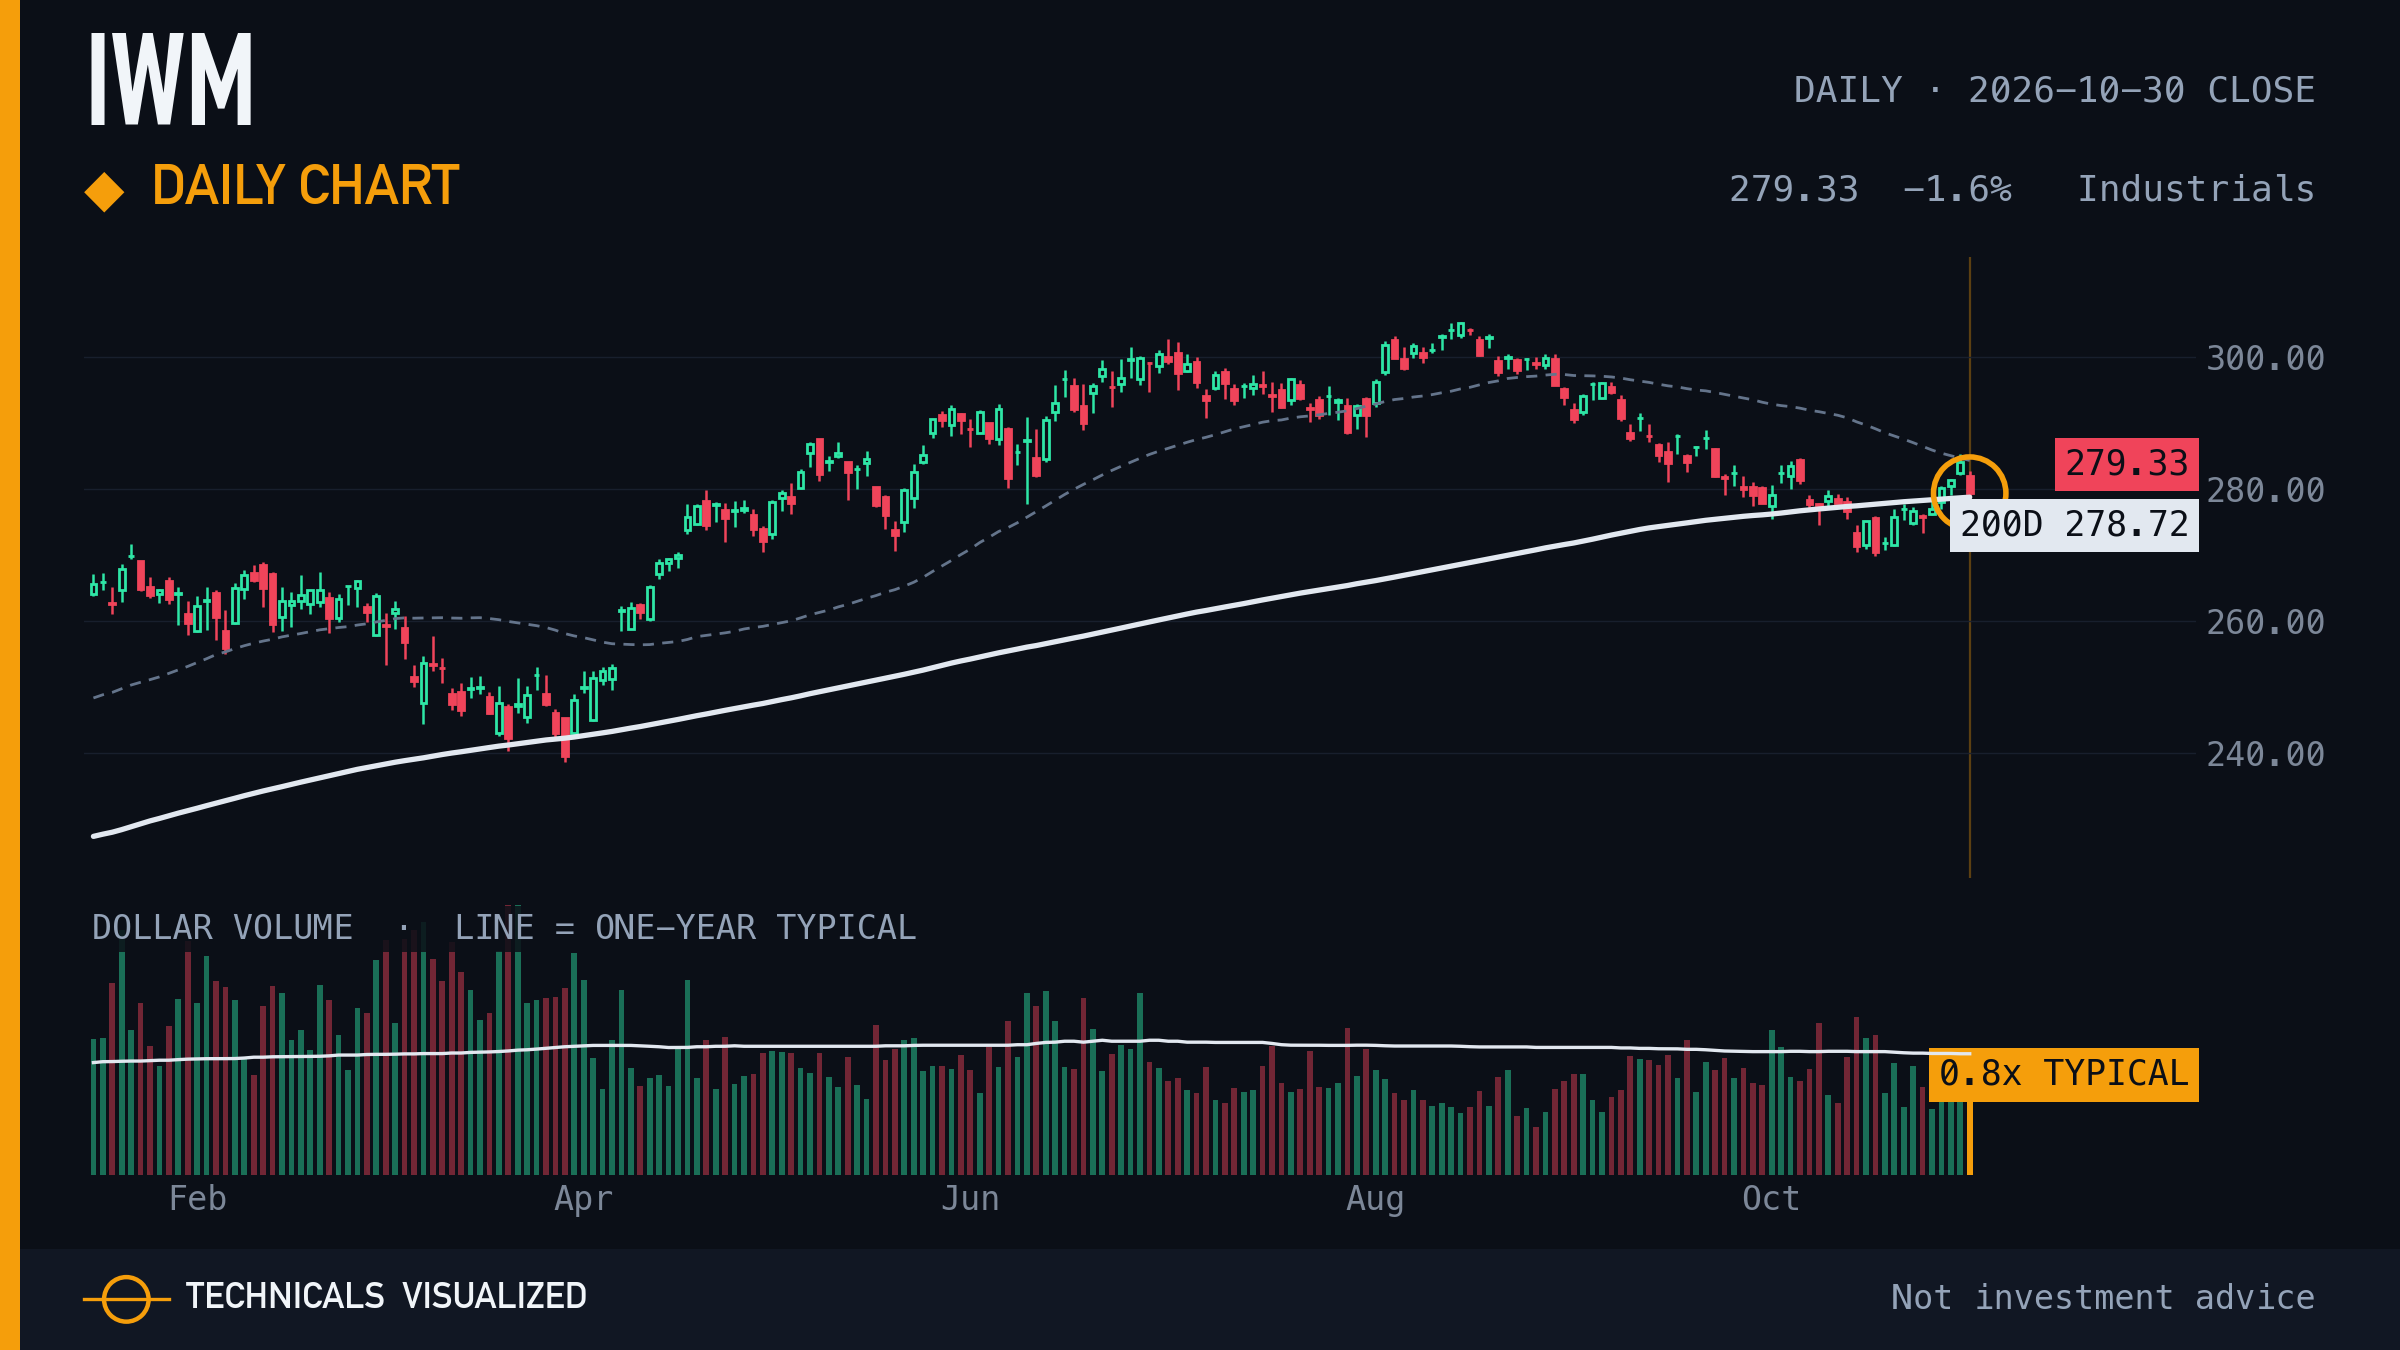
iShares Russell 2000 ETF closed at $279.33, -1.6% on the day, 0.2% above its 200-day average.
Shown in every edition, whether or not it printed a reading. The amber ring marks this close.
|
|
04 · iShares 20+ Year Treasury Bond ETF (TLT) · Daily chart
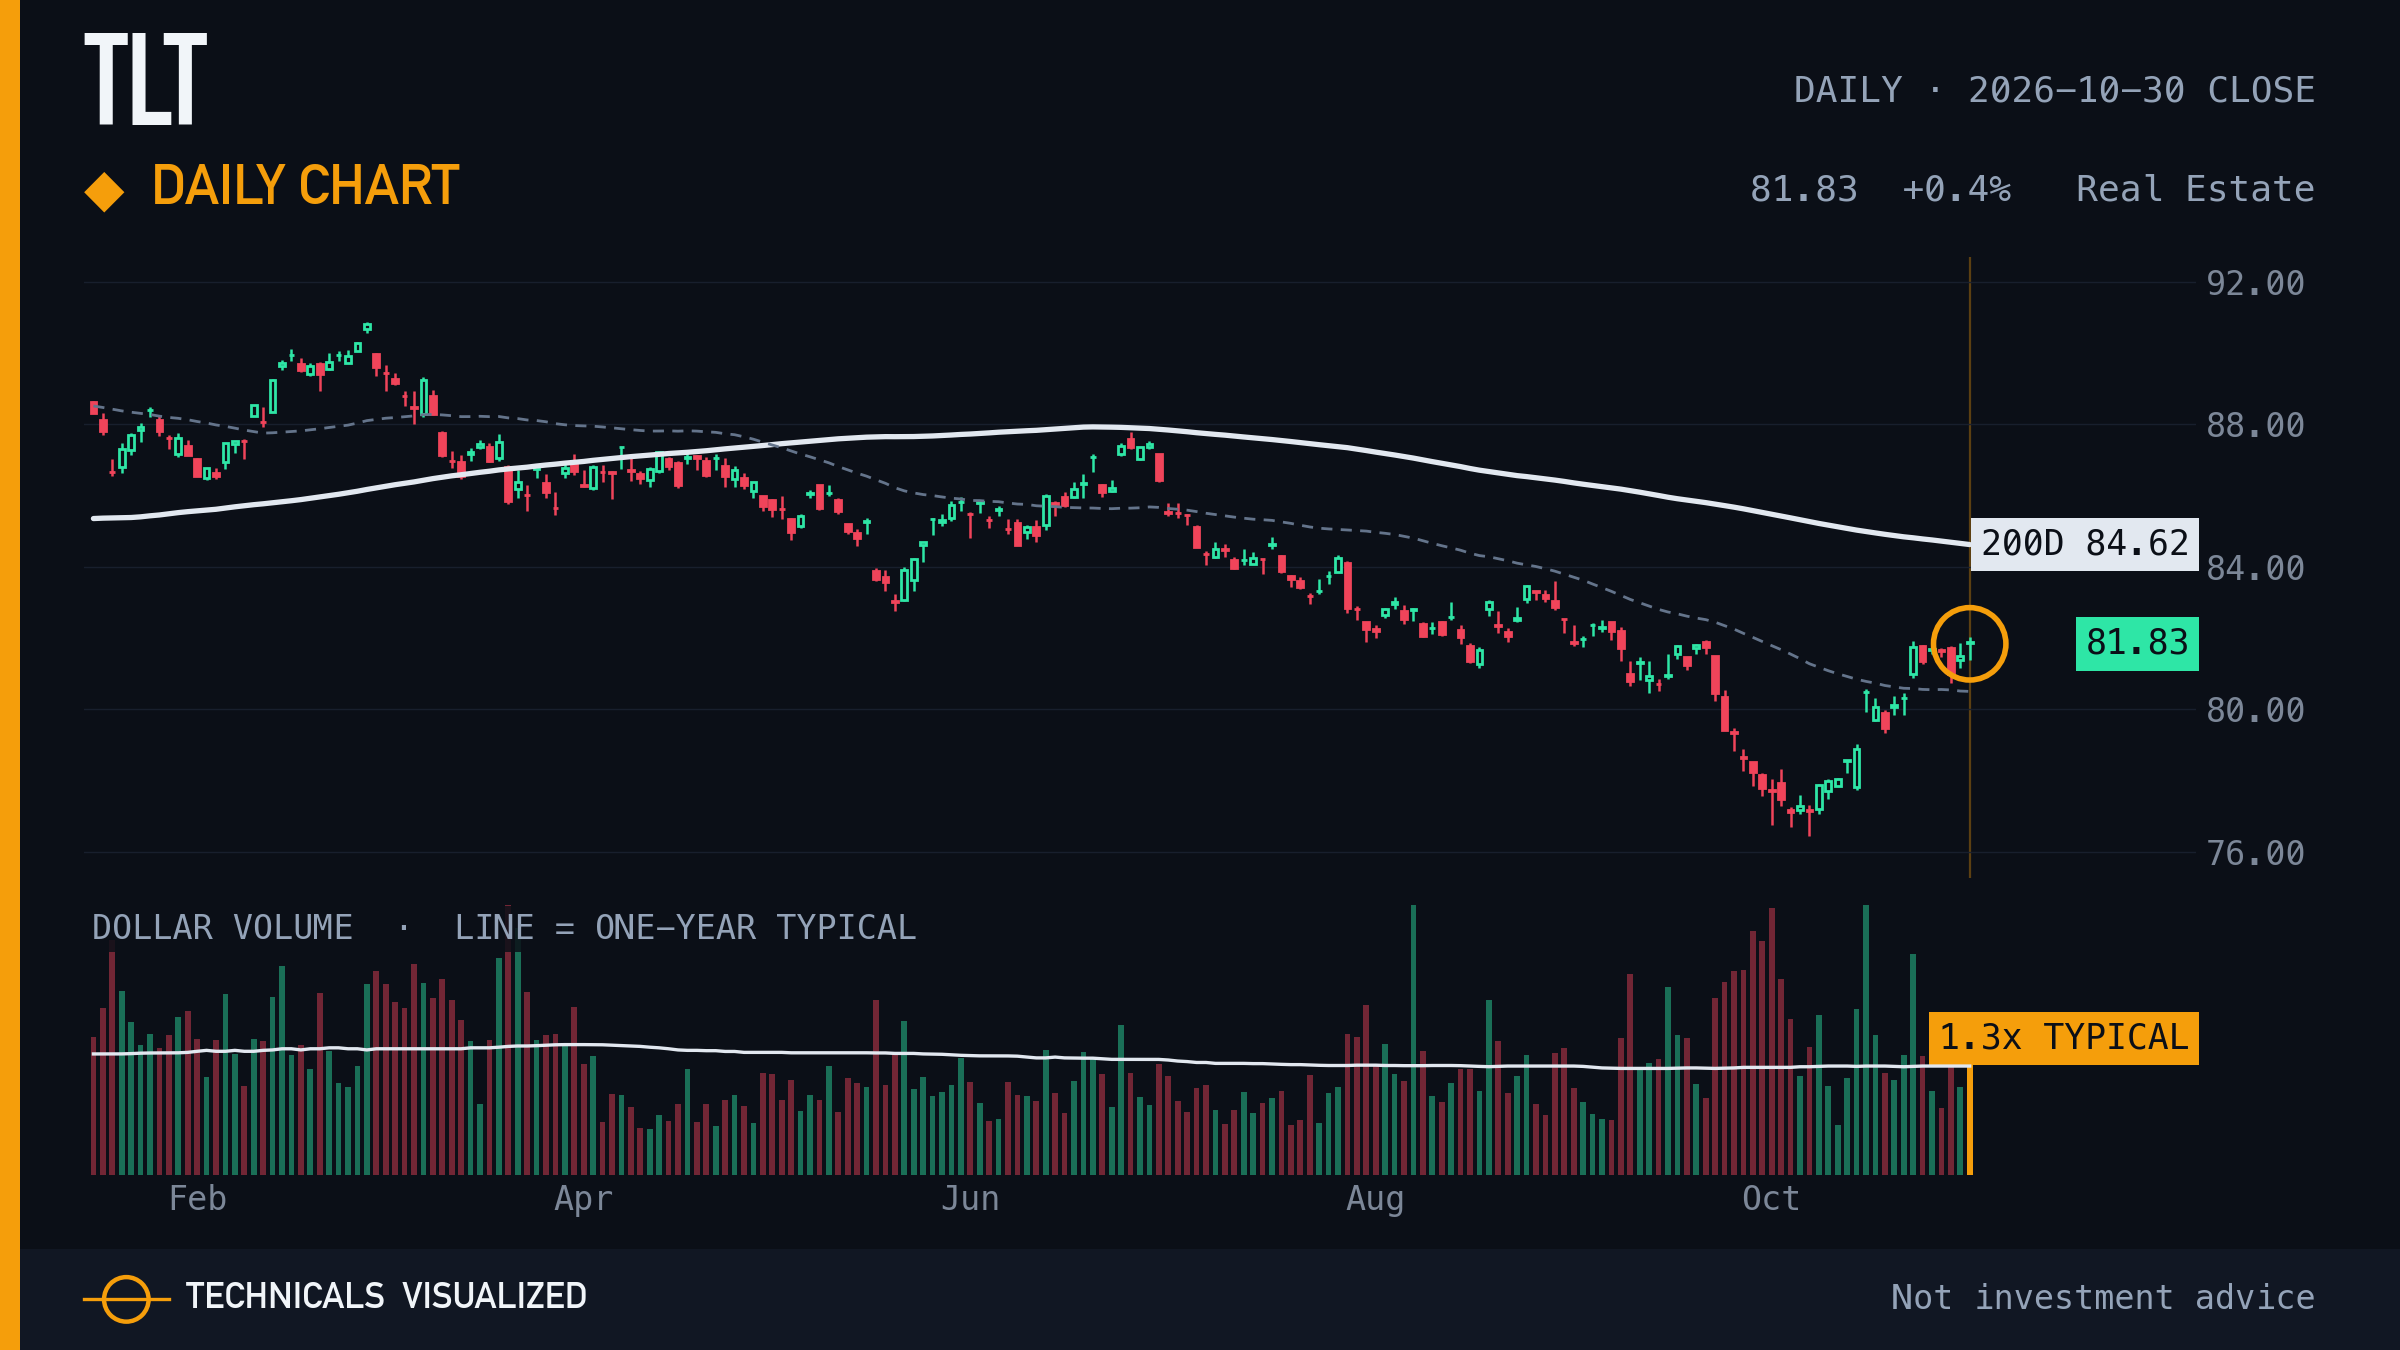
iShares 20+ Year Treasury Bond ETF closed at $81.83, +0.4% on the day, 3.3% below its 200-day average.
Shown in every edition, whether or not it printed a reading. The amber ring marks this close.
|
|
05 · United States Oil Fund (USO) · Daily chart
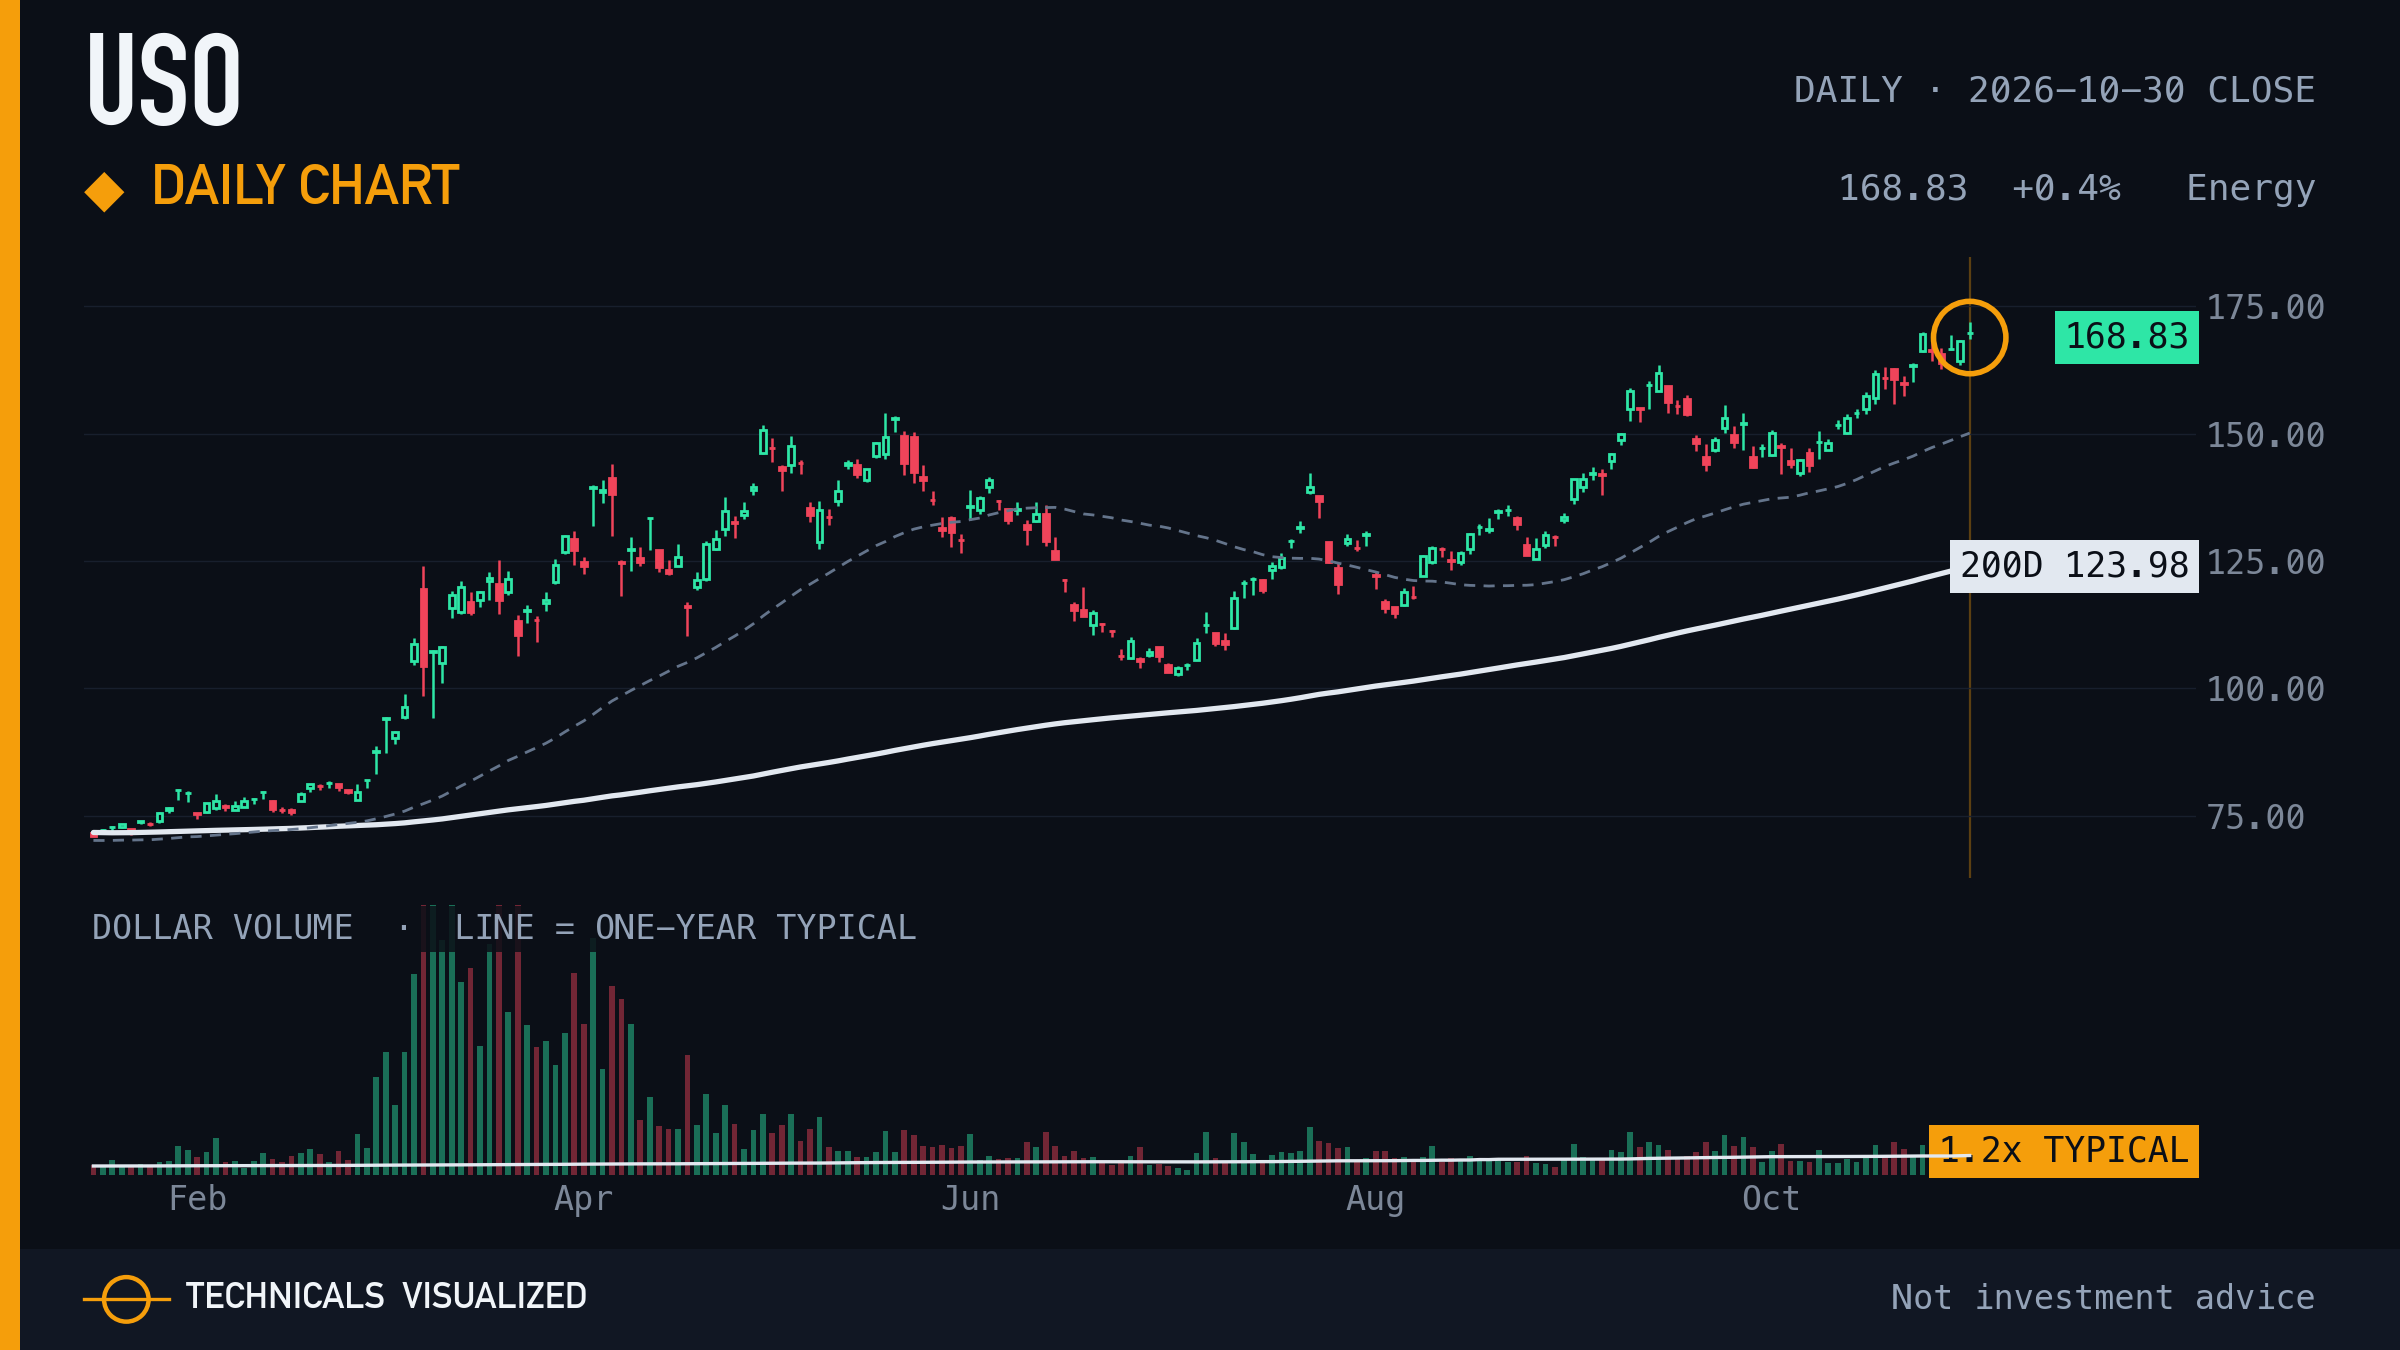
United States Oil Fund closed at $168.83, +0.4% on the day, 36.2% above its 200-day average.
Shown in every edition, whether or not it printed a reading. The amber ring marks this close.
|
Weekly structureThe latest confirmed weekly swing high and swing low, and where the week closed against them. 24 of 541 stocks and ETFs closed the week within a tenth of a weekly range of a swing level; the 2 most traded are shown. |
|
06 · SPDR S&P 500 ETF (SPY) · Weekly close between swing levels
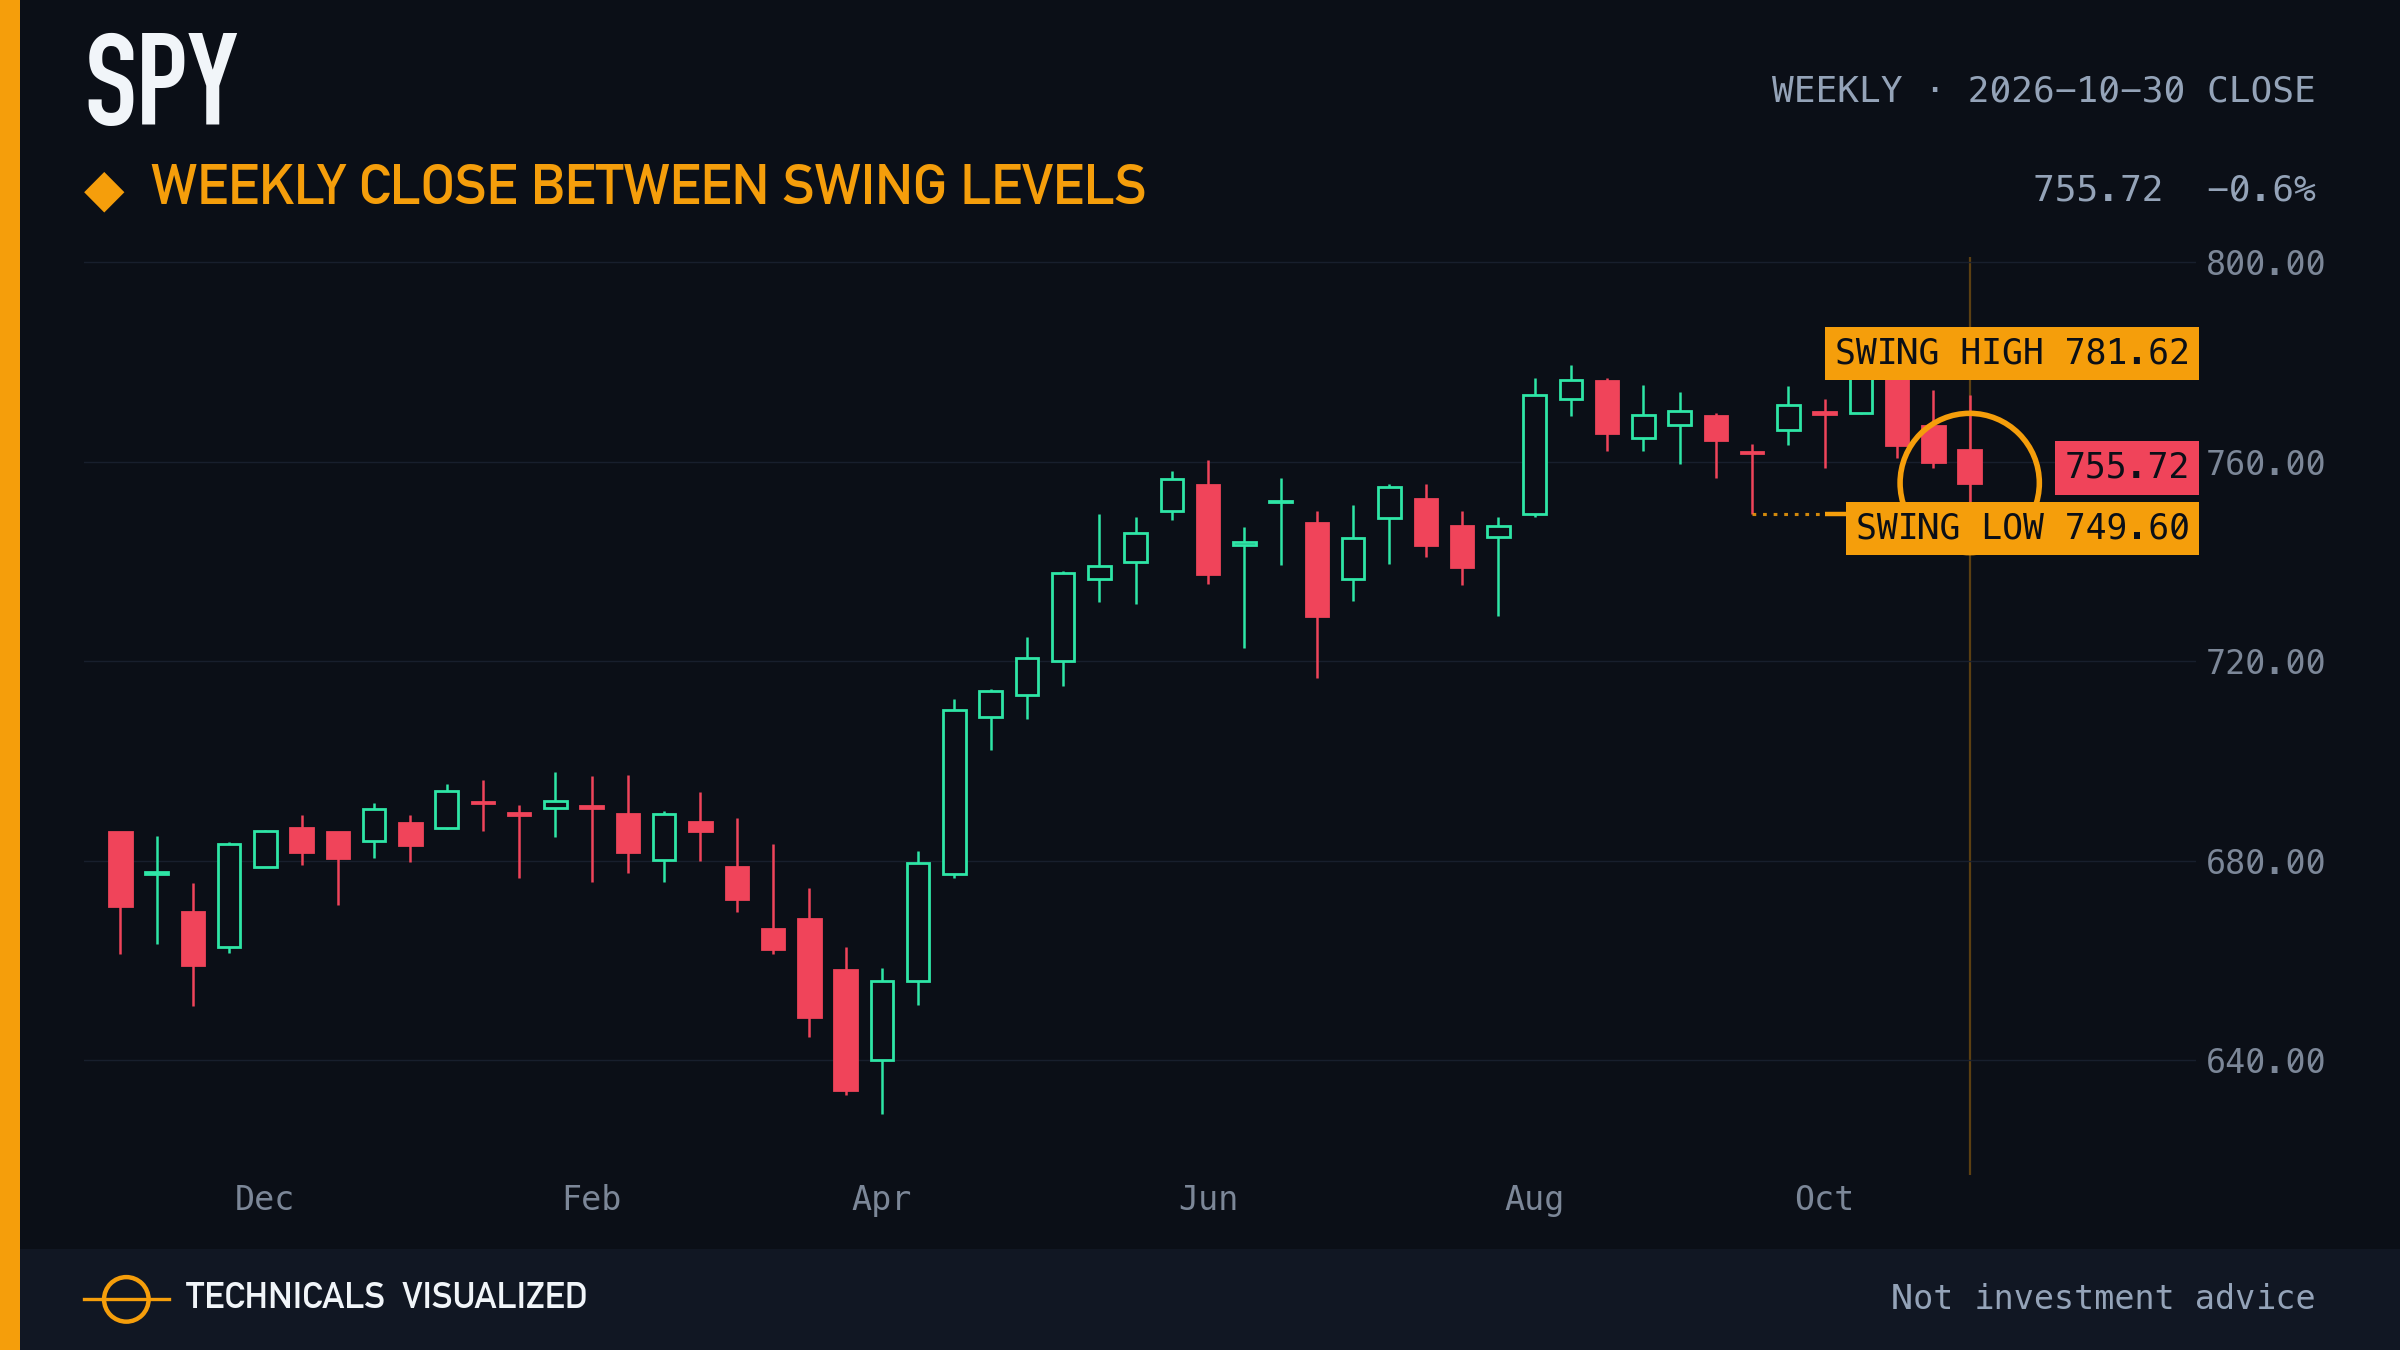
SPDR S&P 500 ETF closed the week ending Oct 30, 2026 at $755.72: 3.3% below its weekly swing high of $781.62 (week of Oct 9) and 0.8% above its weekly swing low of $749.60 (week of Sep 18).
Weekly swing lows have risen 3 times in a row since the $629.28 low in the week of Apr 3. The last weekly close above the swing high standing at the time was the week of Aug 21. The last weekly close below the swing low standing at the time was the week of Apr 3. Each line starts the week its swing was confirmed, two weeks after the swing.
|
|
07 · Apple (AAPL) · Weekly close between swing levels
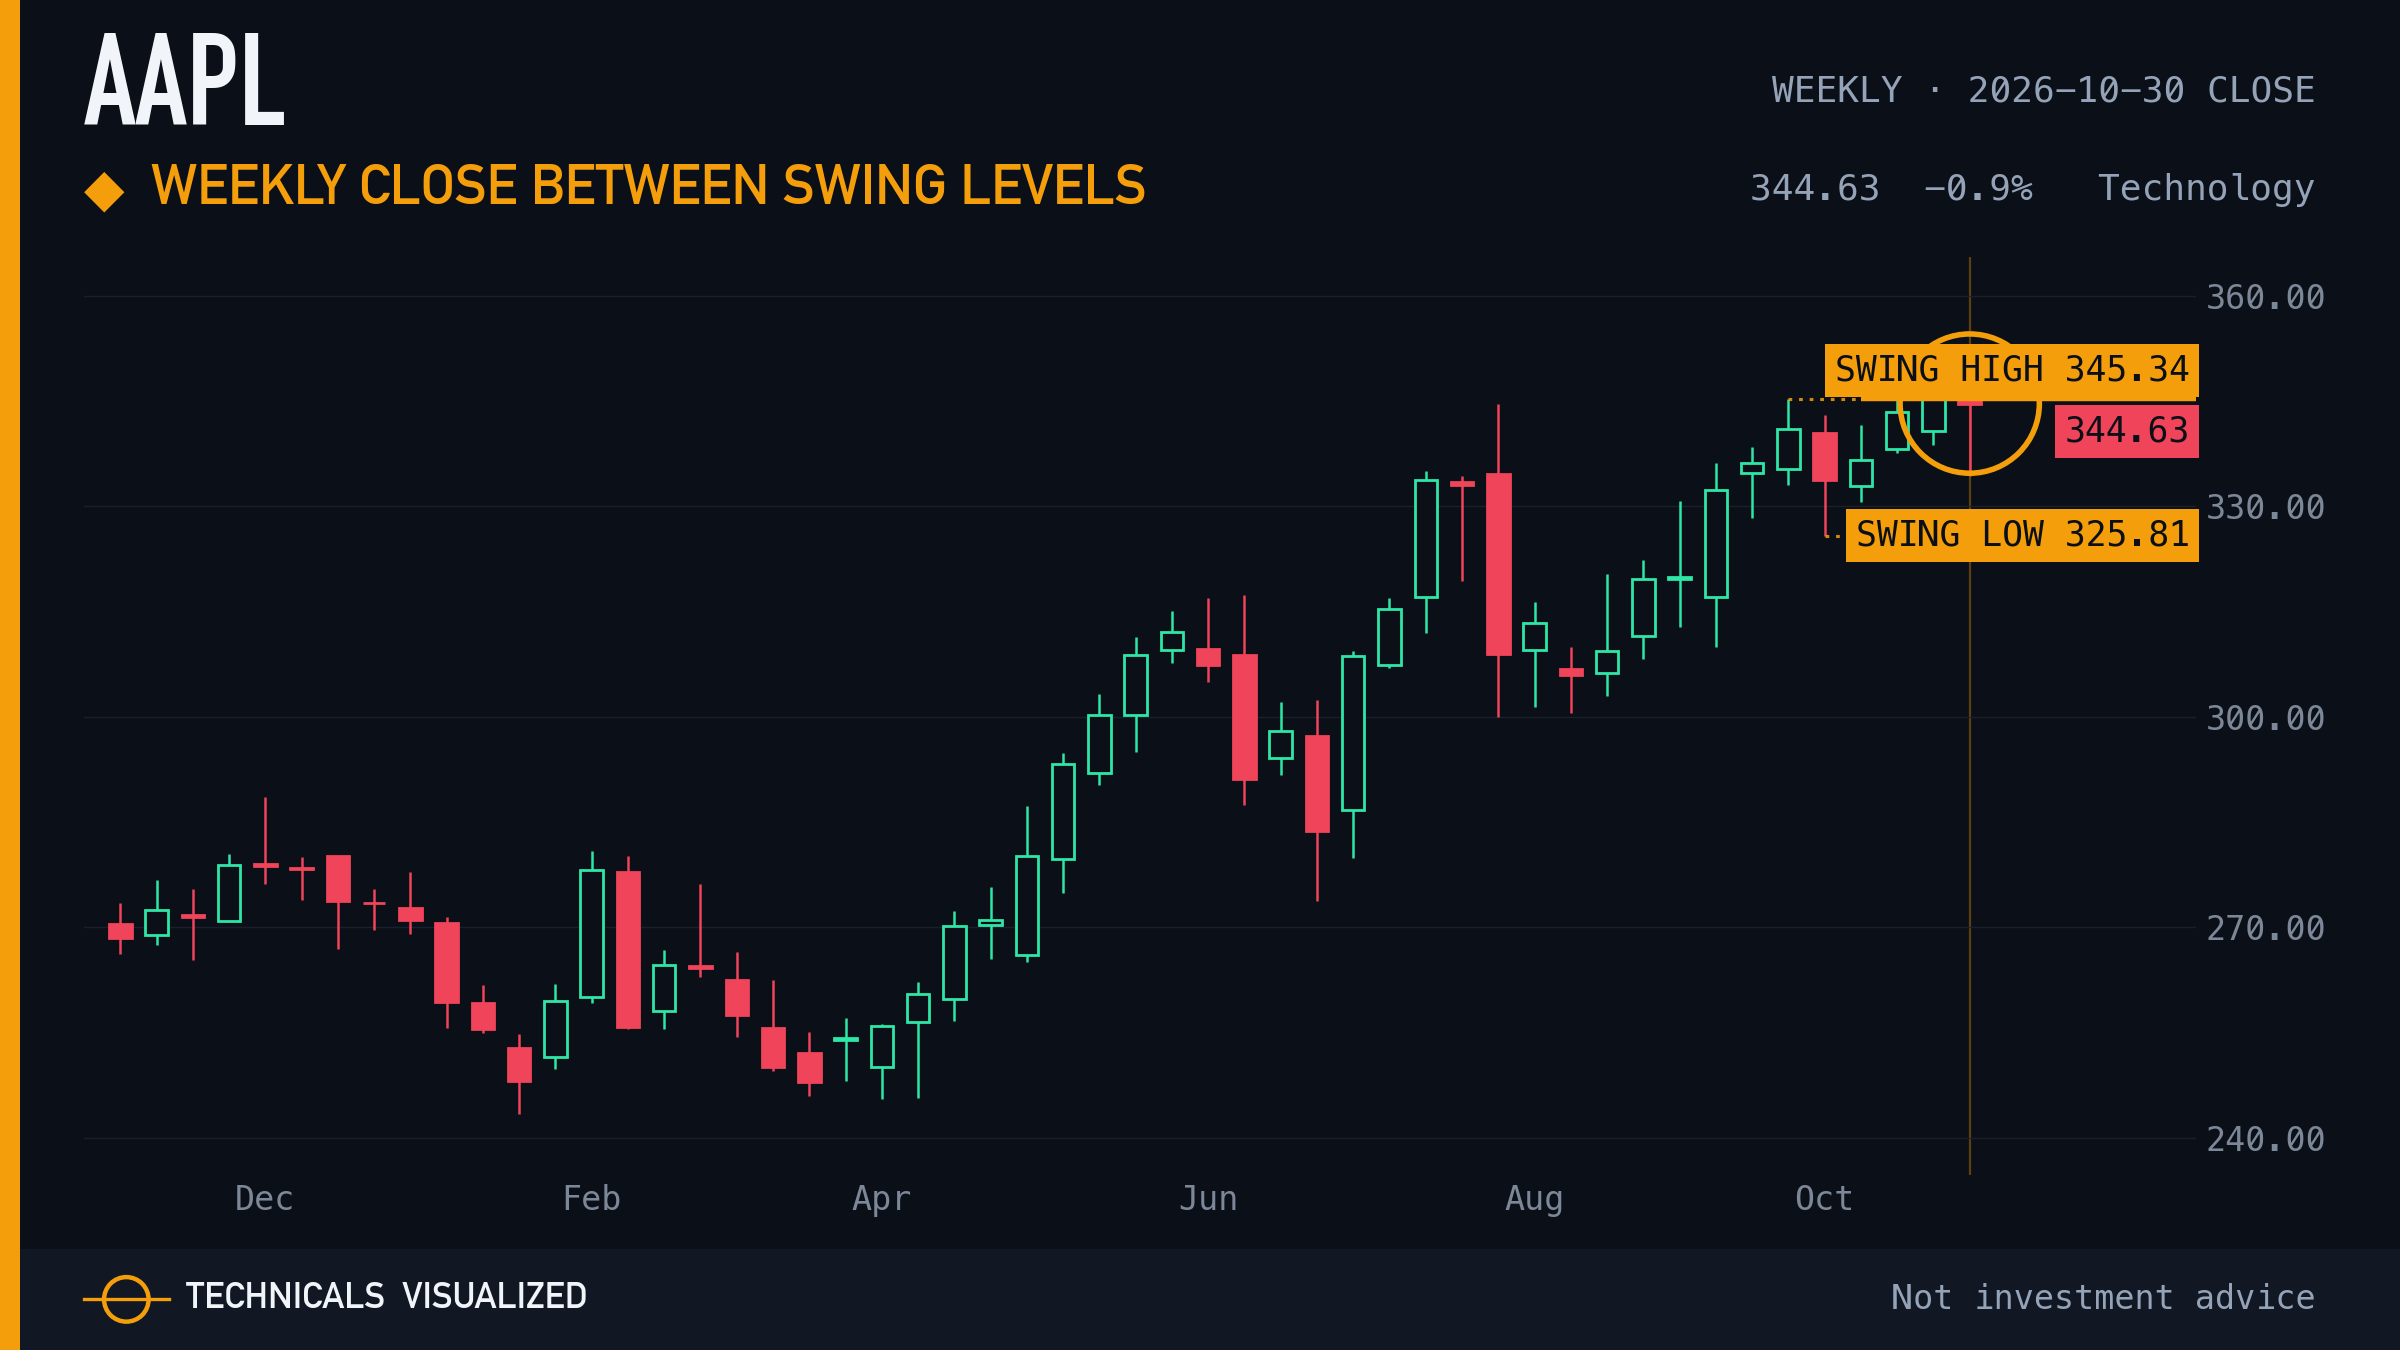
Apple closed the week ending Oct 30, 2026 at $344.63: 0.2% below its weekly swing high of $345.34 (week of Sep 25) and 5.8% above its weekly swing low of $325.81 (week of Oct 2).
Weekly swing lows have risen 4 times in a row since the $243.42 low in the week of Jan 23. The last weekly close above this swing high was the week of Oct 23. The last weekly close below the swing low standing at the time was the week of Jan 30. Each line starts the week its swing was confirmed, two weeks after the swing.
|
|
08 · Dell Technologies (DELL) · Weekly close between swing levels
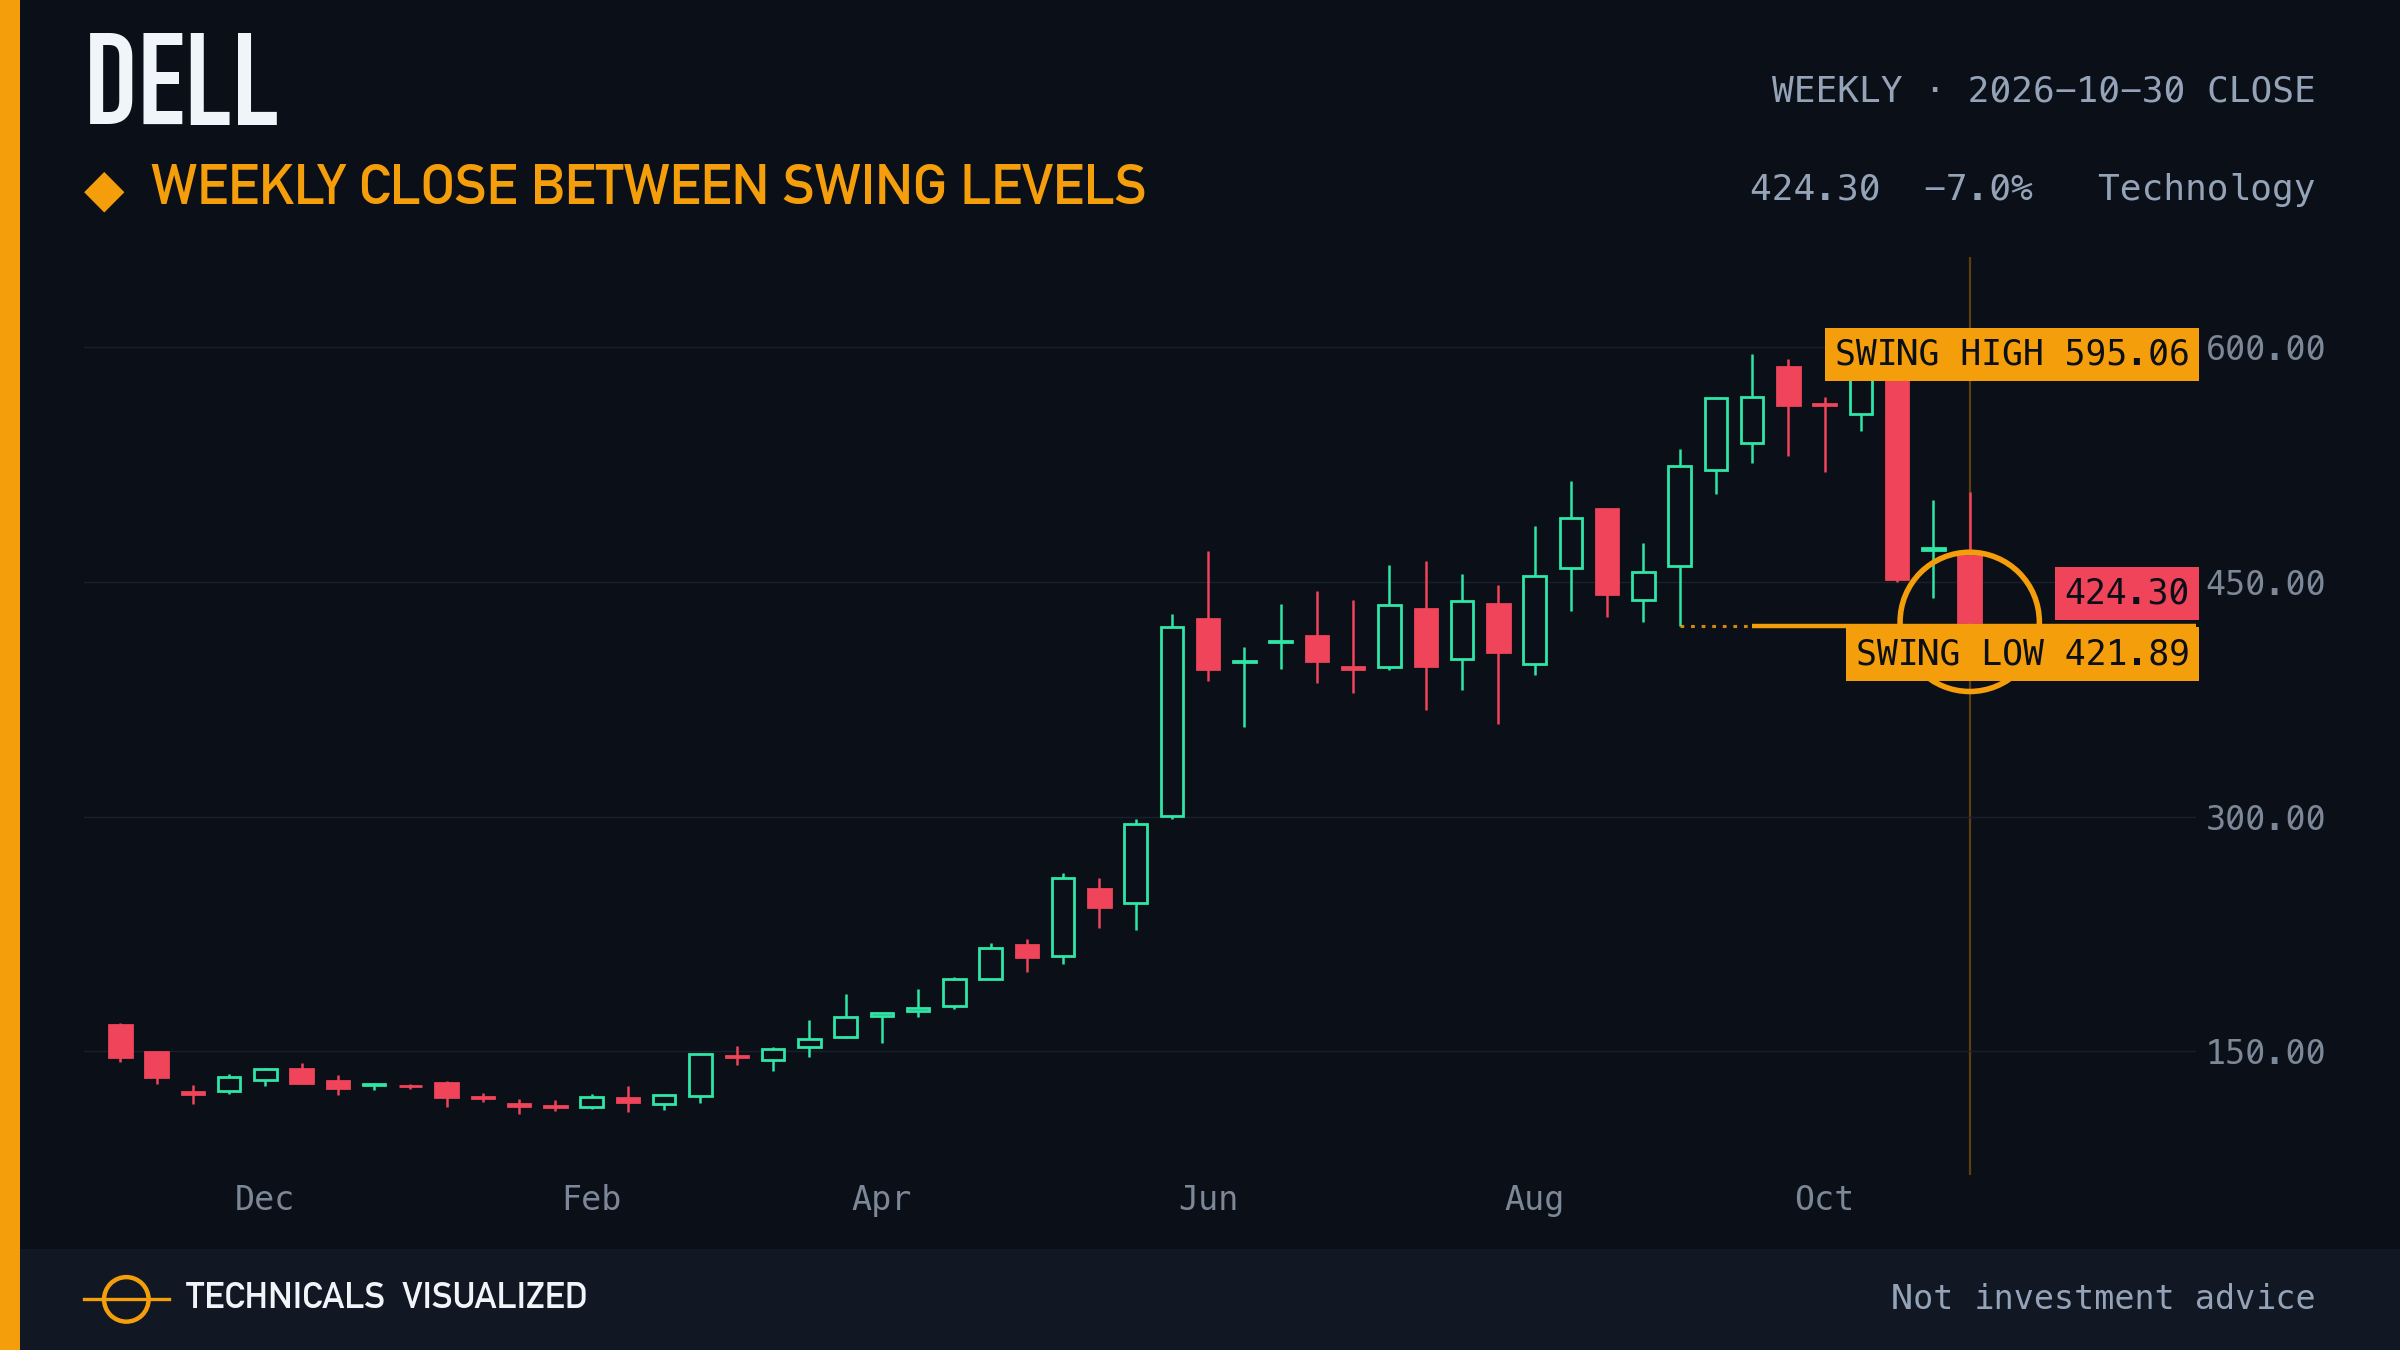
Dell Technologies closed the week ending Oct 30, 2026 at $424.30: 28.7% below its weekly swing high of $595.06 (week of Oct 9) and 0.6% above its weekly swing low of $421.89 (week of Sep 4).
Weekly swing lows have risen 3 times in a row since the $110.22 low in the week of Jan 23. The last weekly close above the swing high standing at the time was the week of Sep 25. The last weekly close below the swing low standing at the time was the week of Jan 30. Each line starts the week its swing was confirmed, two weeks after the swing.
|
Today's readings |
|
09 · Intel (INTC) · Outsized session
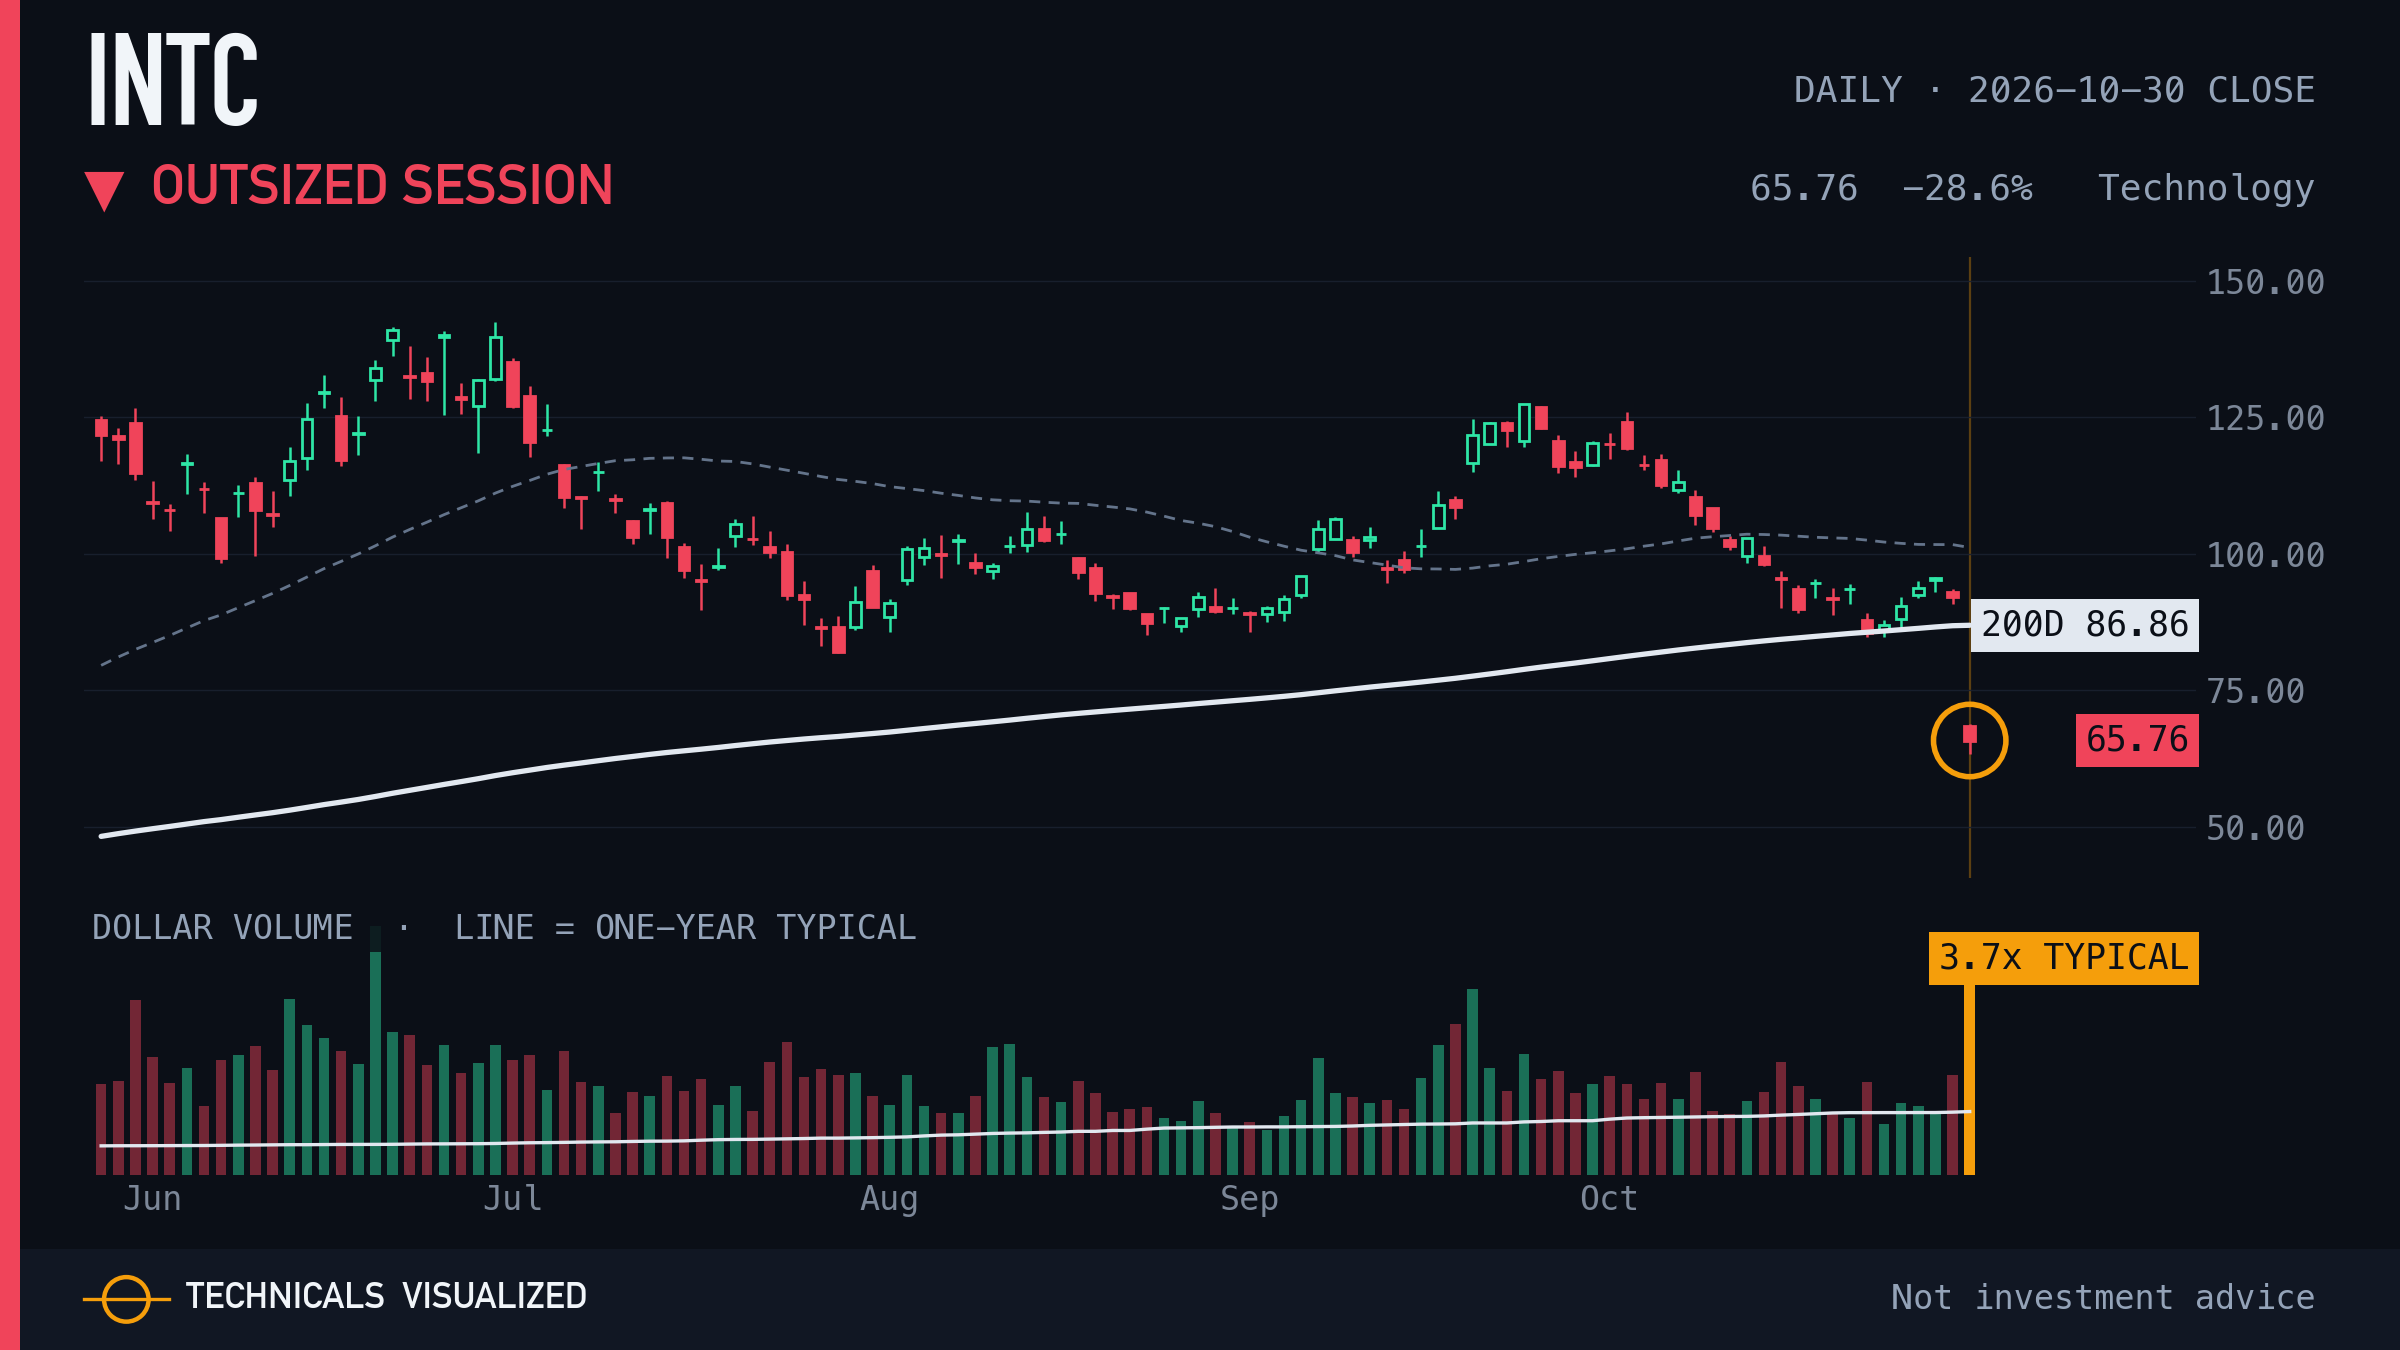
Intel moved -28.6% in one session, 8.8 times its usual daily move.
One session, measured against this chart's own usual move. It describes the day, not the next one.
|
|
10 · Reddit (RDDT) · Outsized session
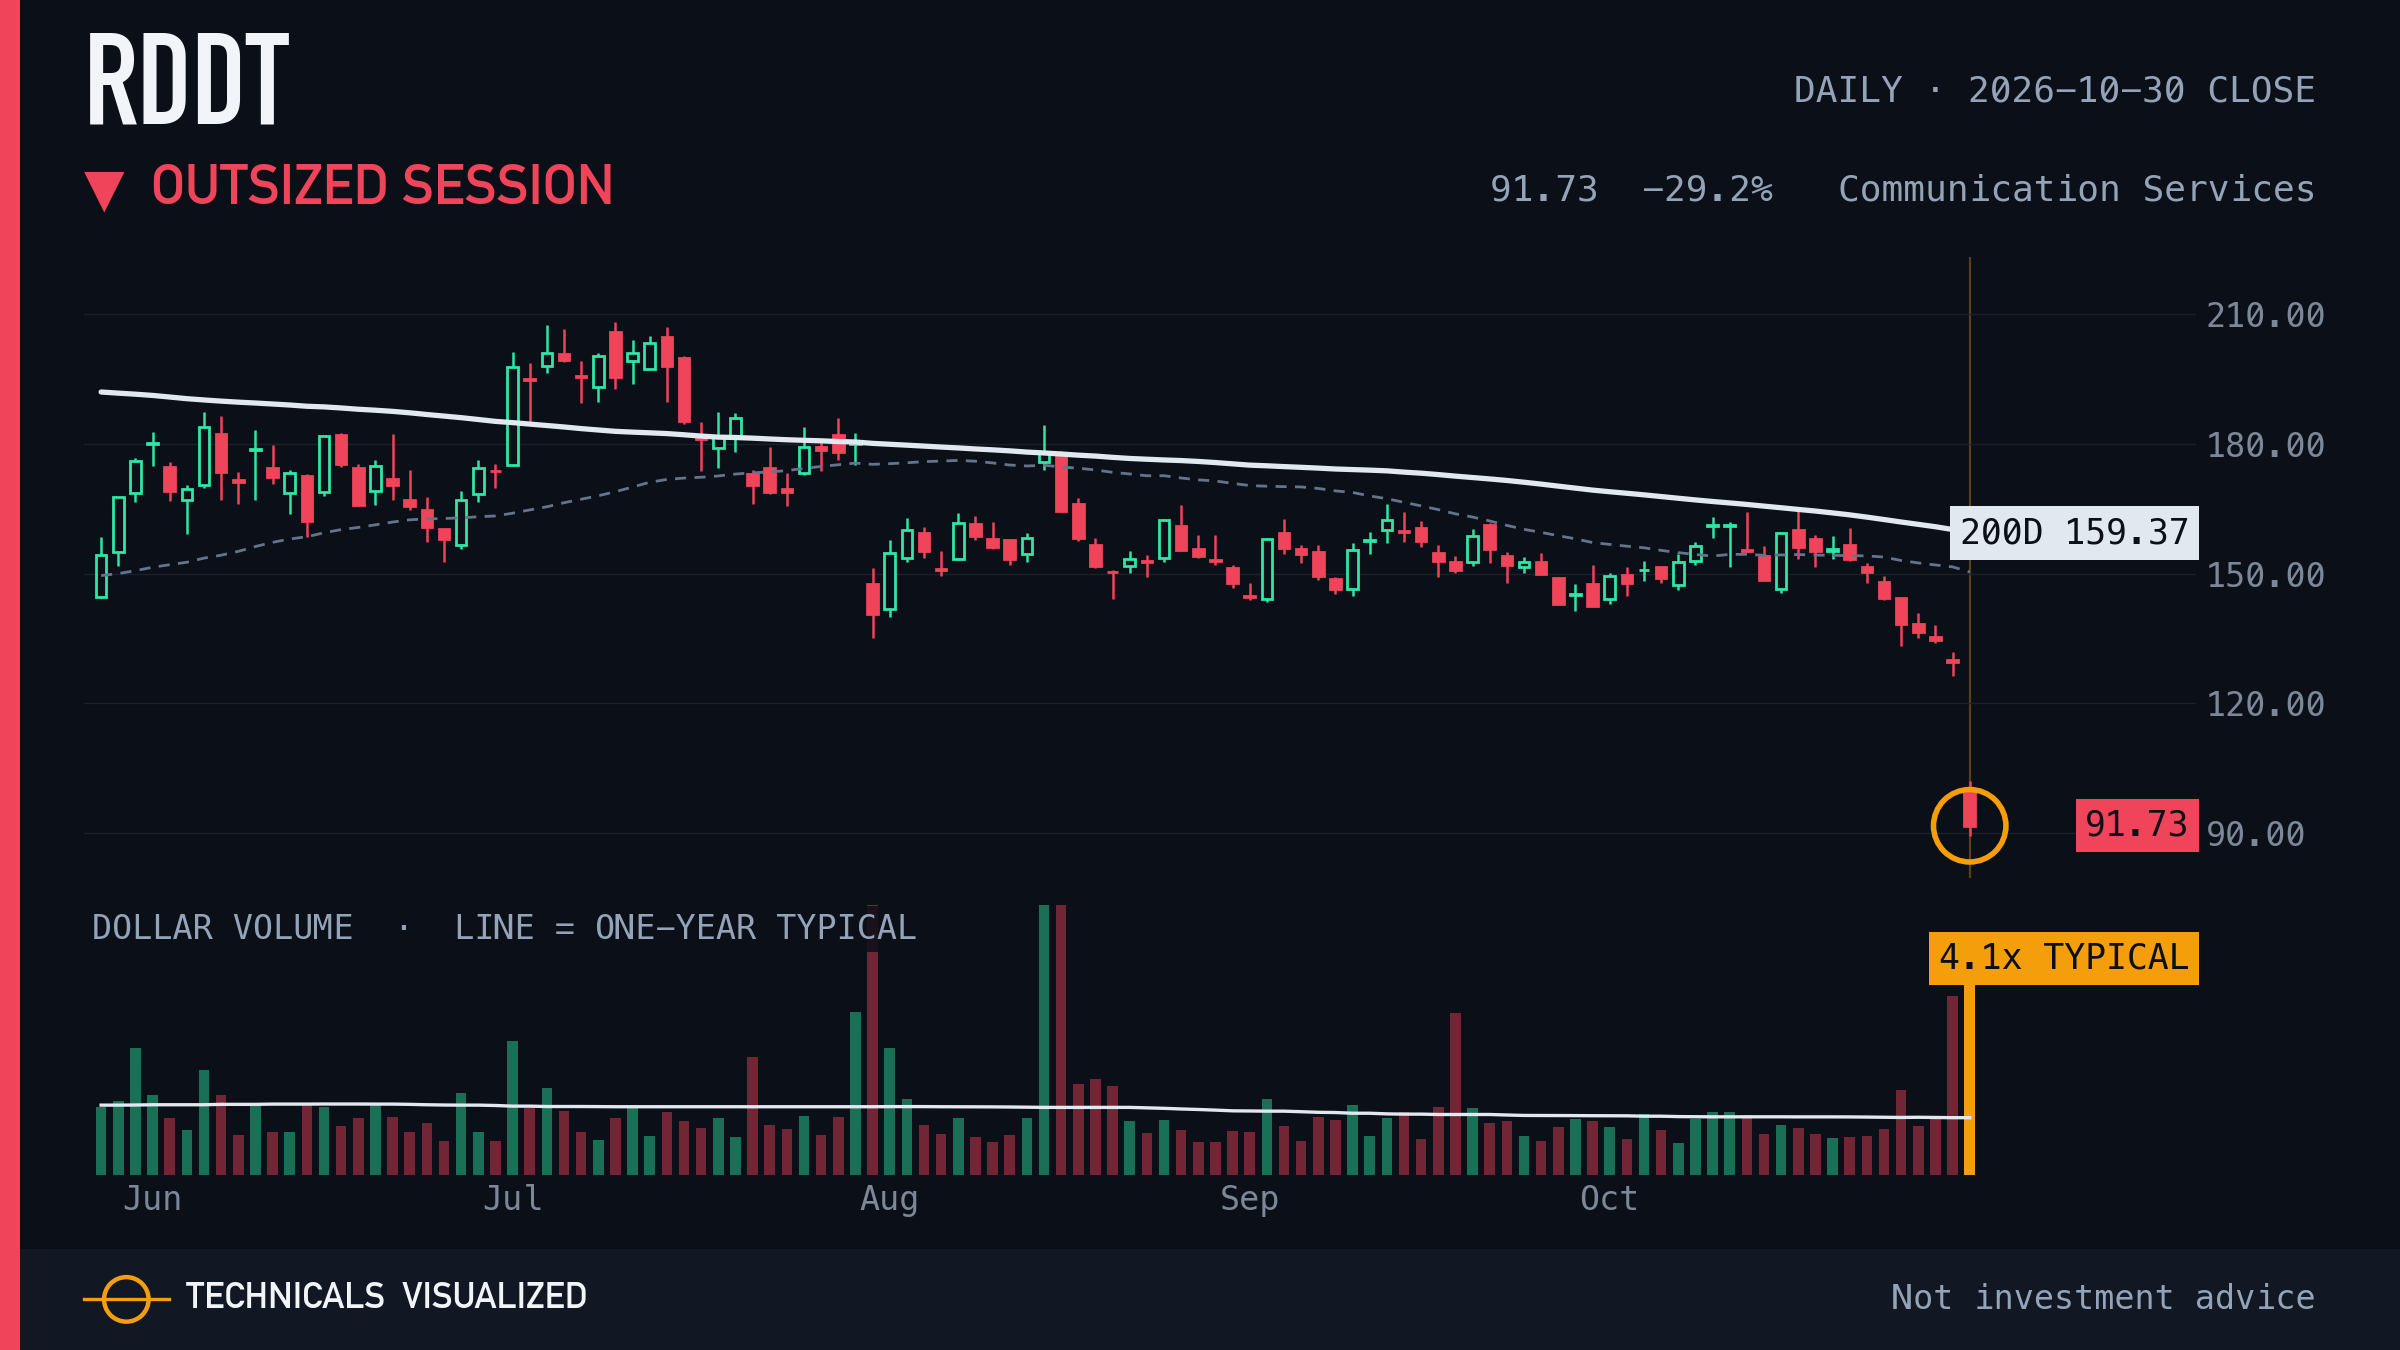
Reddit moved -29.2% in one session, 9.4 times its usual daily move.
One session, measured against this chart's own usual move. It describes the day, not the next one.
|
|
11 · Qualcomm (QCOM) · Outsized session
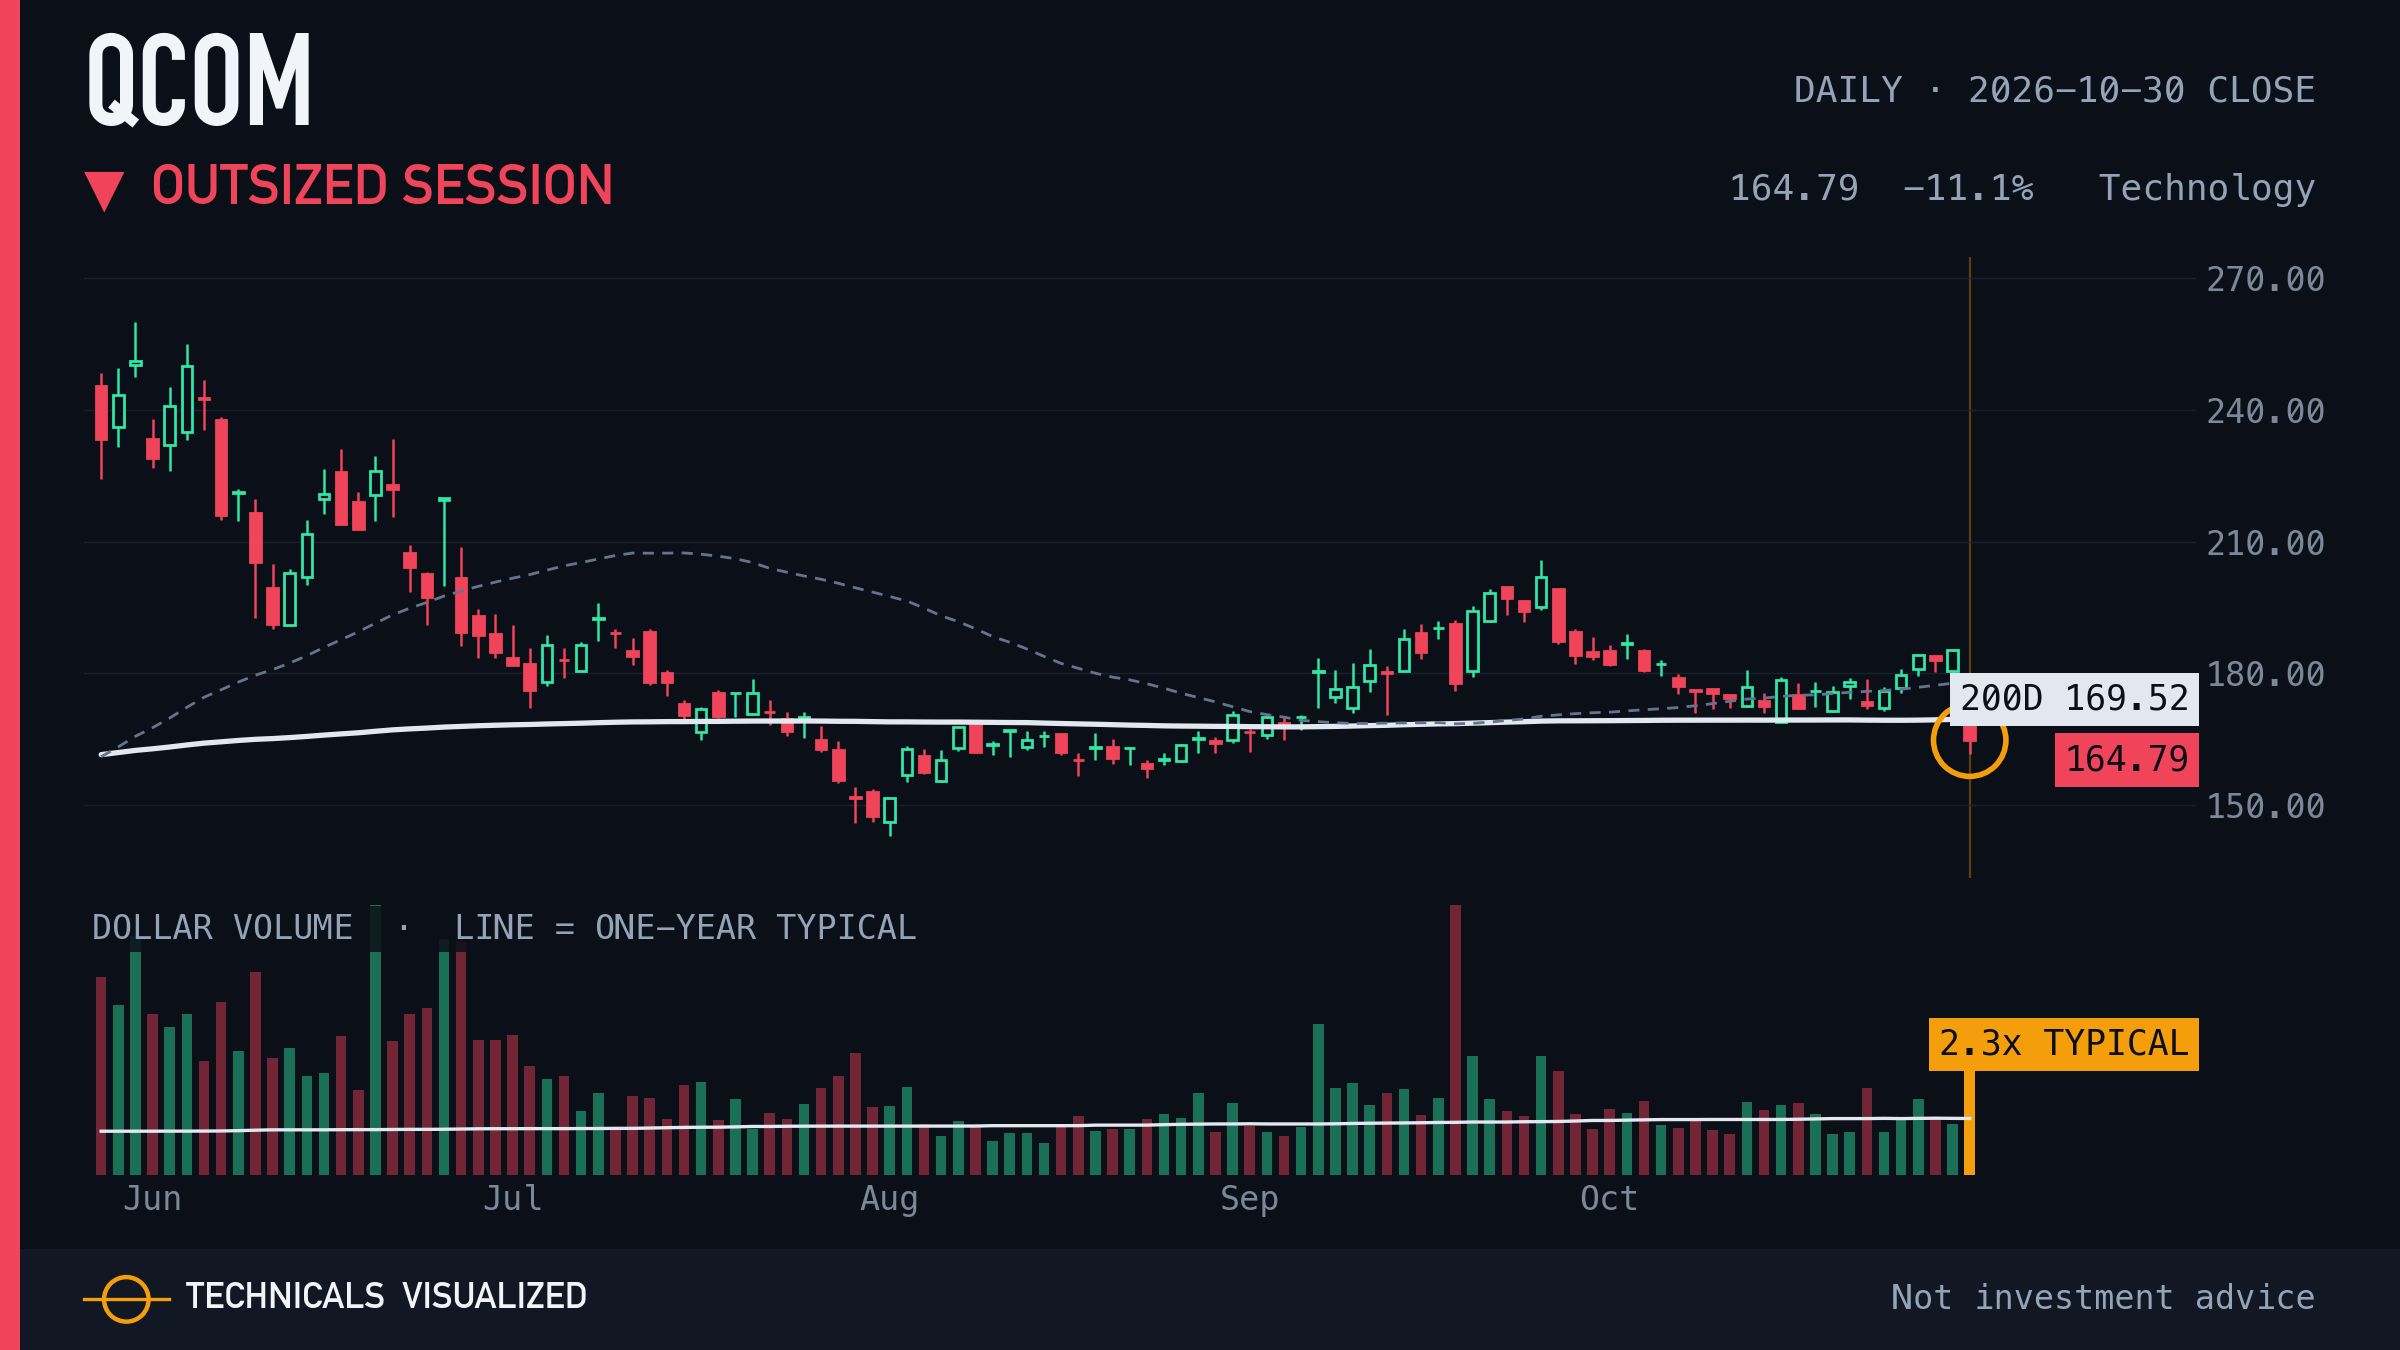
Qualcomm moved -11.1% in one session, 4.6 times its usual daily move.
One session, measured against this chart's own usual move. It describes the day, not the next one.
|
|
12 · SPDR Gold Shares (GLD) · New 52-week low
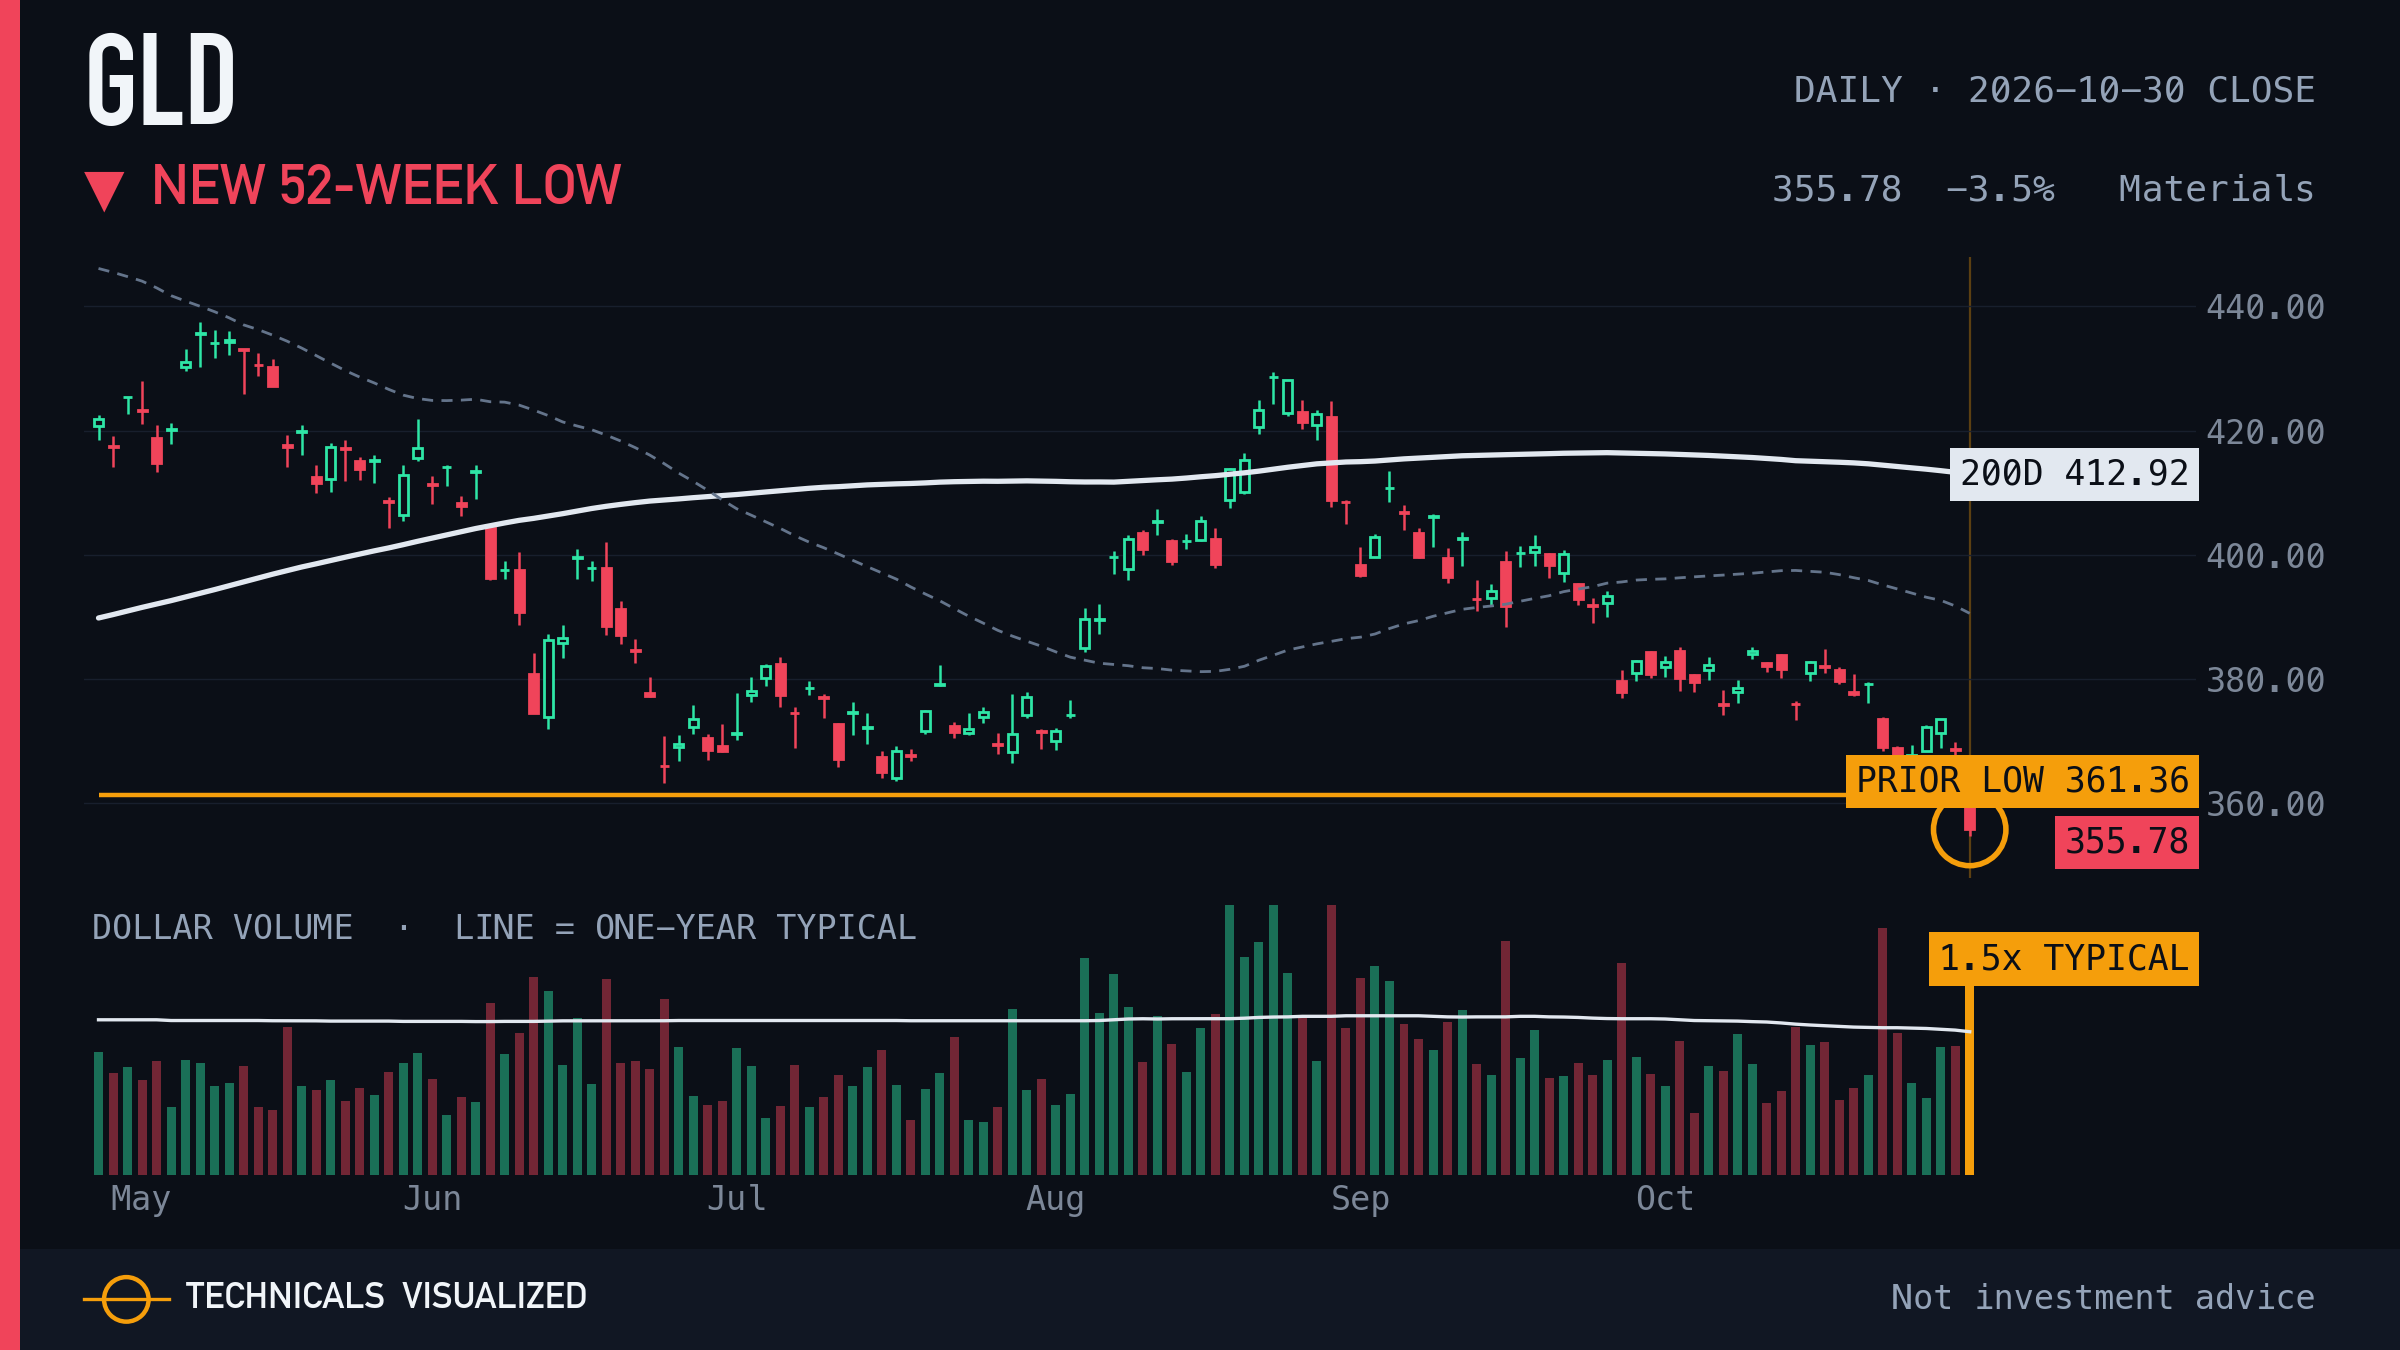
SPDR Gold Shares closed below its prior 52-week low (first such close in 1027 sessions).
The prior 52-week low was $361.36.
|
|
13 · Illumina (ILMN) · Outsized session
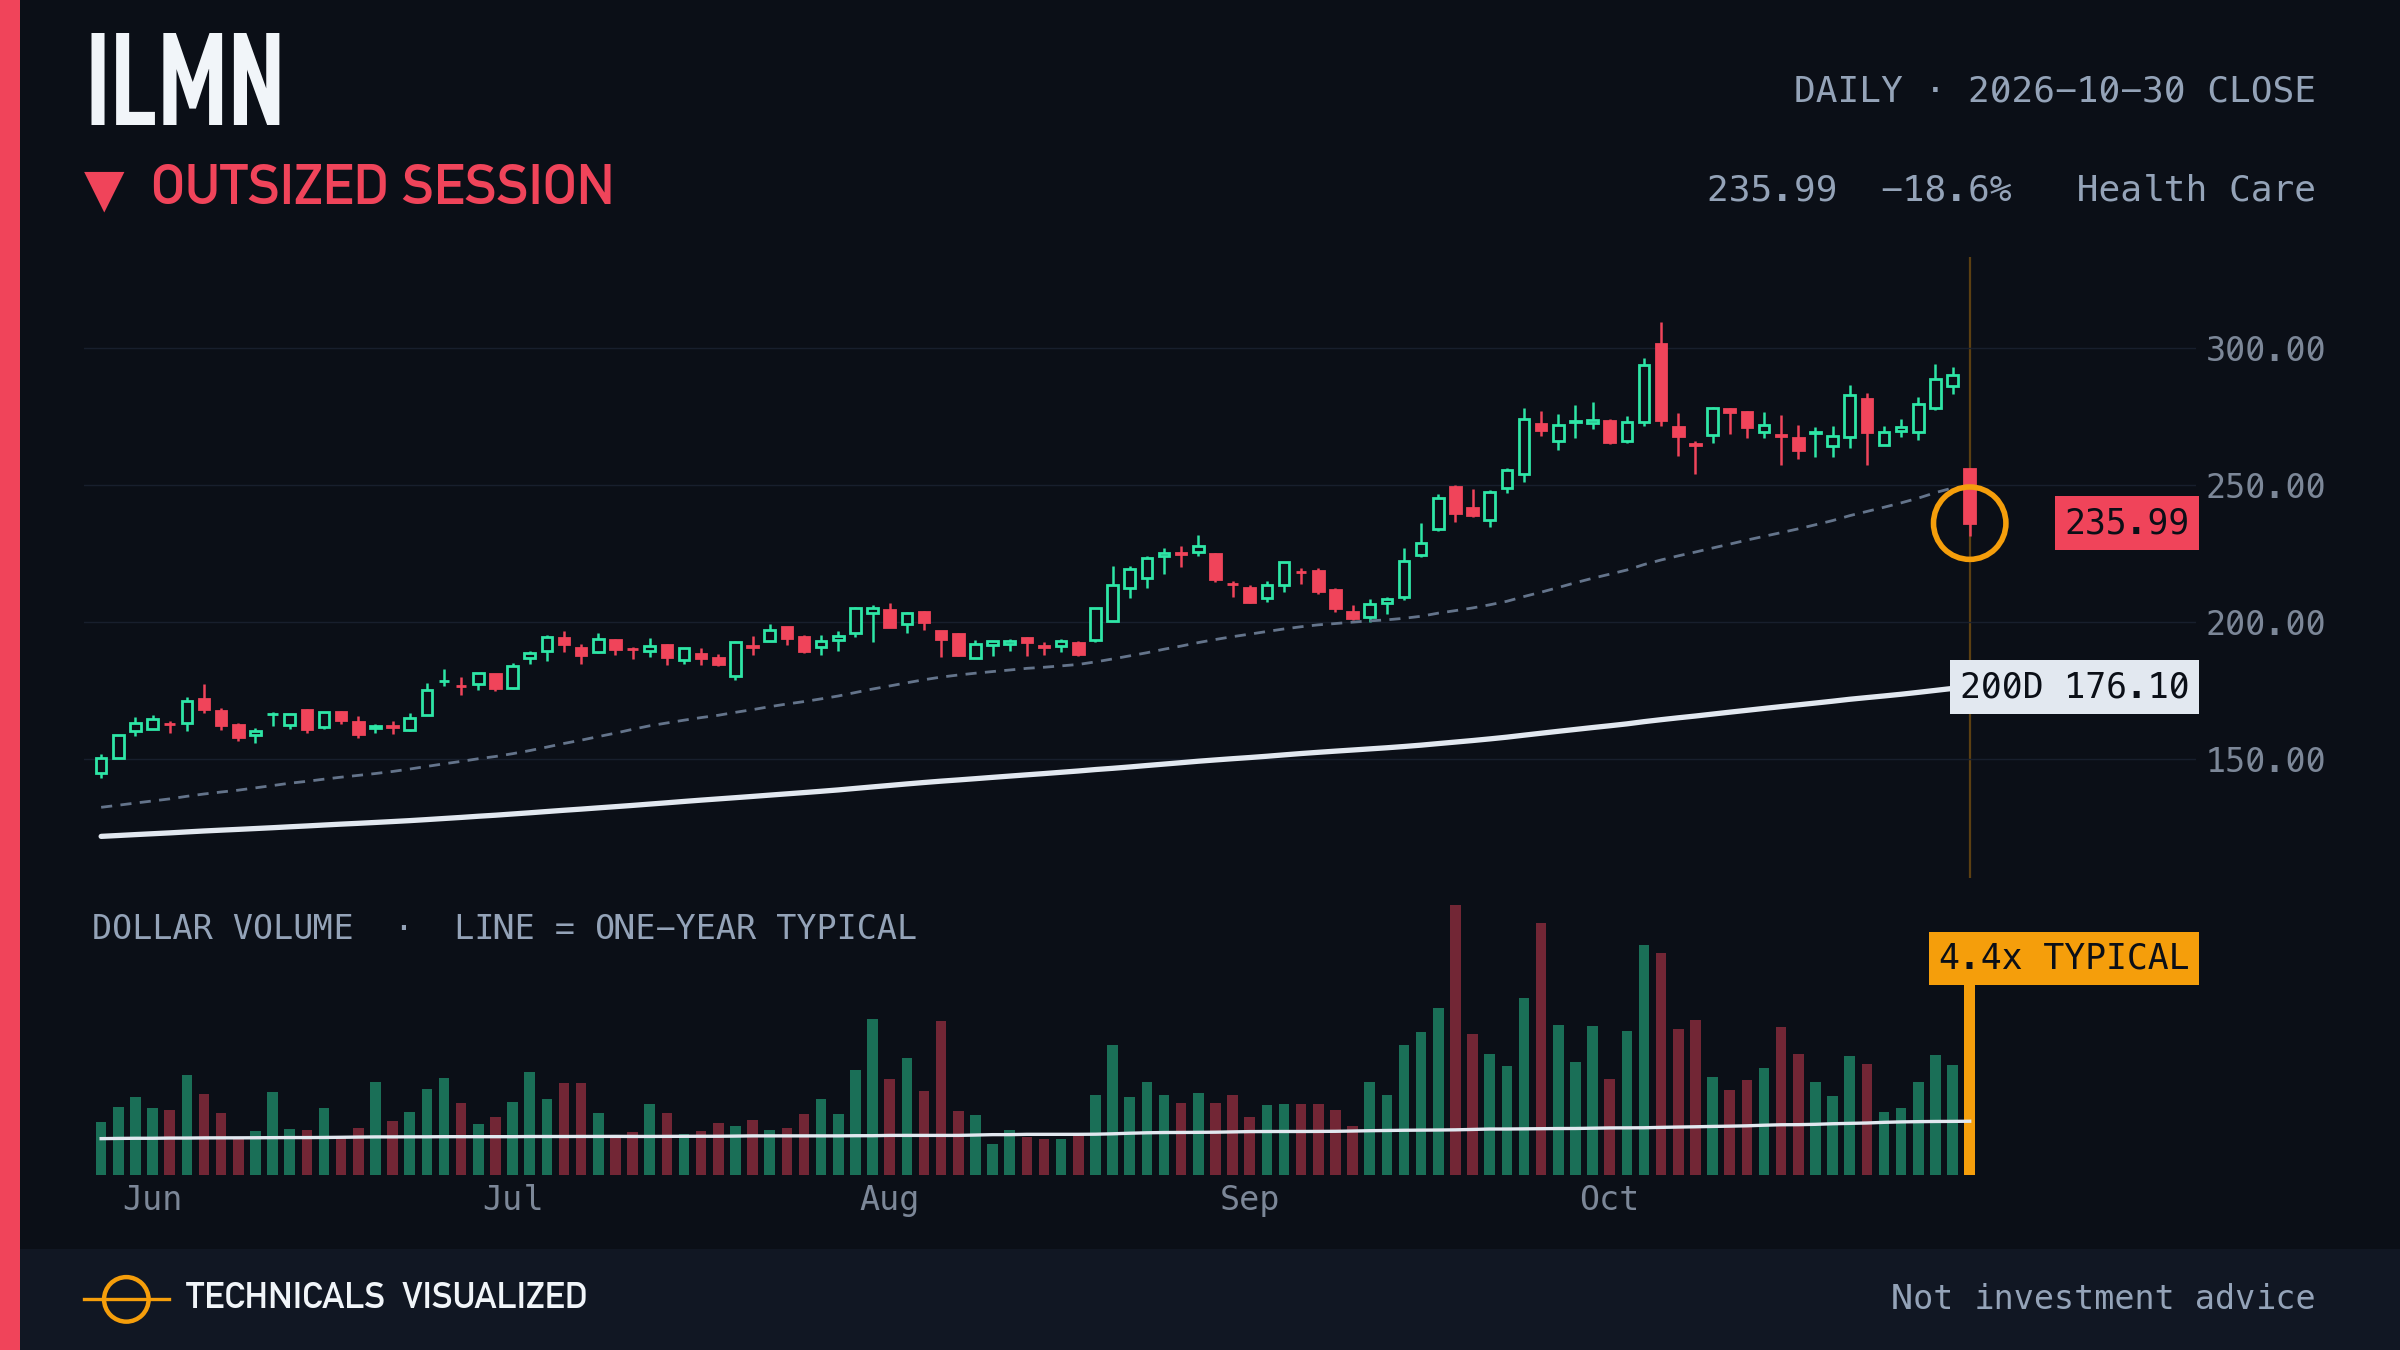
Illumina moved -18.6% in one session, 6.3 times its usual daily move.
One session, measured against this chart's own usual move. It describes the day, not the next one.
|
|
14 · Stryker (SYK) · Volume surge
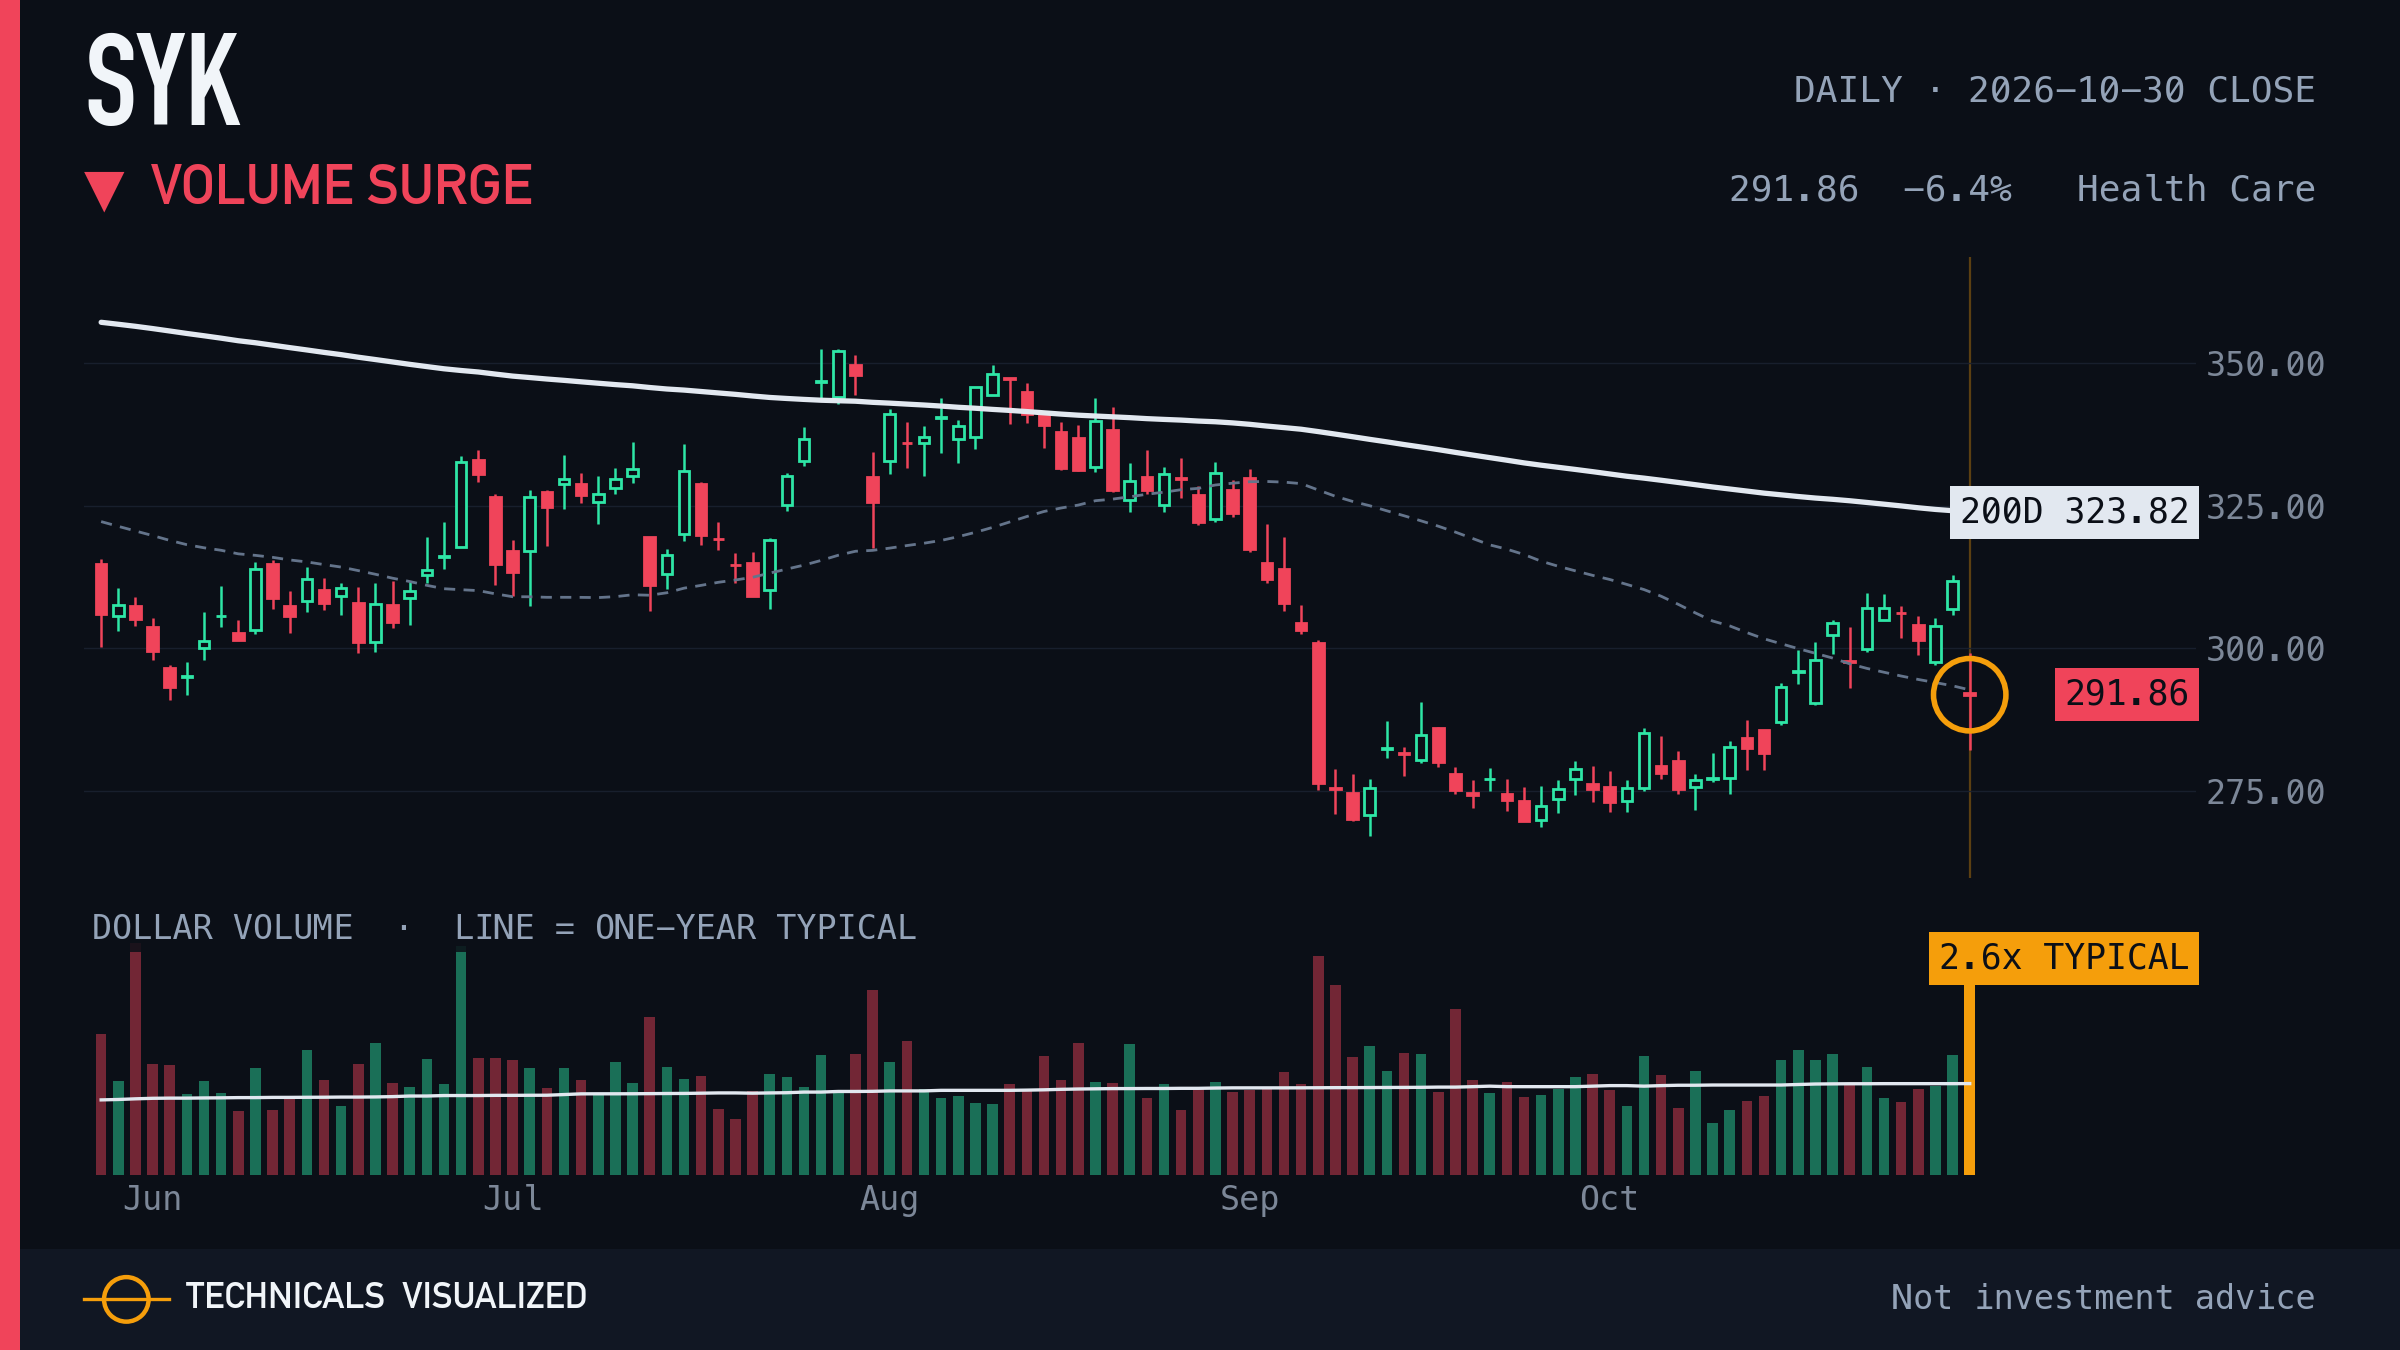
Stryker traded 2.6x its typical dollar volume on a -6.4% move.
One session, measured against this chart's own usual move. It describes the day, not the next one.
|
|
15 · AES Corporation (AES) · Outsized session
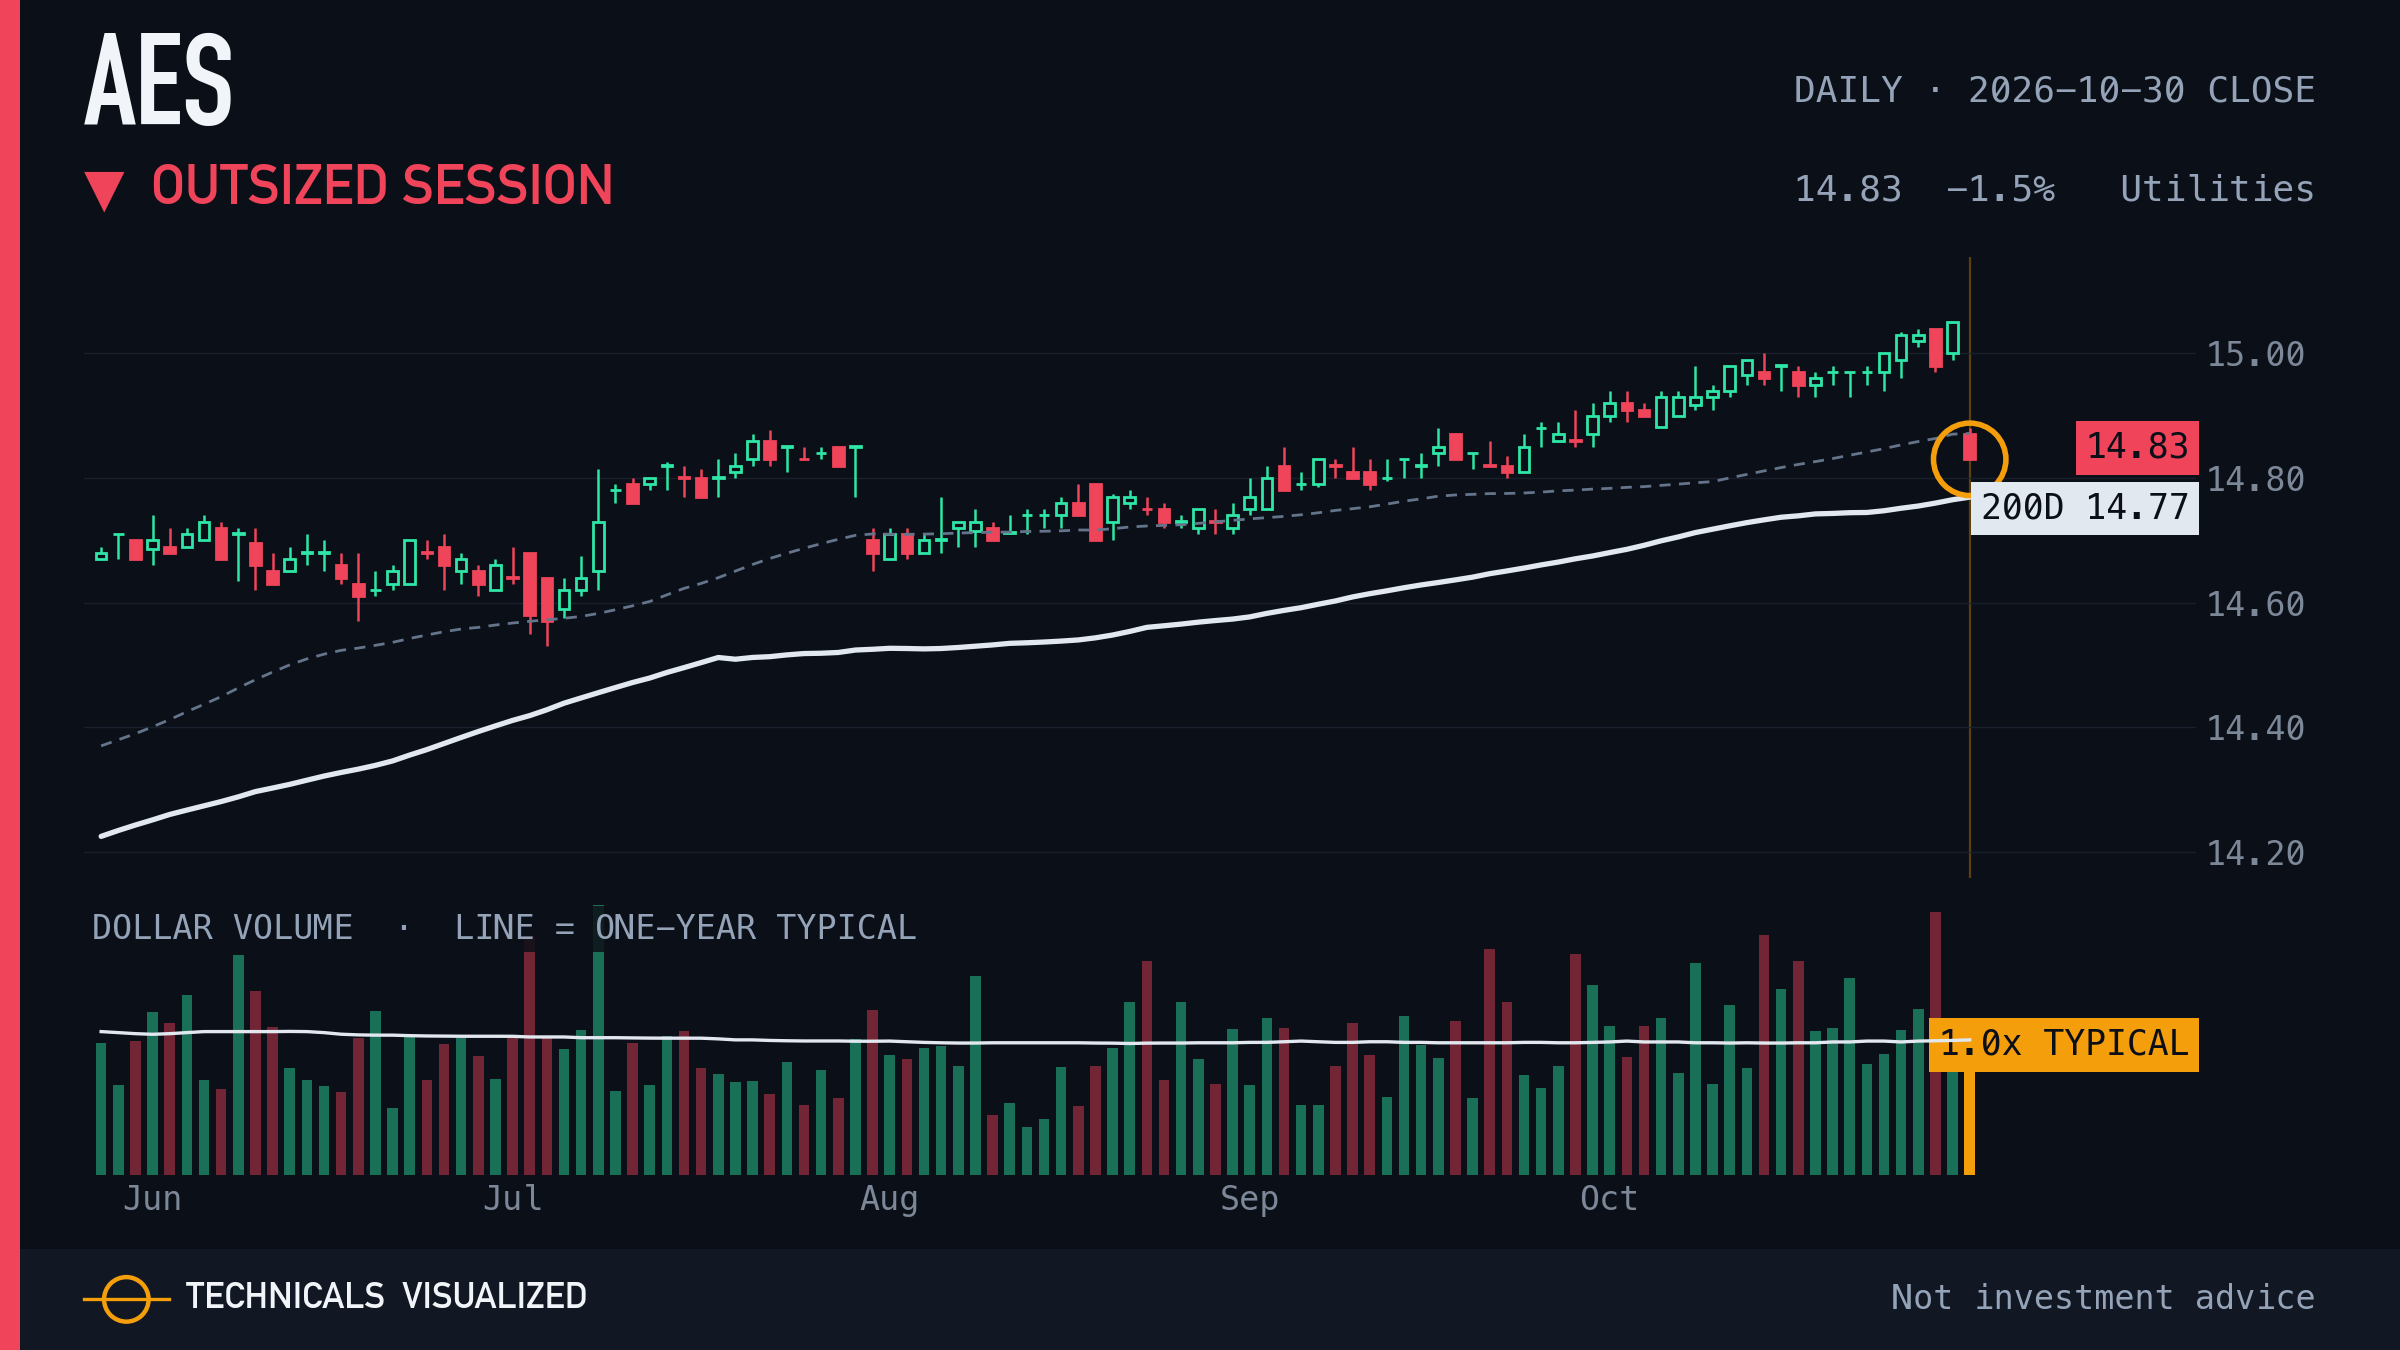
AES Corporation moved -1.5% in one session, 9.1 times its usual daily move.
One session, measured against this chart's own usual move. It describes the day, not the next one.
|
|
16 · iShares MSCI Brazil ETF (EWZ) · Range breakdown
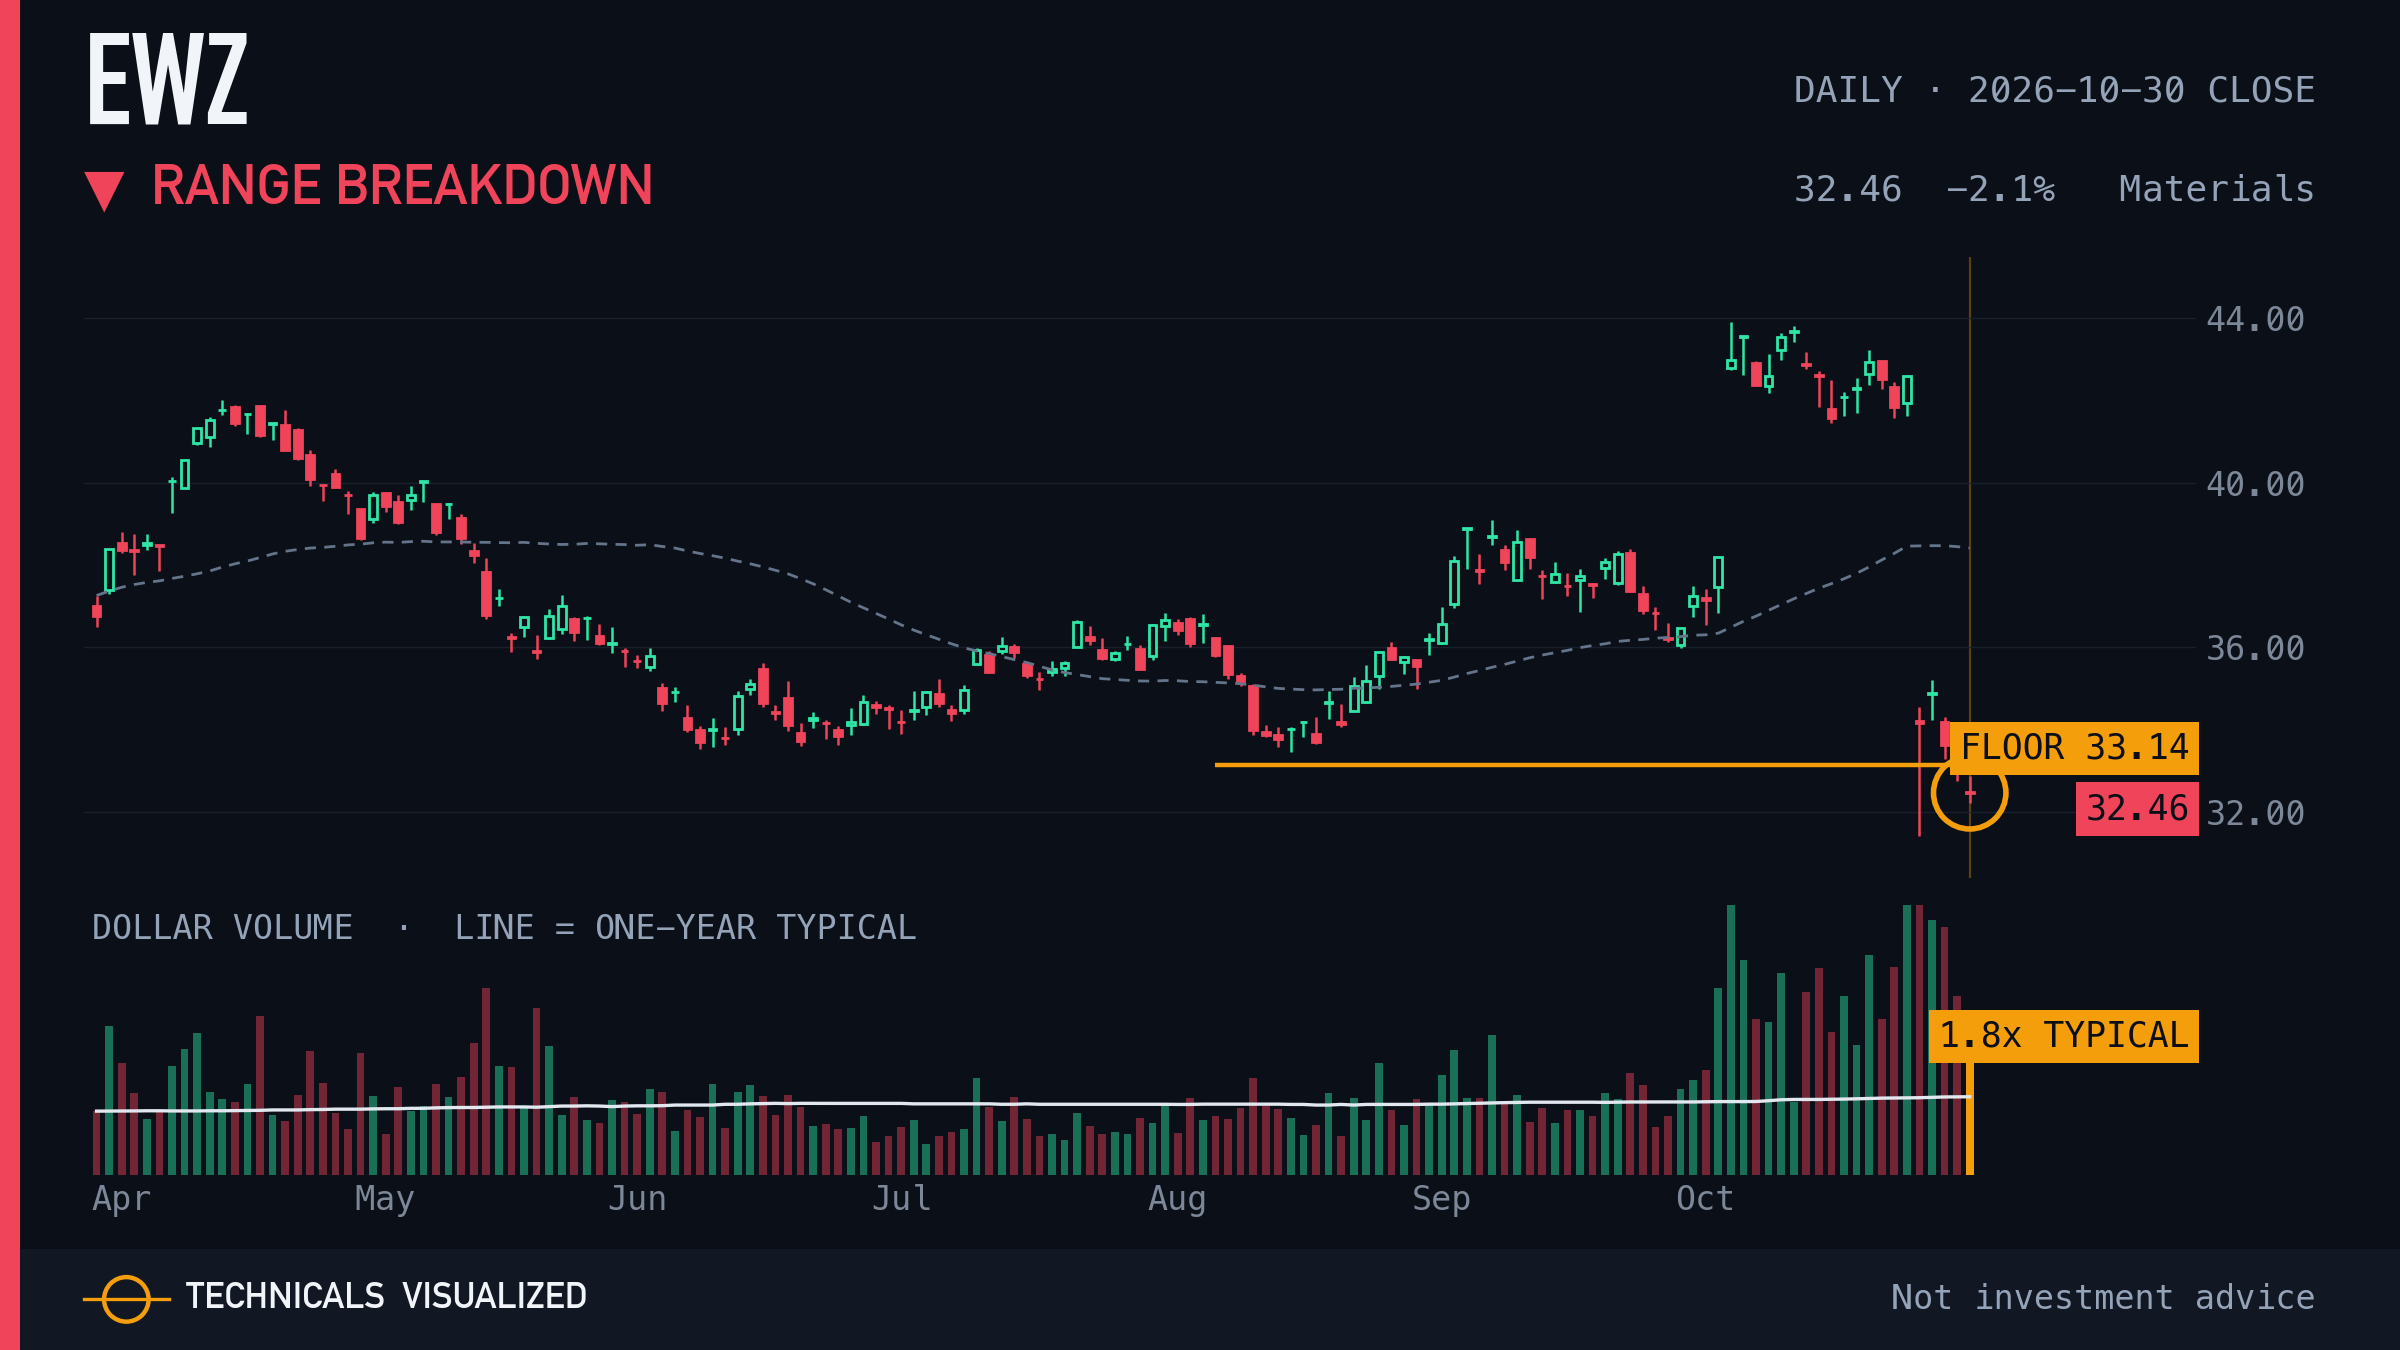
iShares MSCI Brazil ETF closed below a 60-session range (31.4% tall, floor tested 12 times).
The range floor is $33.14. A close back inside the range undoes the break.
|
|
17 · Robinhood Markets (HOOD) · Range breakdown
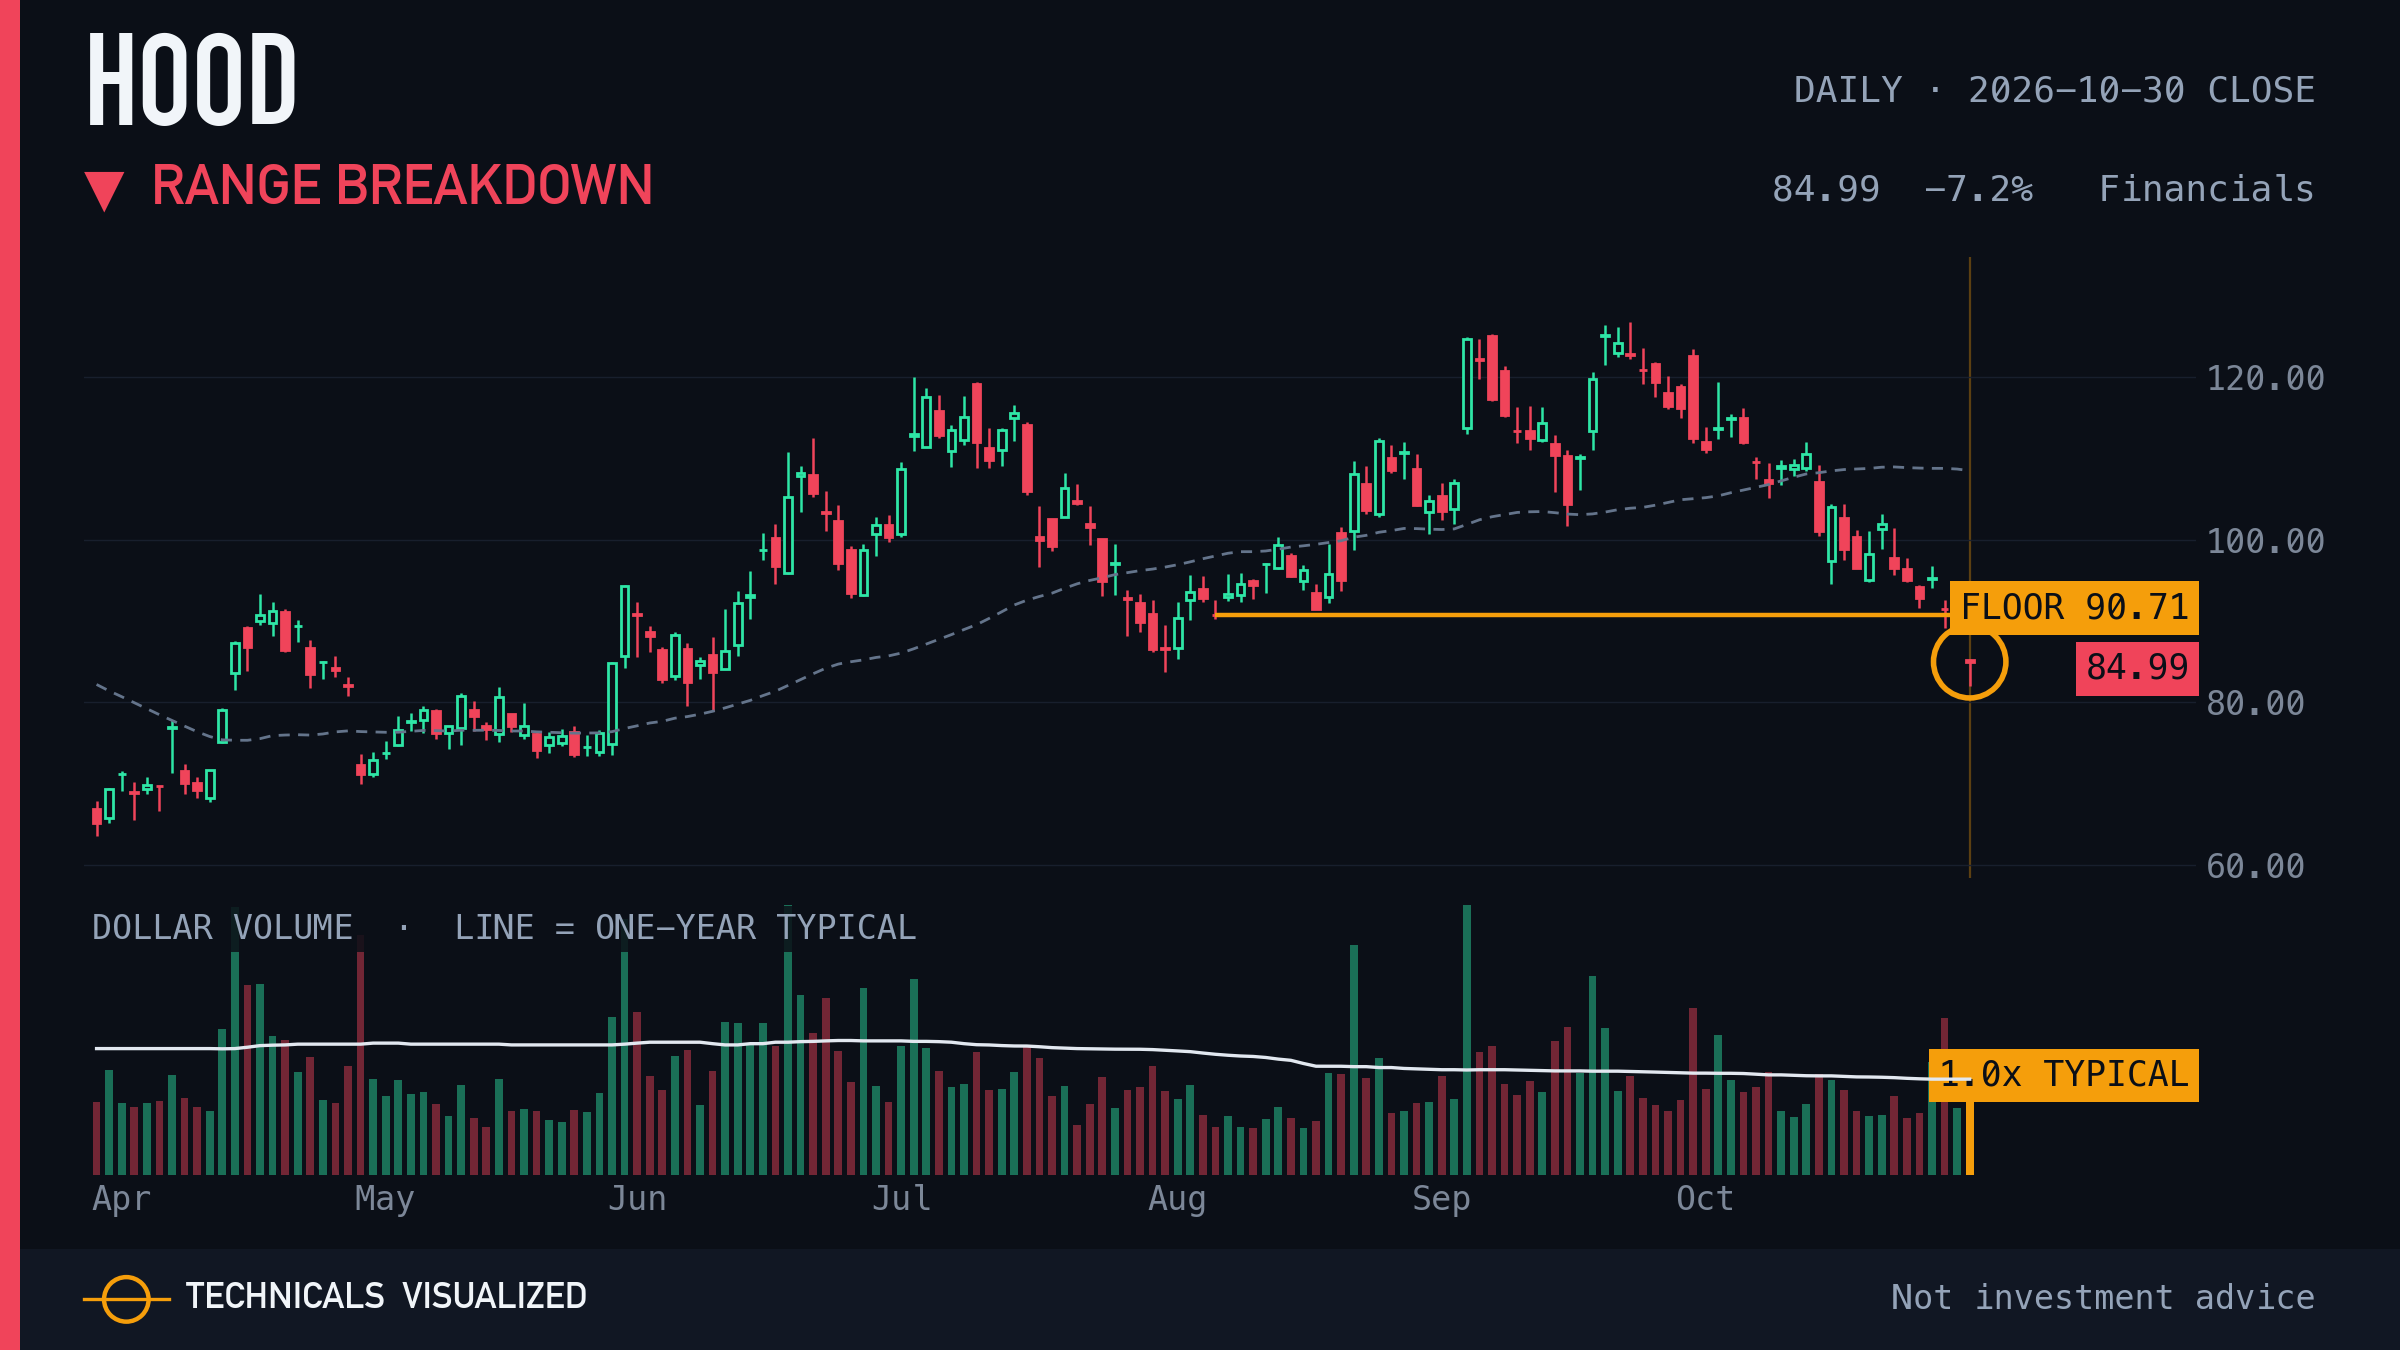
Robinhood Markets closed below a 60-session range (37.5% tall, floor tested 14 times).
The range floor is $90.71. A close back inside the range undoes the break.
|
|
18 · Altria Group (MO) · Exhaustion count (weekly)
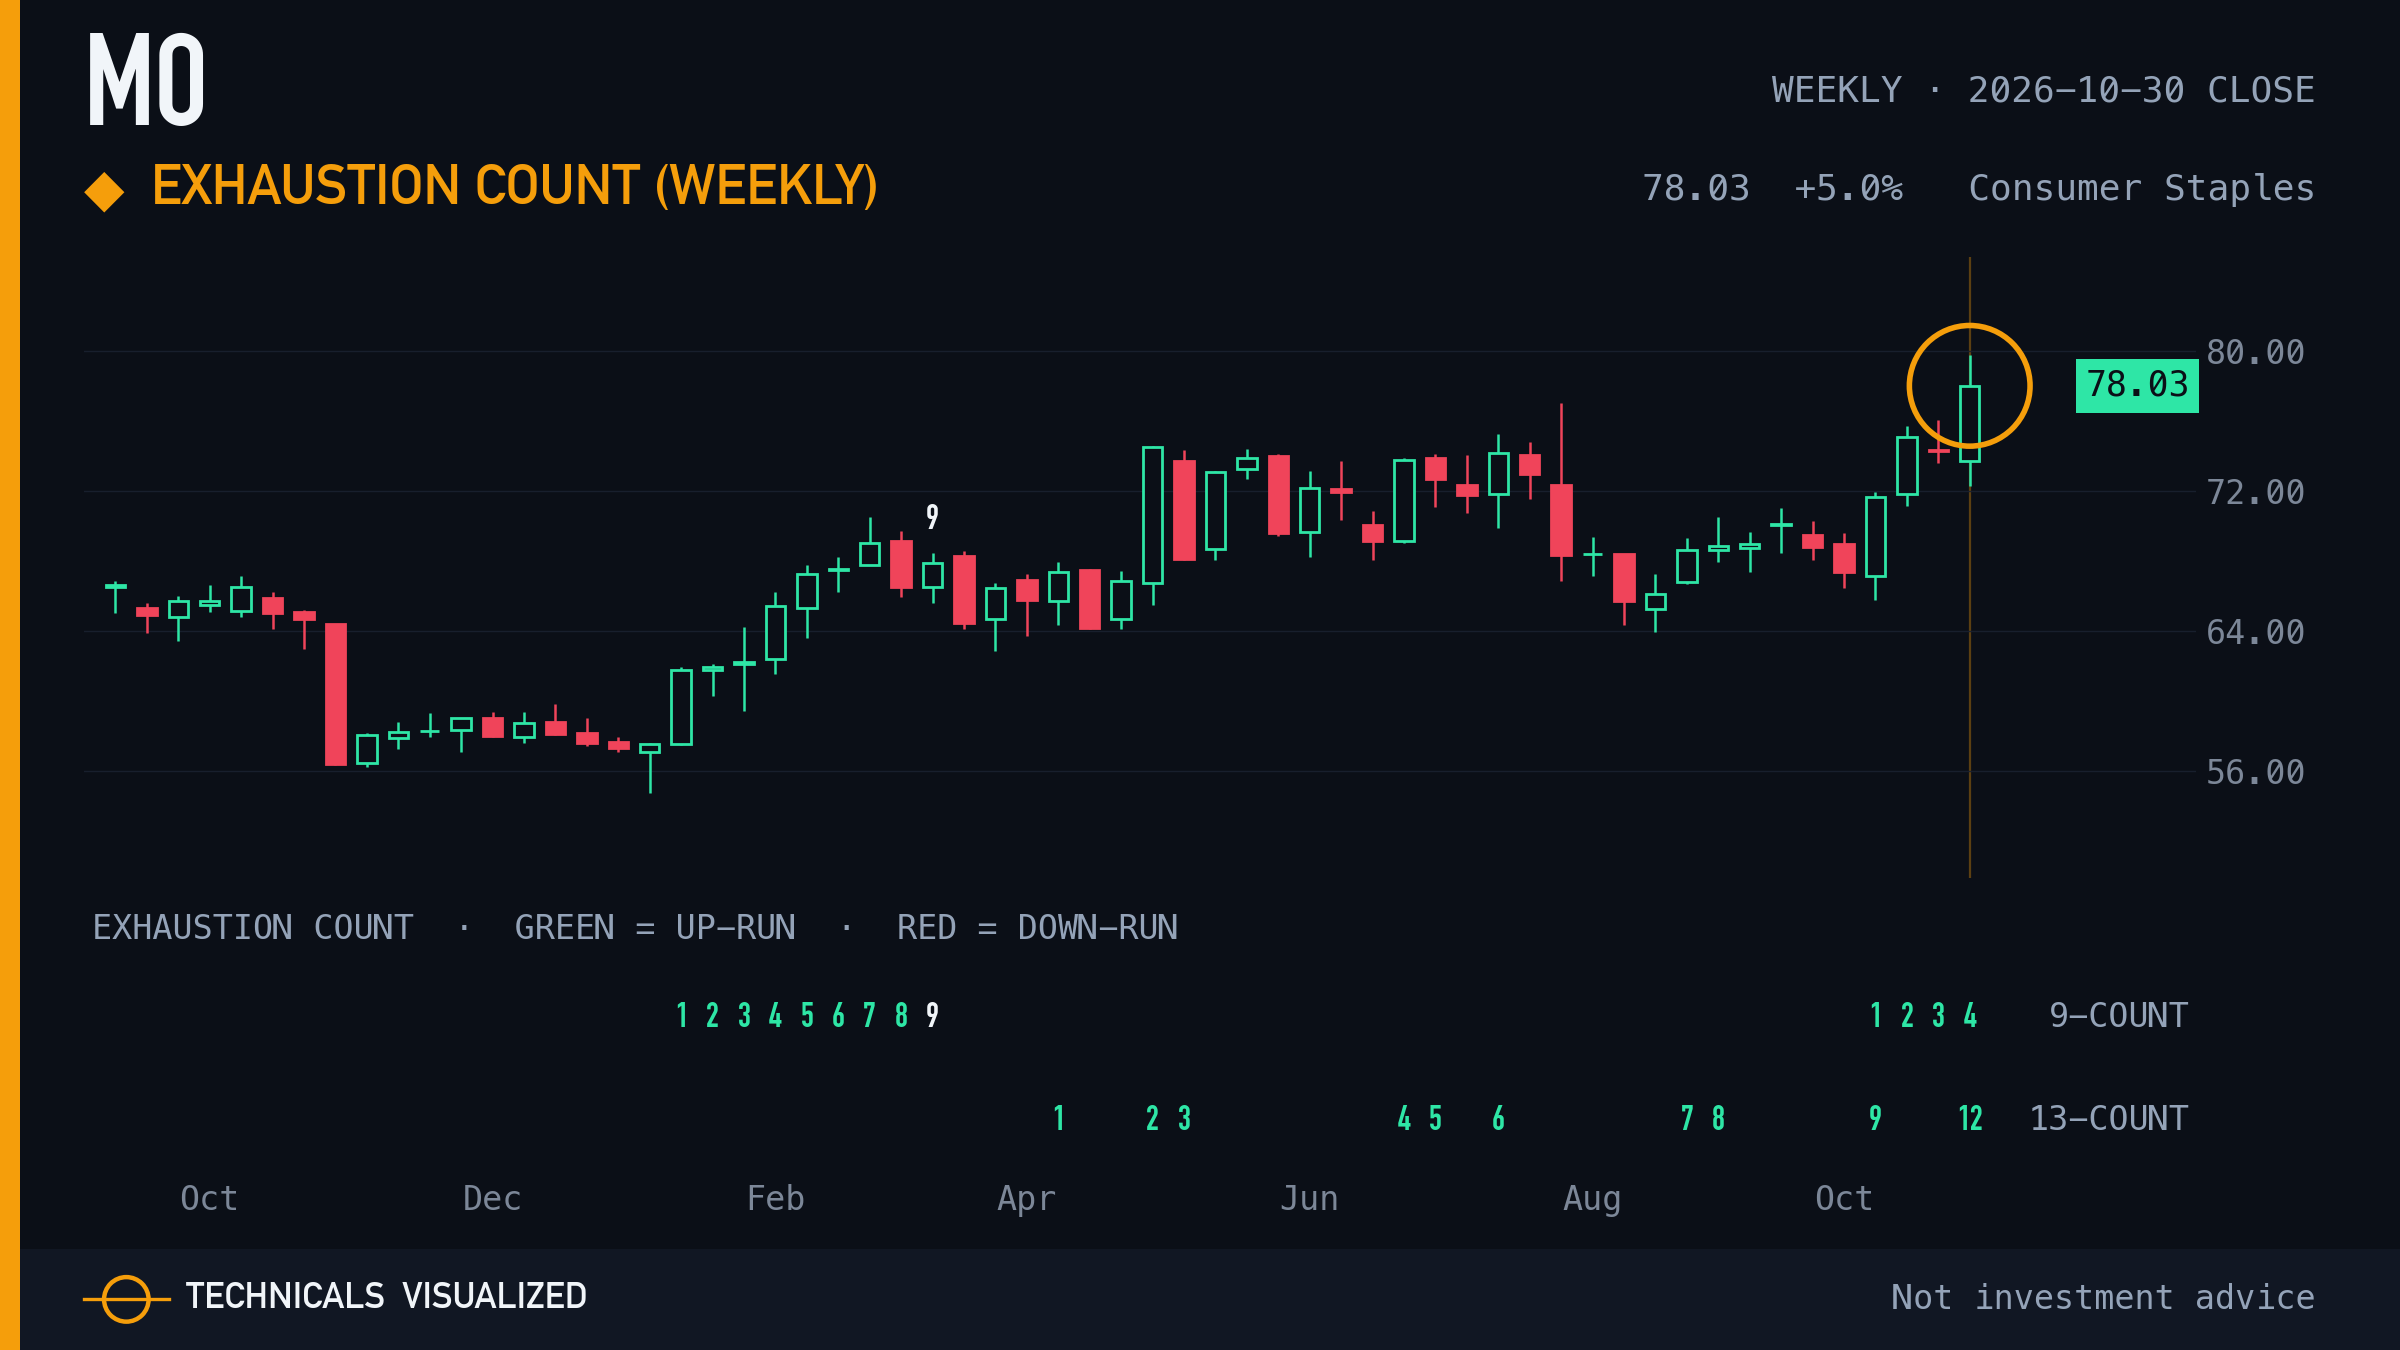
Altria Group weekly exhaustion count: count at 12 of 13 (upside count).
One bar short of a completed count. A count marks a stretched move, not a turn signal.
|
|
19 · Global Payments (GPN) · Volume surge
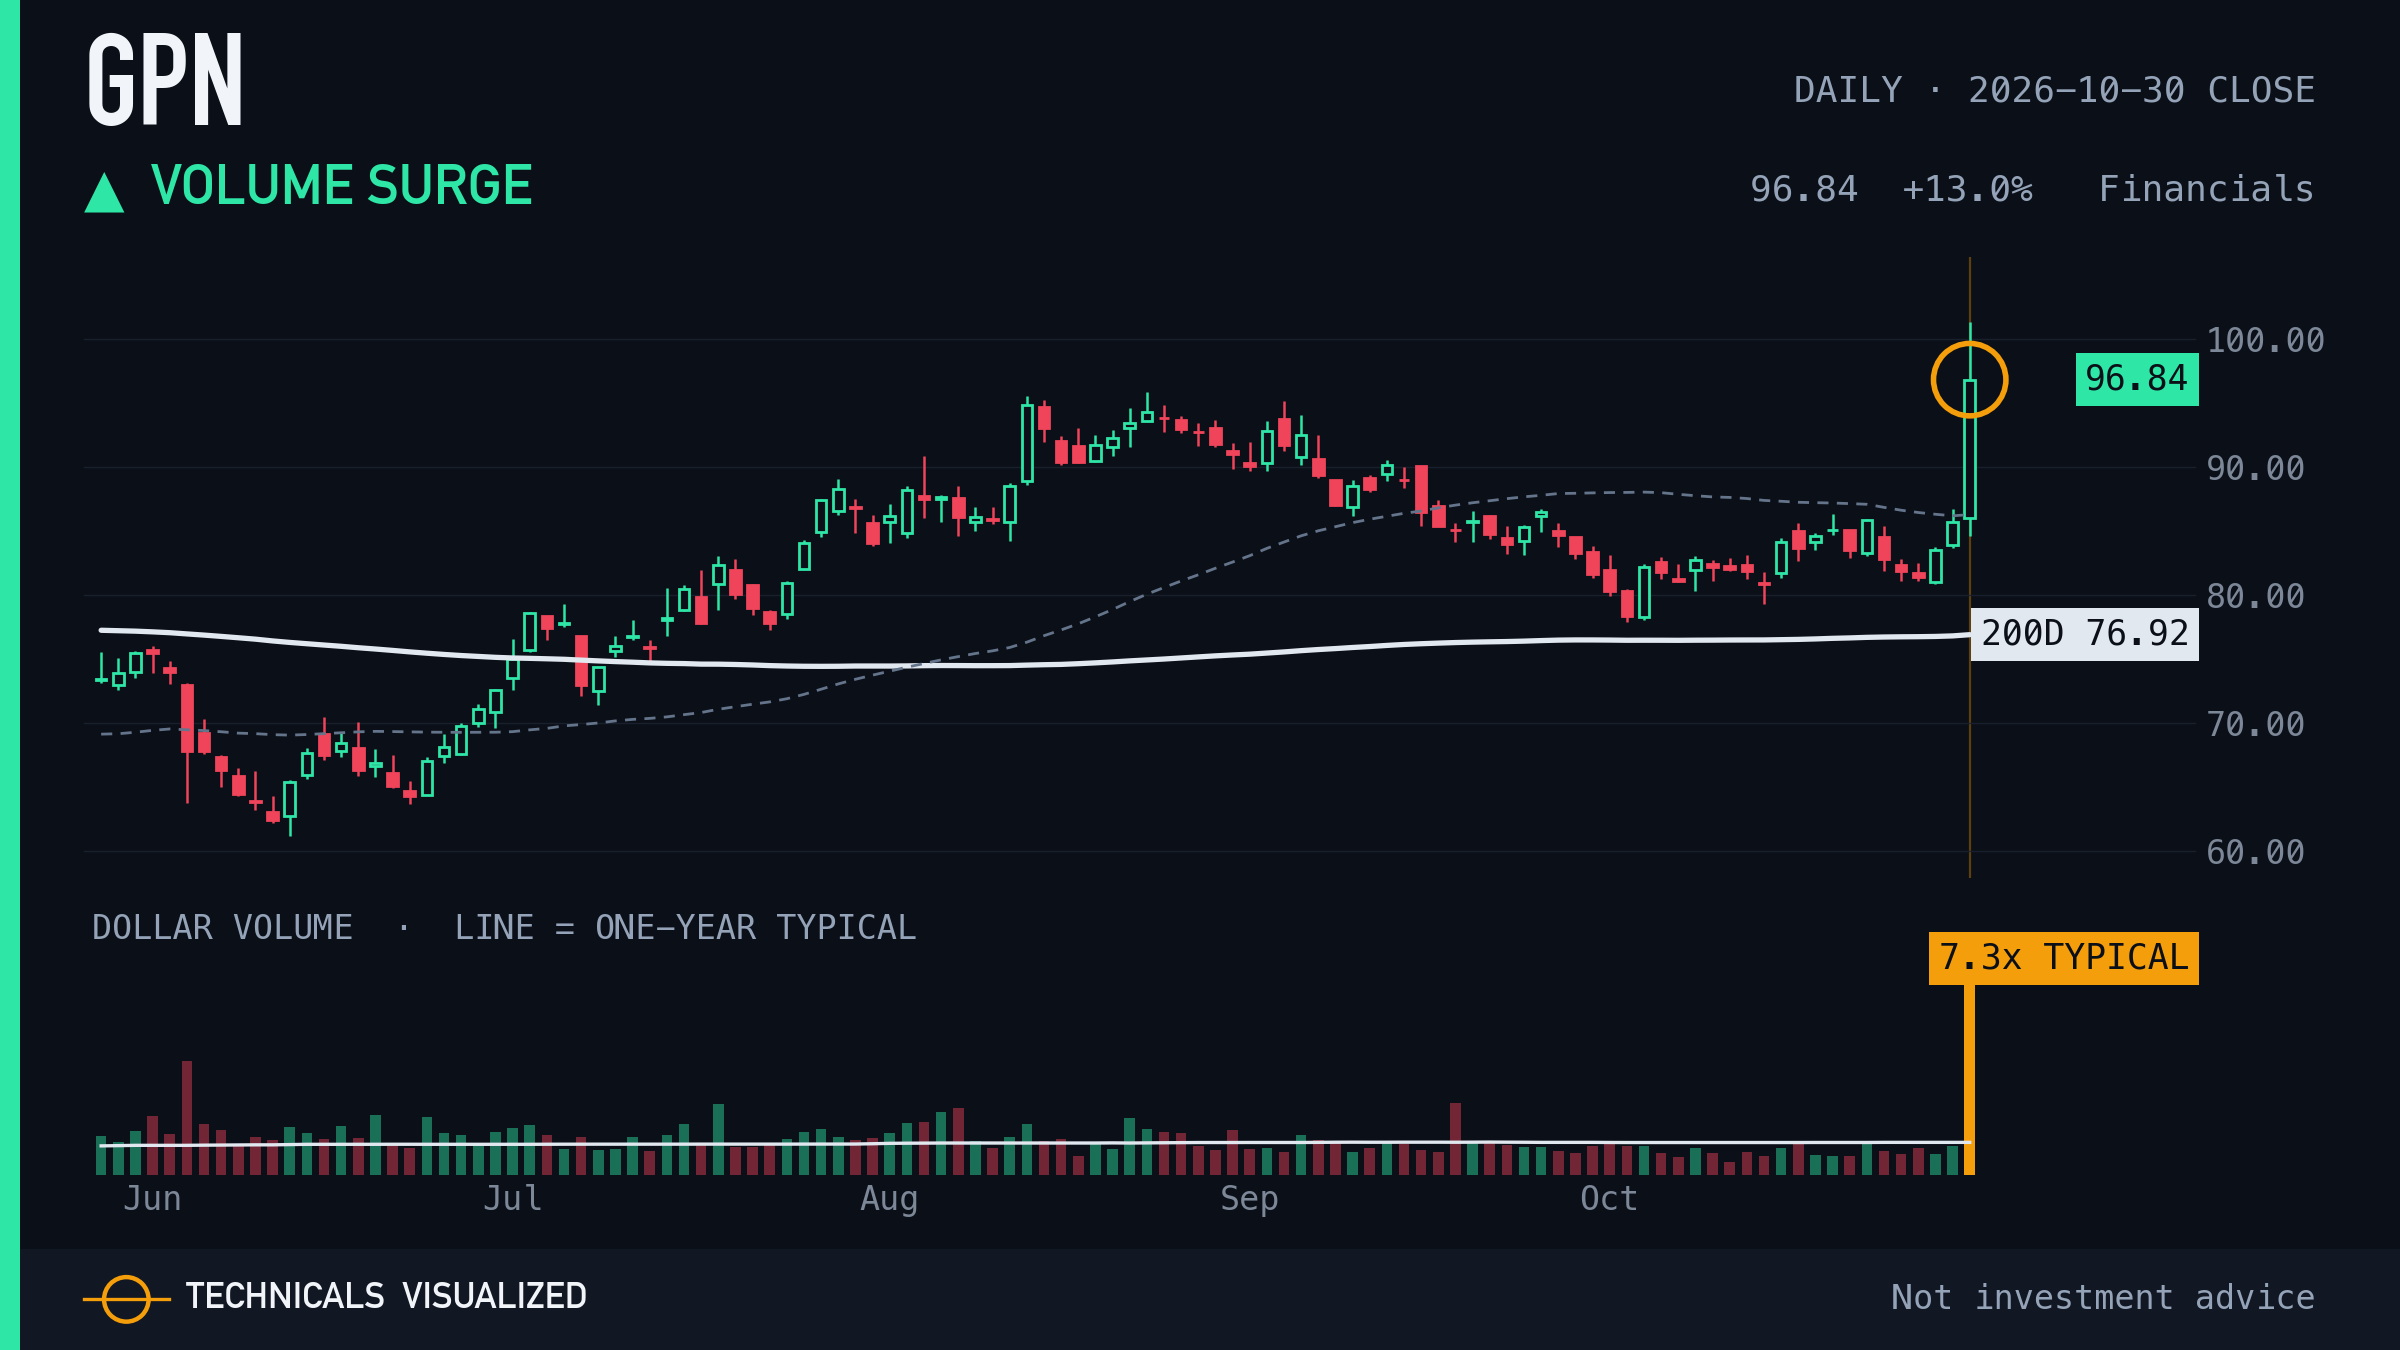
Global Payments traded 7.3x its typical dollar volume on a +13.0% move.
One session, measured against this chart's own usual move. It describes the day, not the next one.
|
|
20 · MercadoLibre (MELI) · Range breakdown
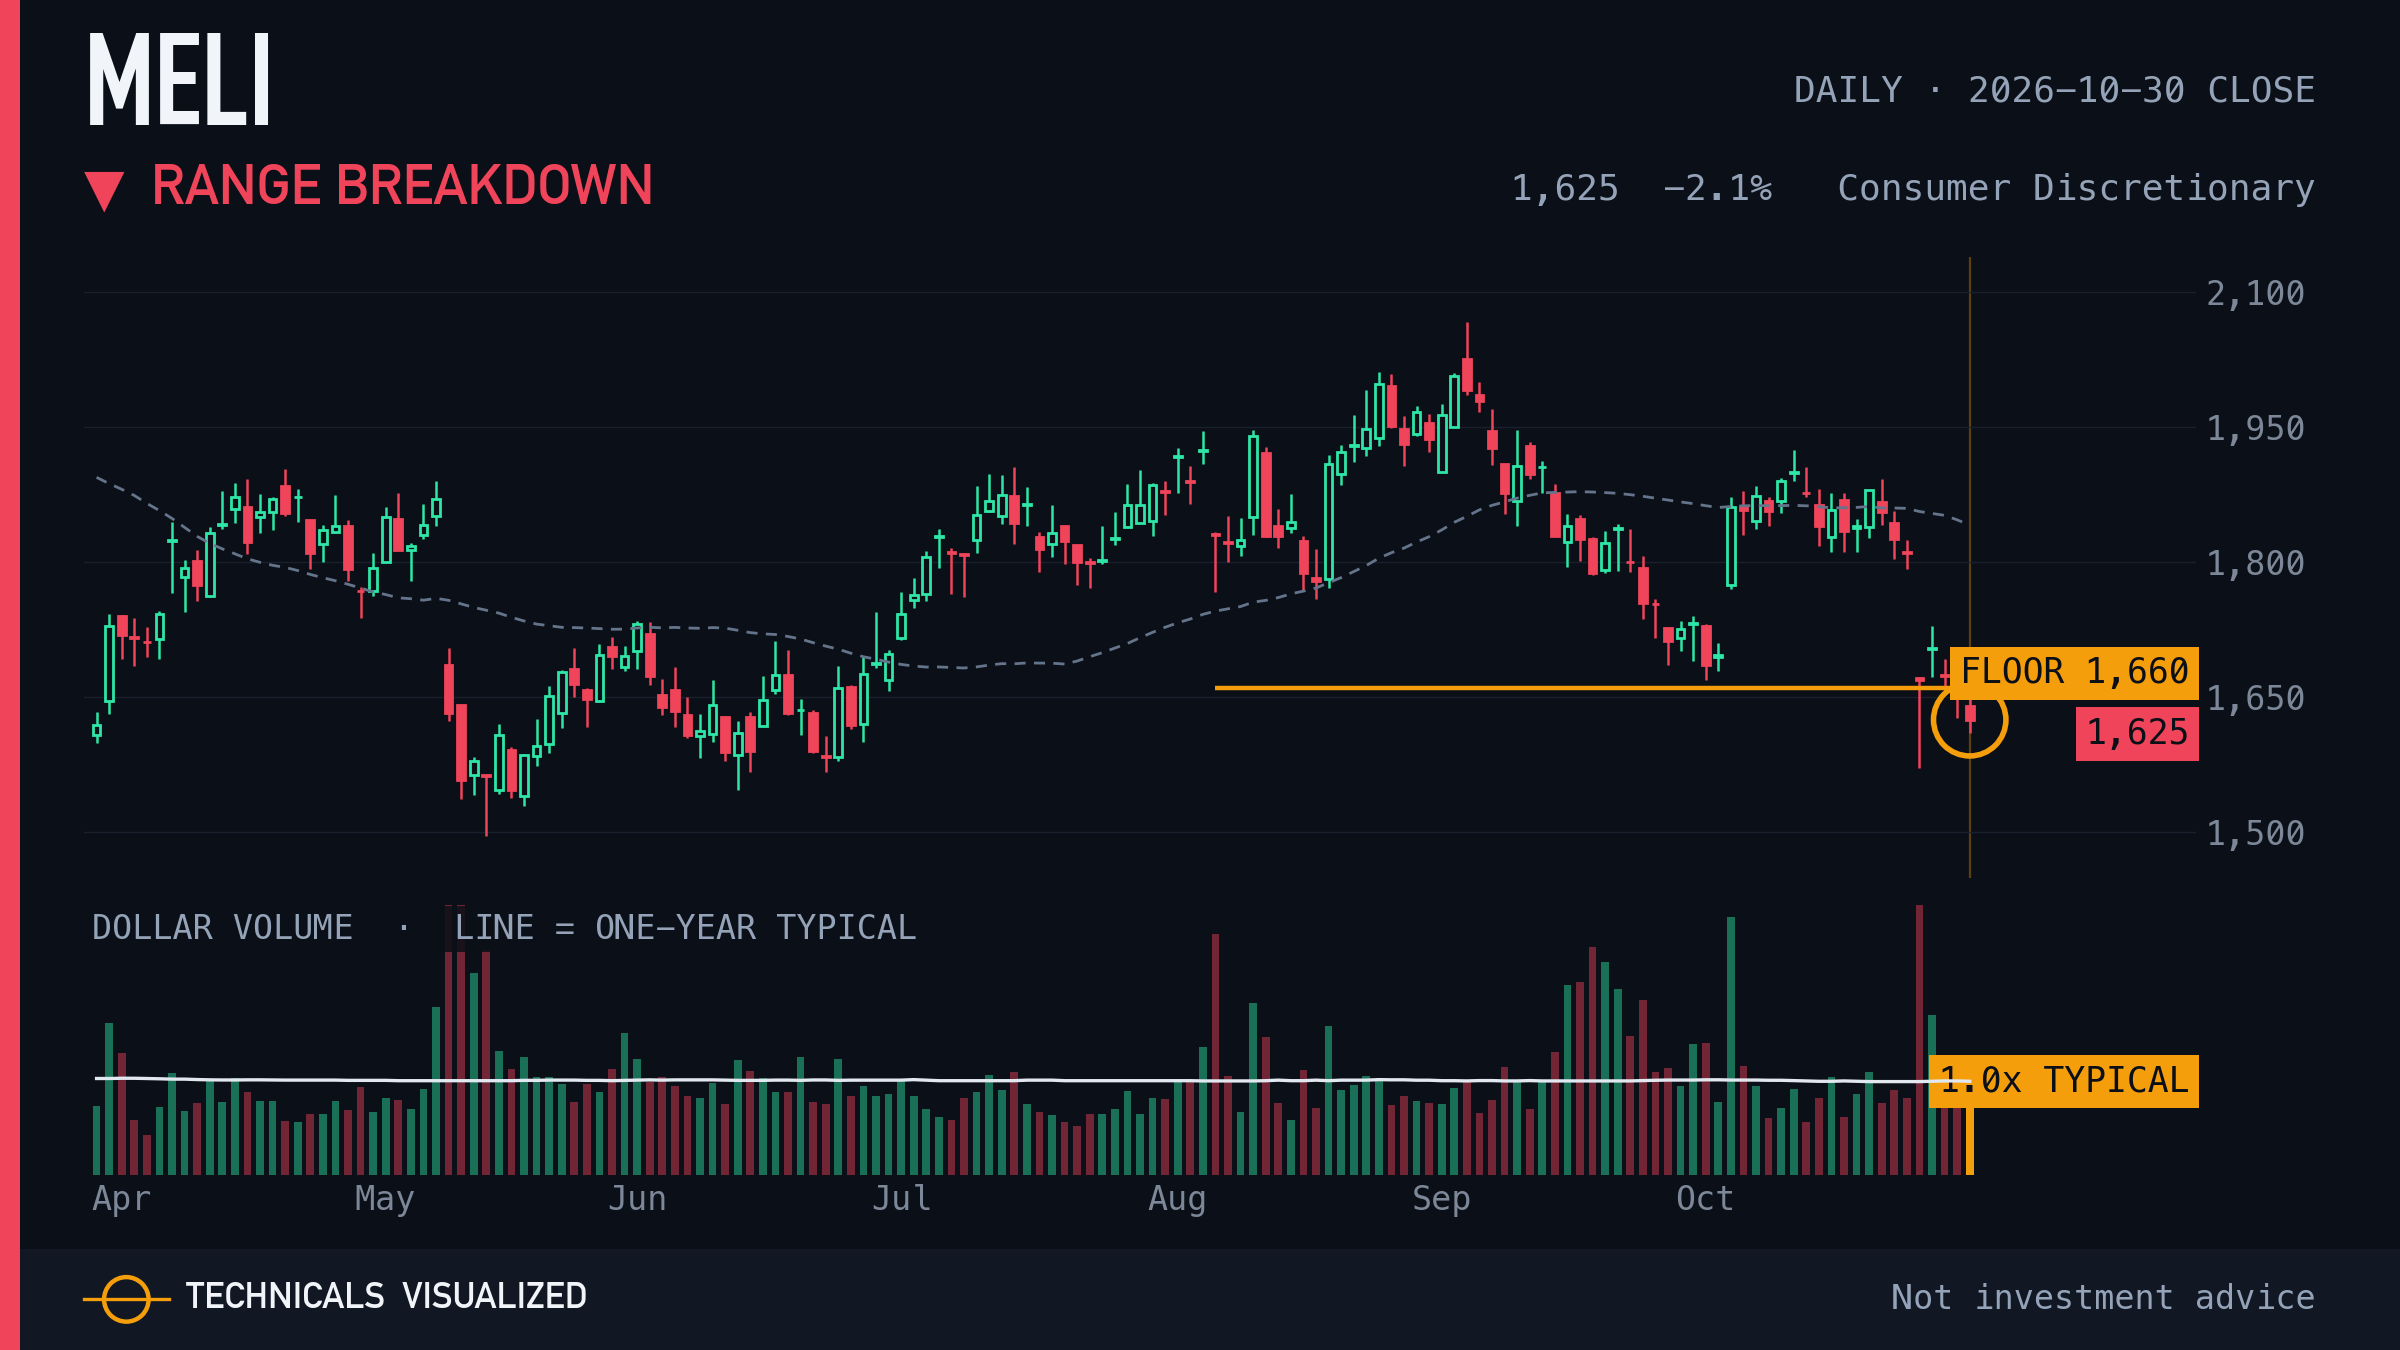
MercadoLibre closed below a 60-session range (20.9% tall, floor tested 6 times).
The range floor is $1,660. A close back inside the range undoes the break.
|