MajorsThe same three every day: Bitcoin, Ethereum and Solana. Hyperliquid and Zcash join when they print a reading. |
|
01 · Bitcoin (BTC) · Daily chart
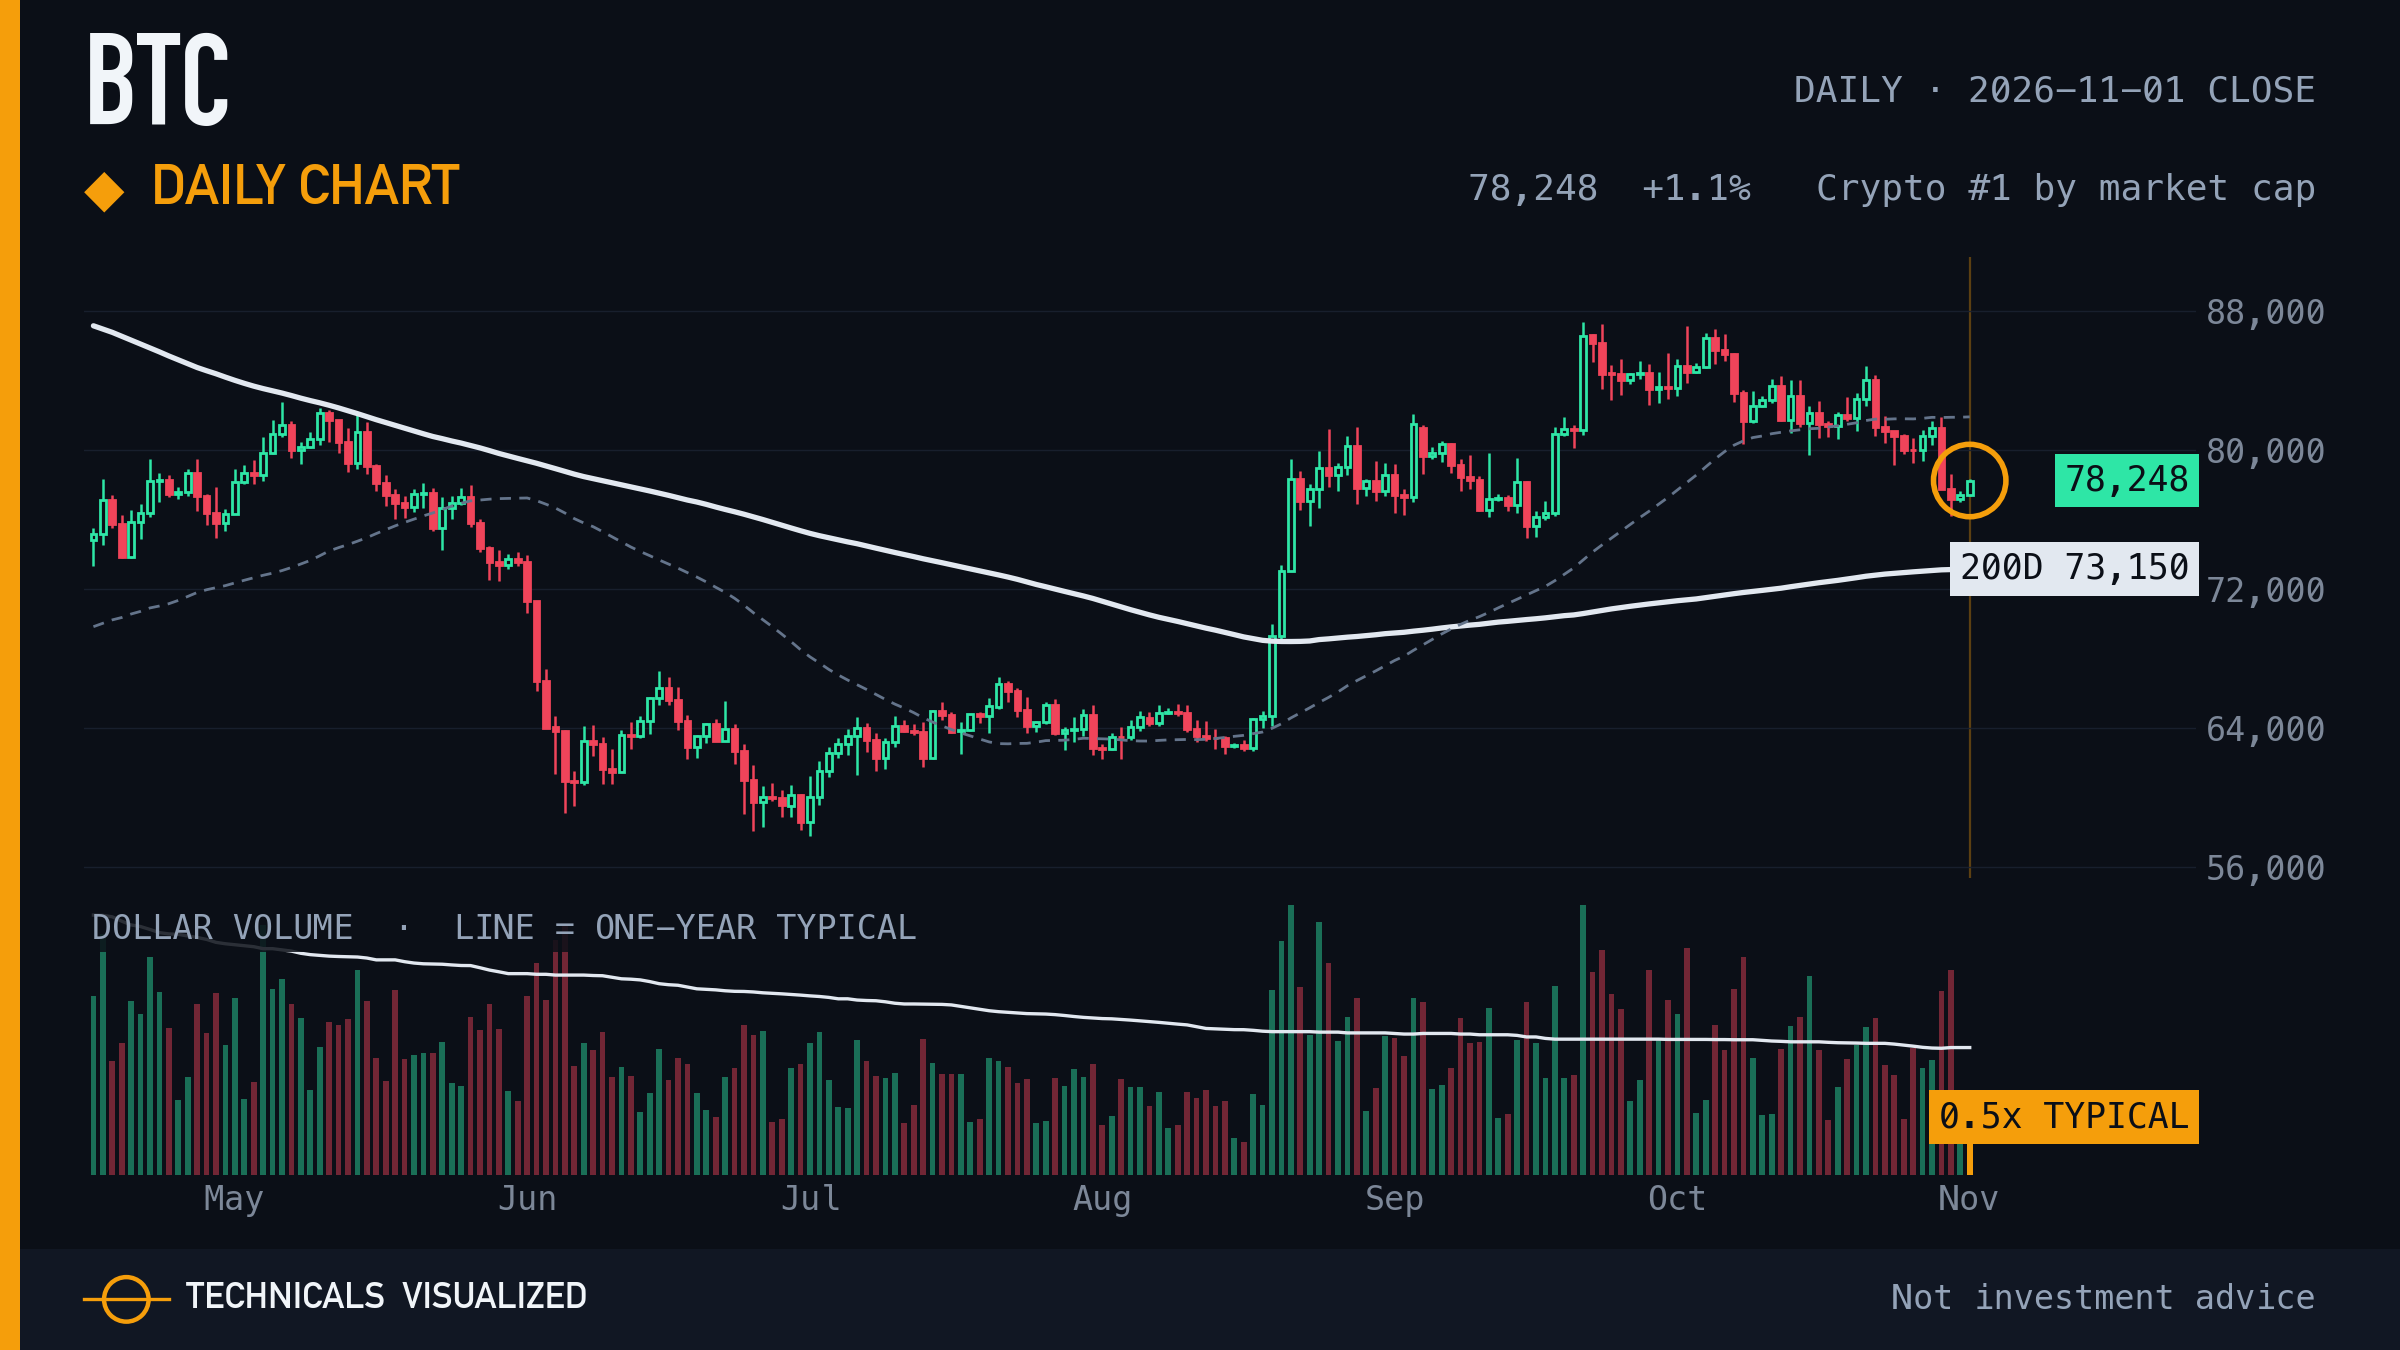
Bitcoin closed at $78,248, +1.1% on the day, 7.0% above its 200-day average.
Shown in every edition, whether or not it printed a reading. The amber ring marks this close.
|
|
02 · Ethereum (ETH) · Daily chart
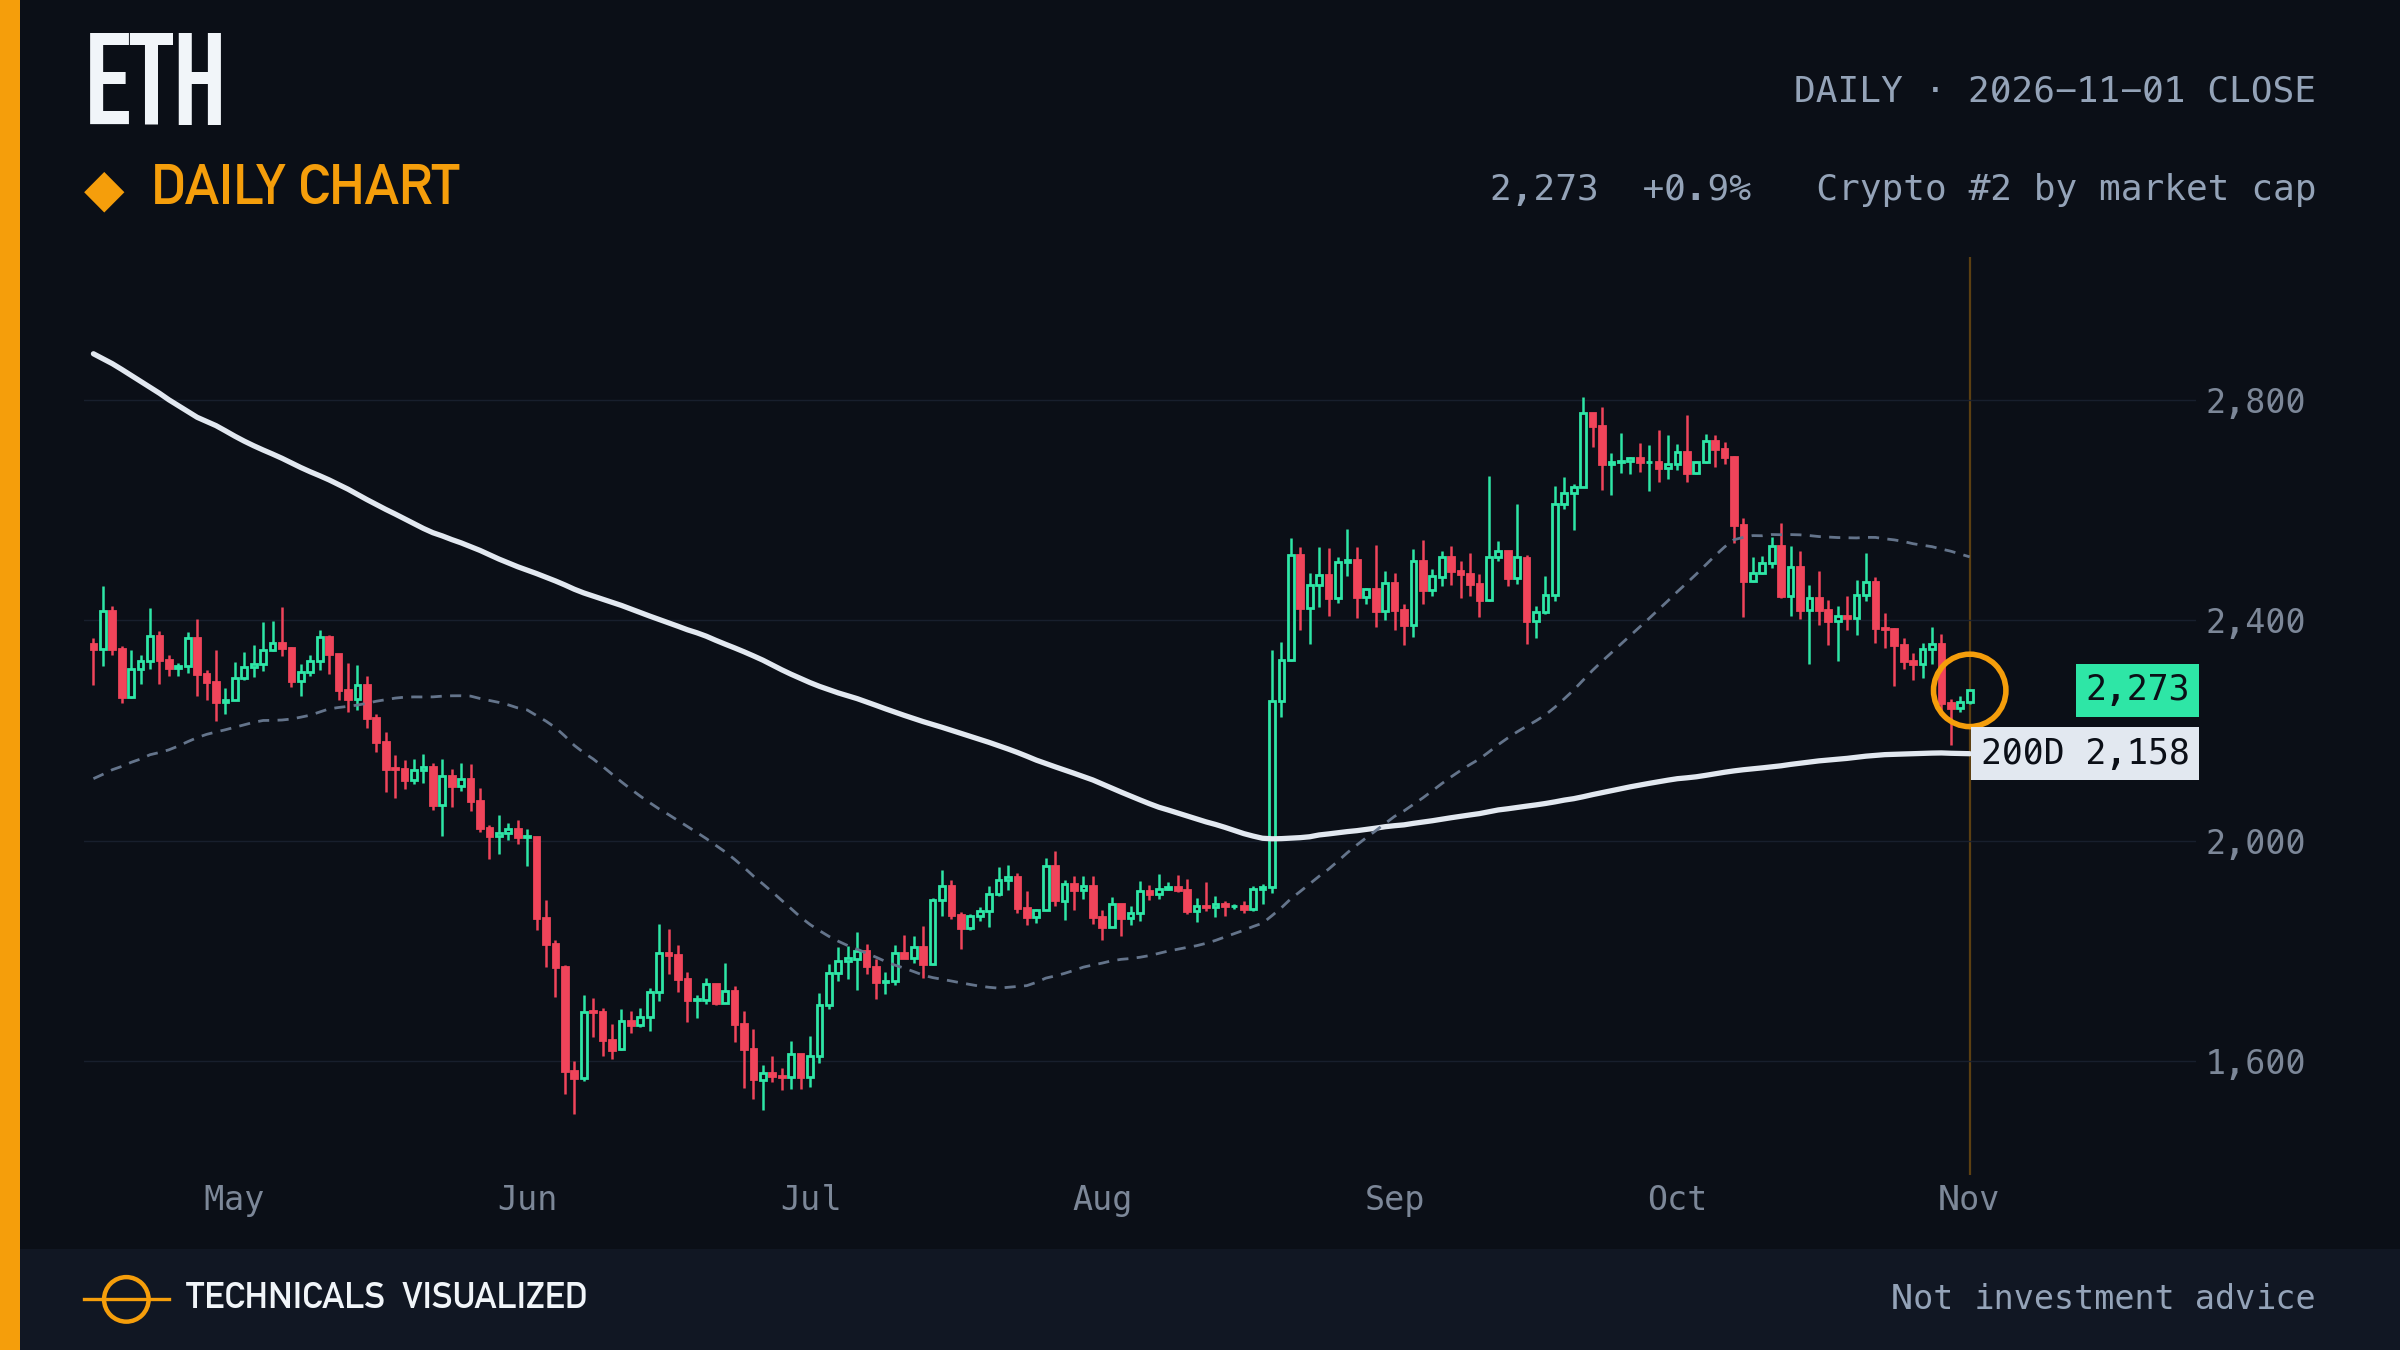
Ethereum closed at $2,273, +0.9% on the day, 5.3% above its 200-day average.
Shown in every edition, whether or not it printed a reading. The amber ring marks this close.
|
|
03 · Solana (SOL) · Exhaustion count (weekly)
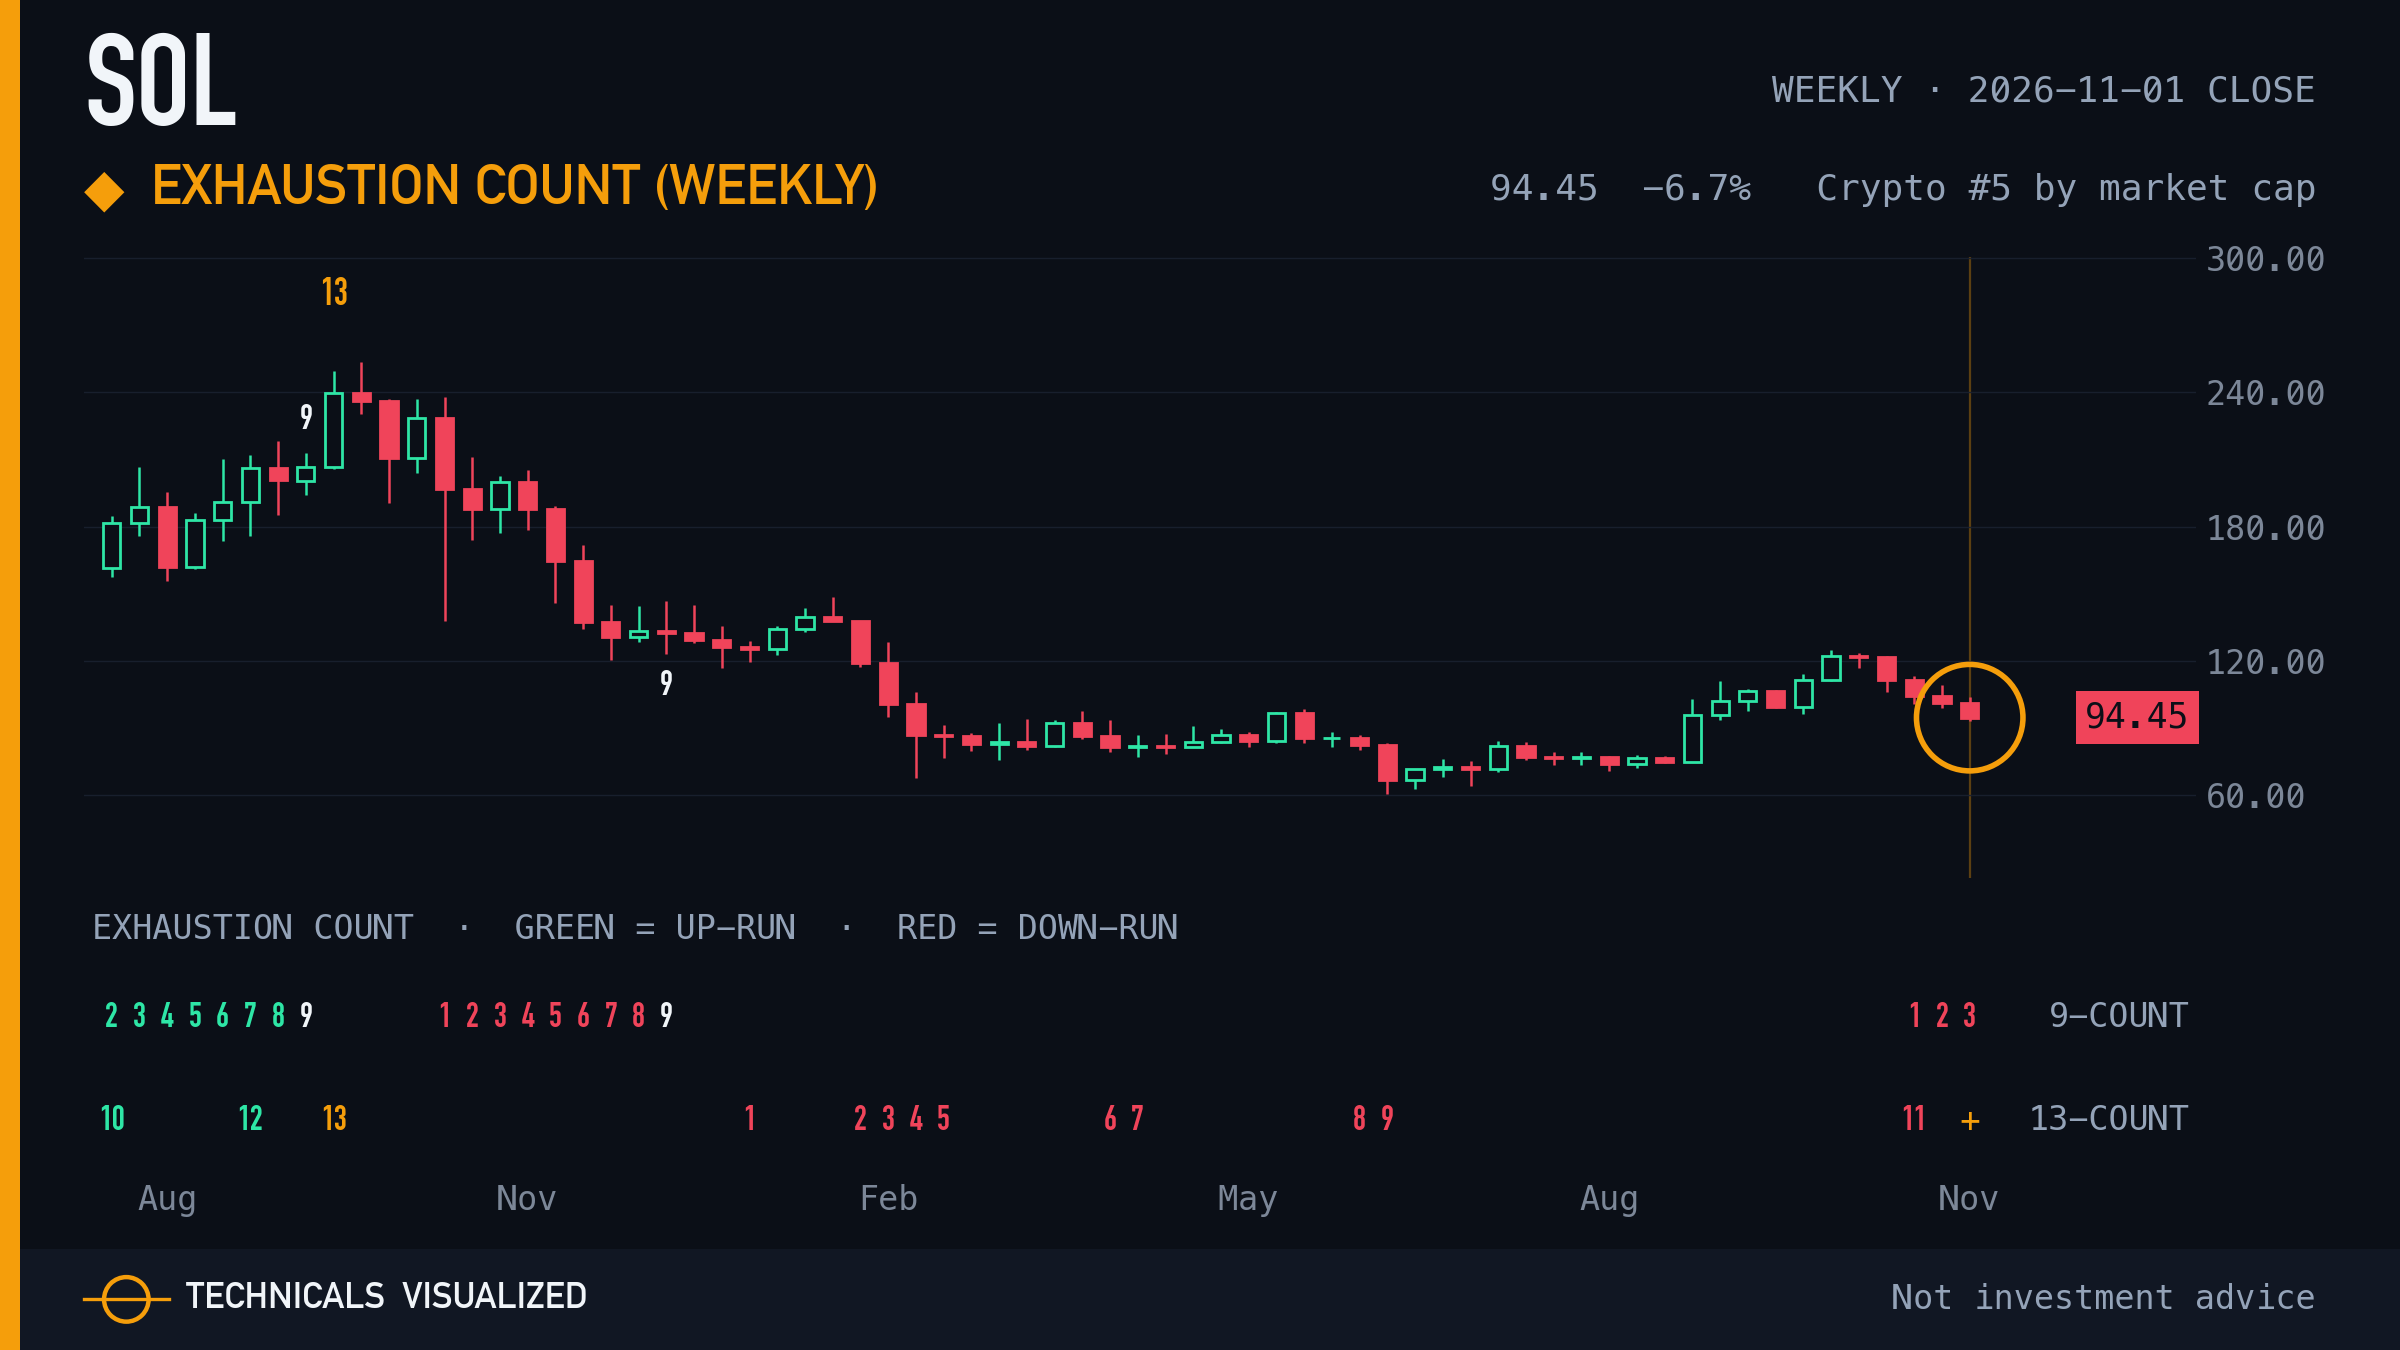
Solana weekly exhaustion count: 13 reached, final condition pending (downside count).
A completed count marks a stretched move. It is a pause marker, not a turn signal.
|
Weekly structureThe latest confirmed weekly swing high and swing low, and where the week closed against them. 10 of 131 crypto assets closed the week within a tenth of a weekly range of a swing level; the 2 most traded are shown. |
|
04 · Bitcoin (BTC) · Weekly close between swing levels
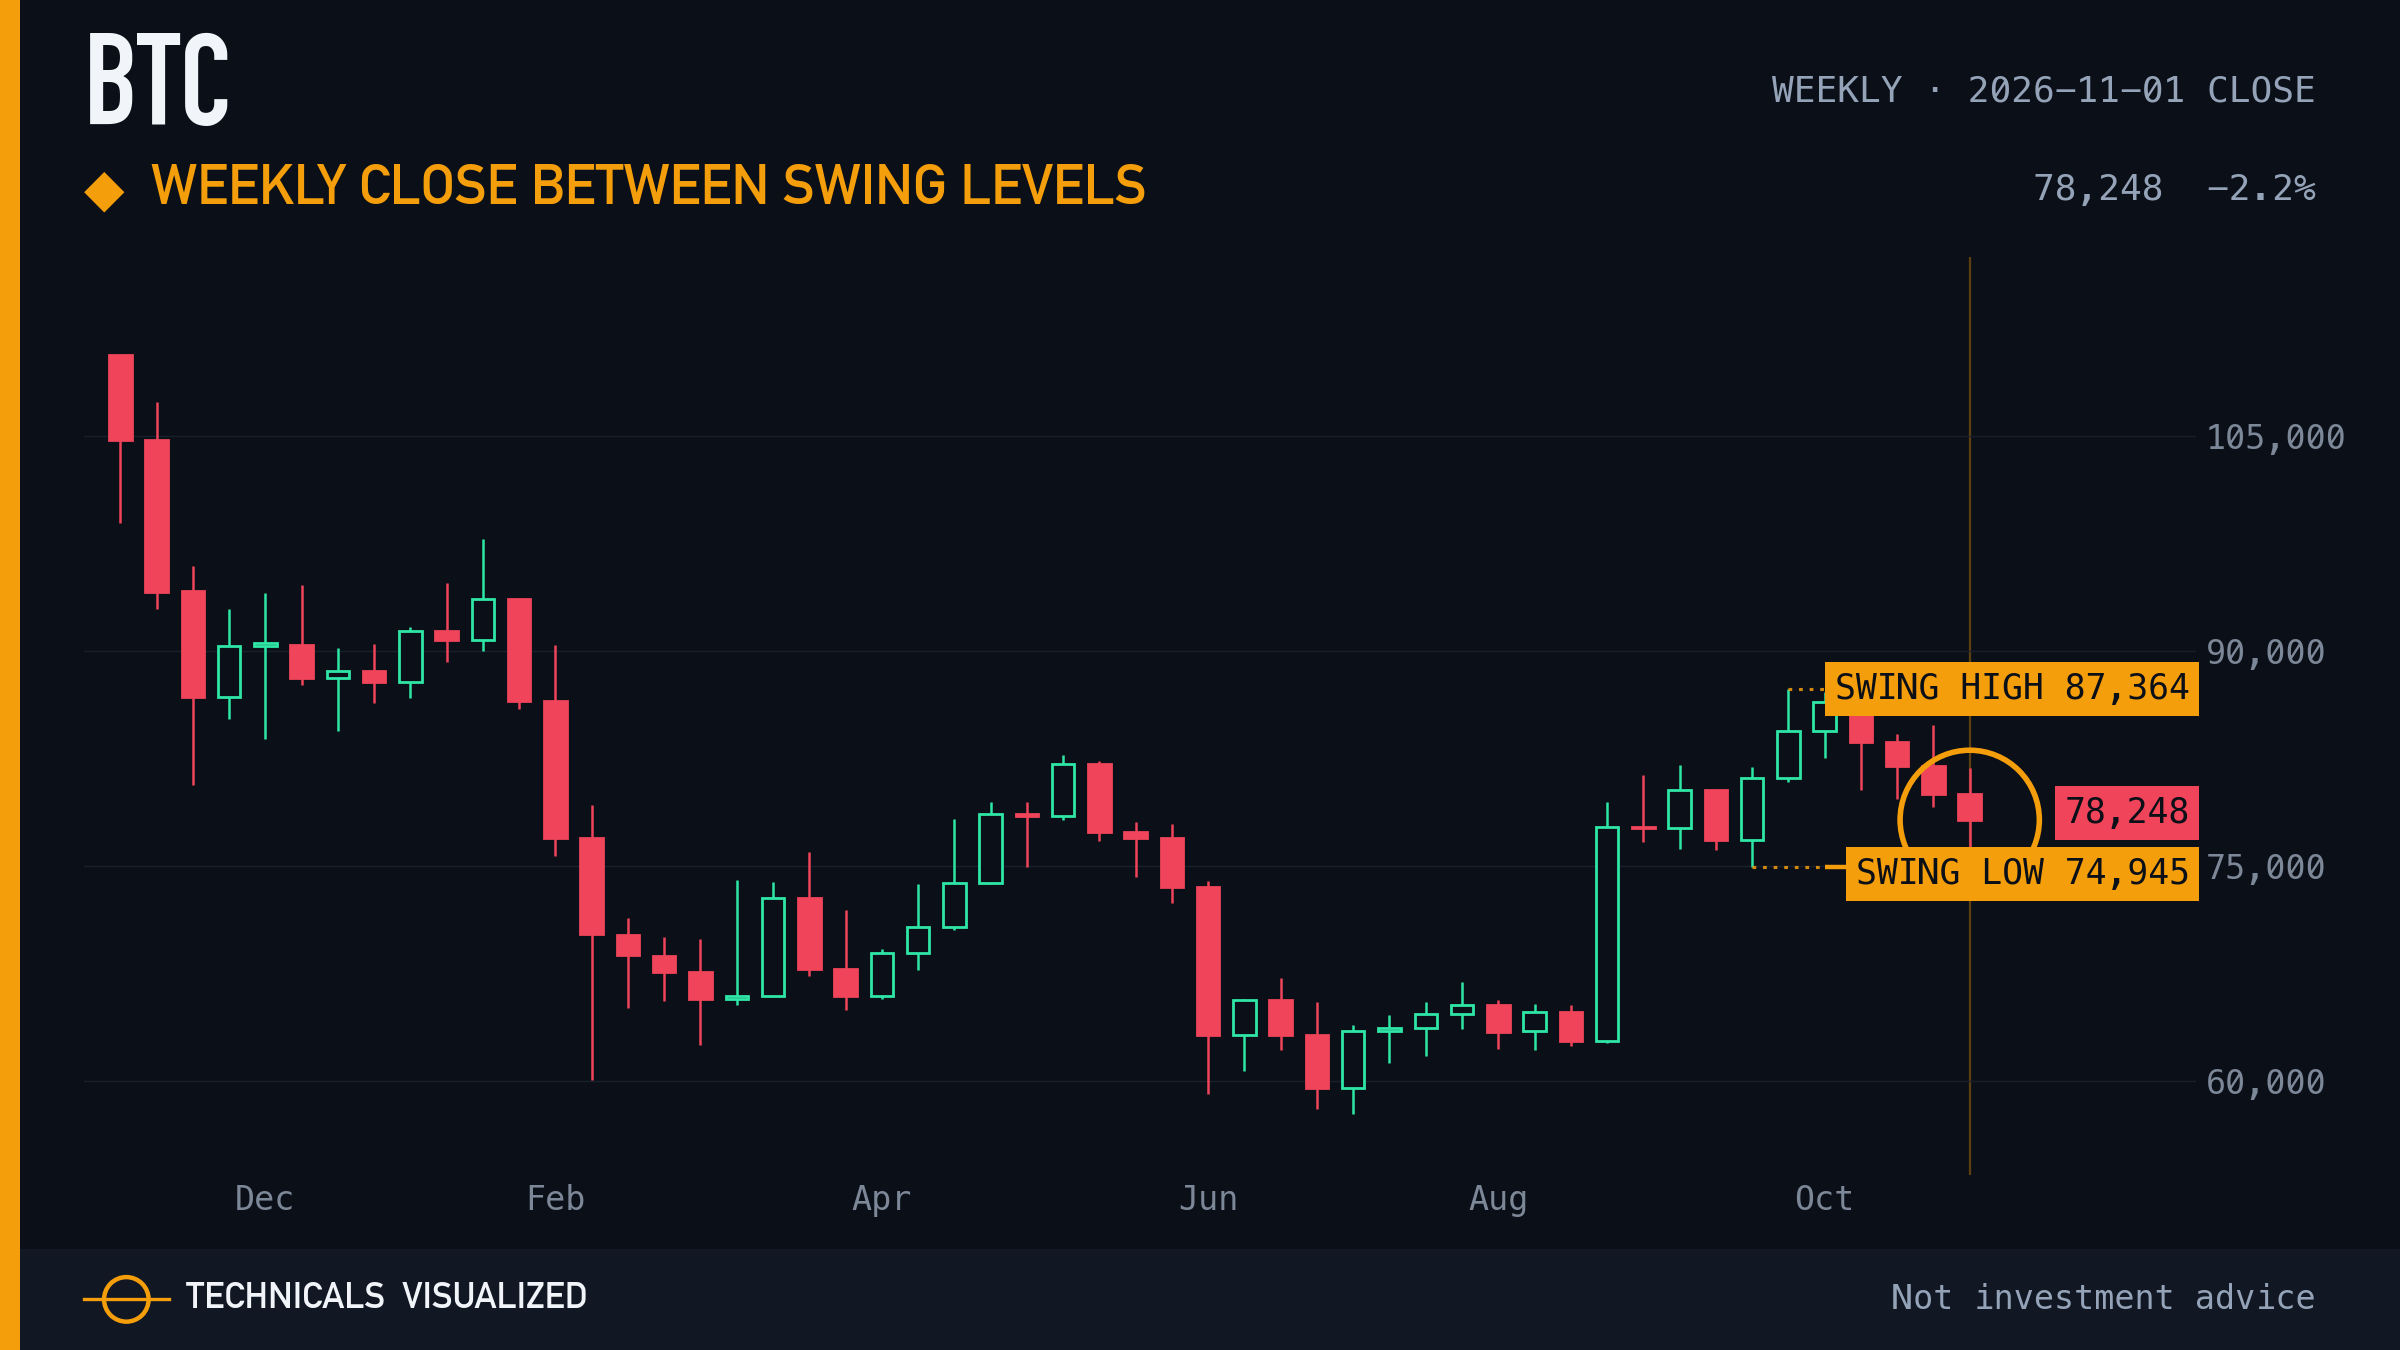
Bitcoin closed the week ending Nov 1, 2026 at $78,248: 10.4% below its weekly swing high of $87,364 (week of Sep 27) and 4.4% above its weekly swing low of $74,945 (week of Sep 20).
Weekly swing lows have risen 2 times in a row since the $57,748 low in the week of Jul 5. The last weekly close above the swing high standing at the time was the week of Oct 4. The last weekly close below the swing low standing at the time was the week of Jun 7. Each line starts the week its swing was confirmed, two weeks after the swing.
|
|
05 · XRP · Weekly close below swing low
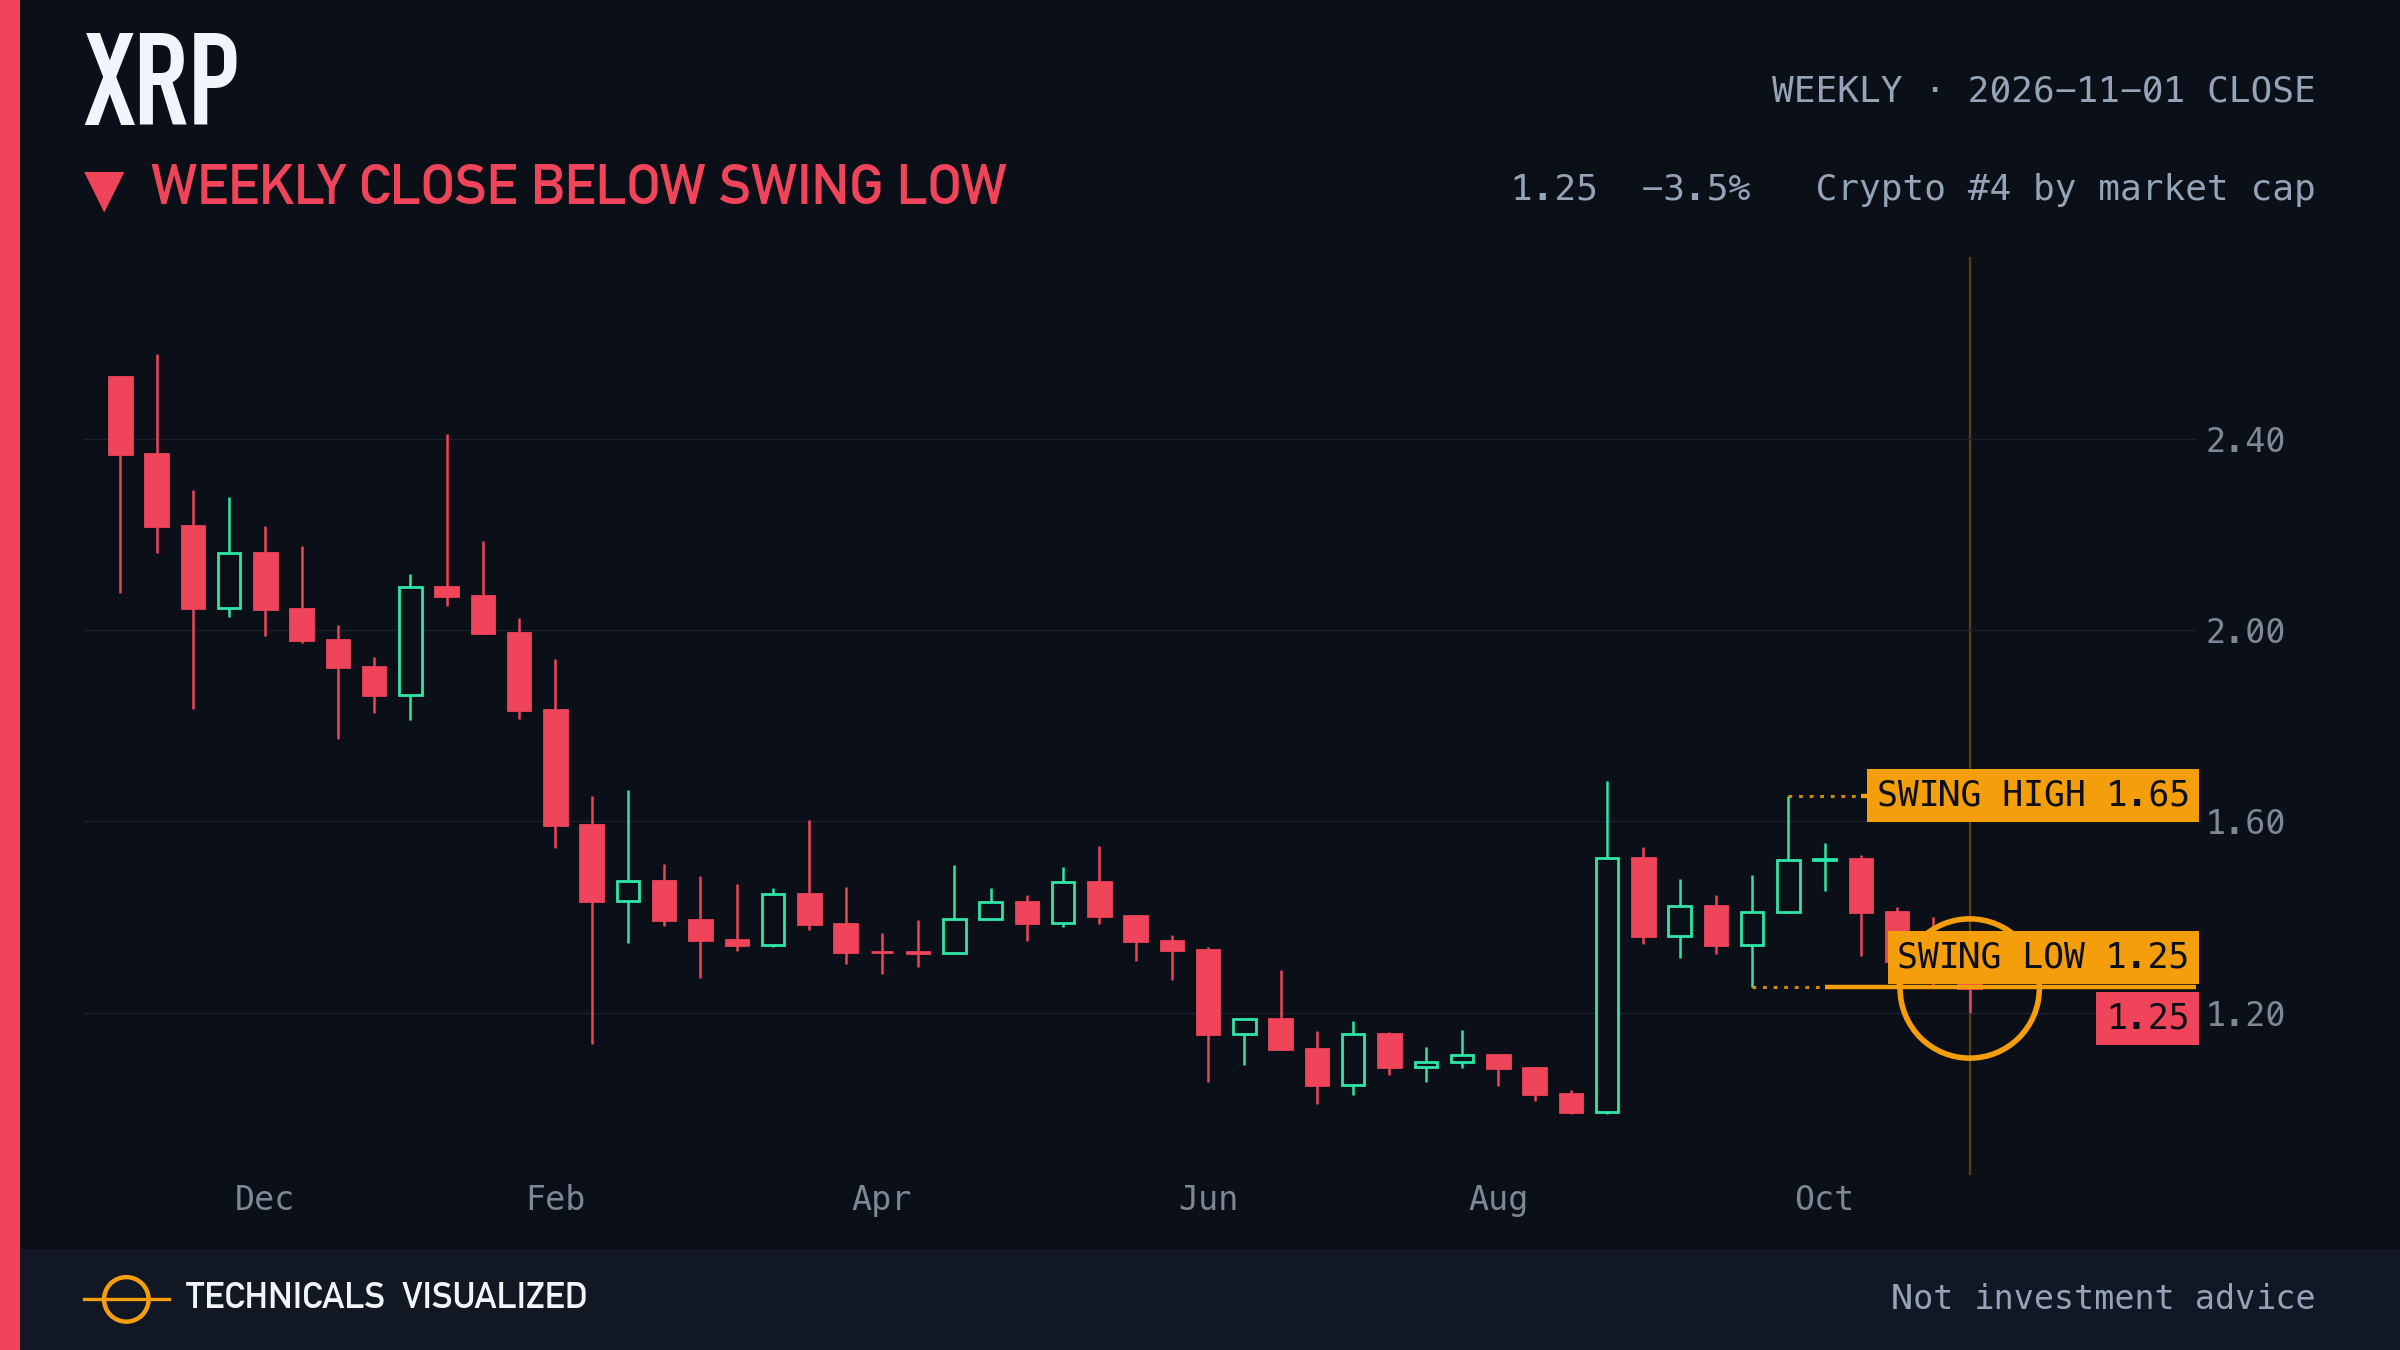
XRP closed the week ending Nov 1, 2026 at $1.25: 24.4% below its weekly swing high of $1.65 (week of Sep 27) and 0.2% below its weekly swing low of $1.25 (week of Sep 20).
The latest weekly swing low is higher than the one before it, the $0.9884 low in the week of Aug 16. This week closed below the standing swing low; the previous weekly close below one was the week of Aug 16. Each line starts the week its swing was confirmed, two weeks after the swing.
|
|
06 · Cardano (ADA) · Weekly close between swing levels
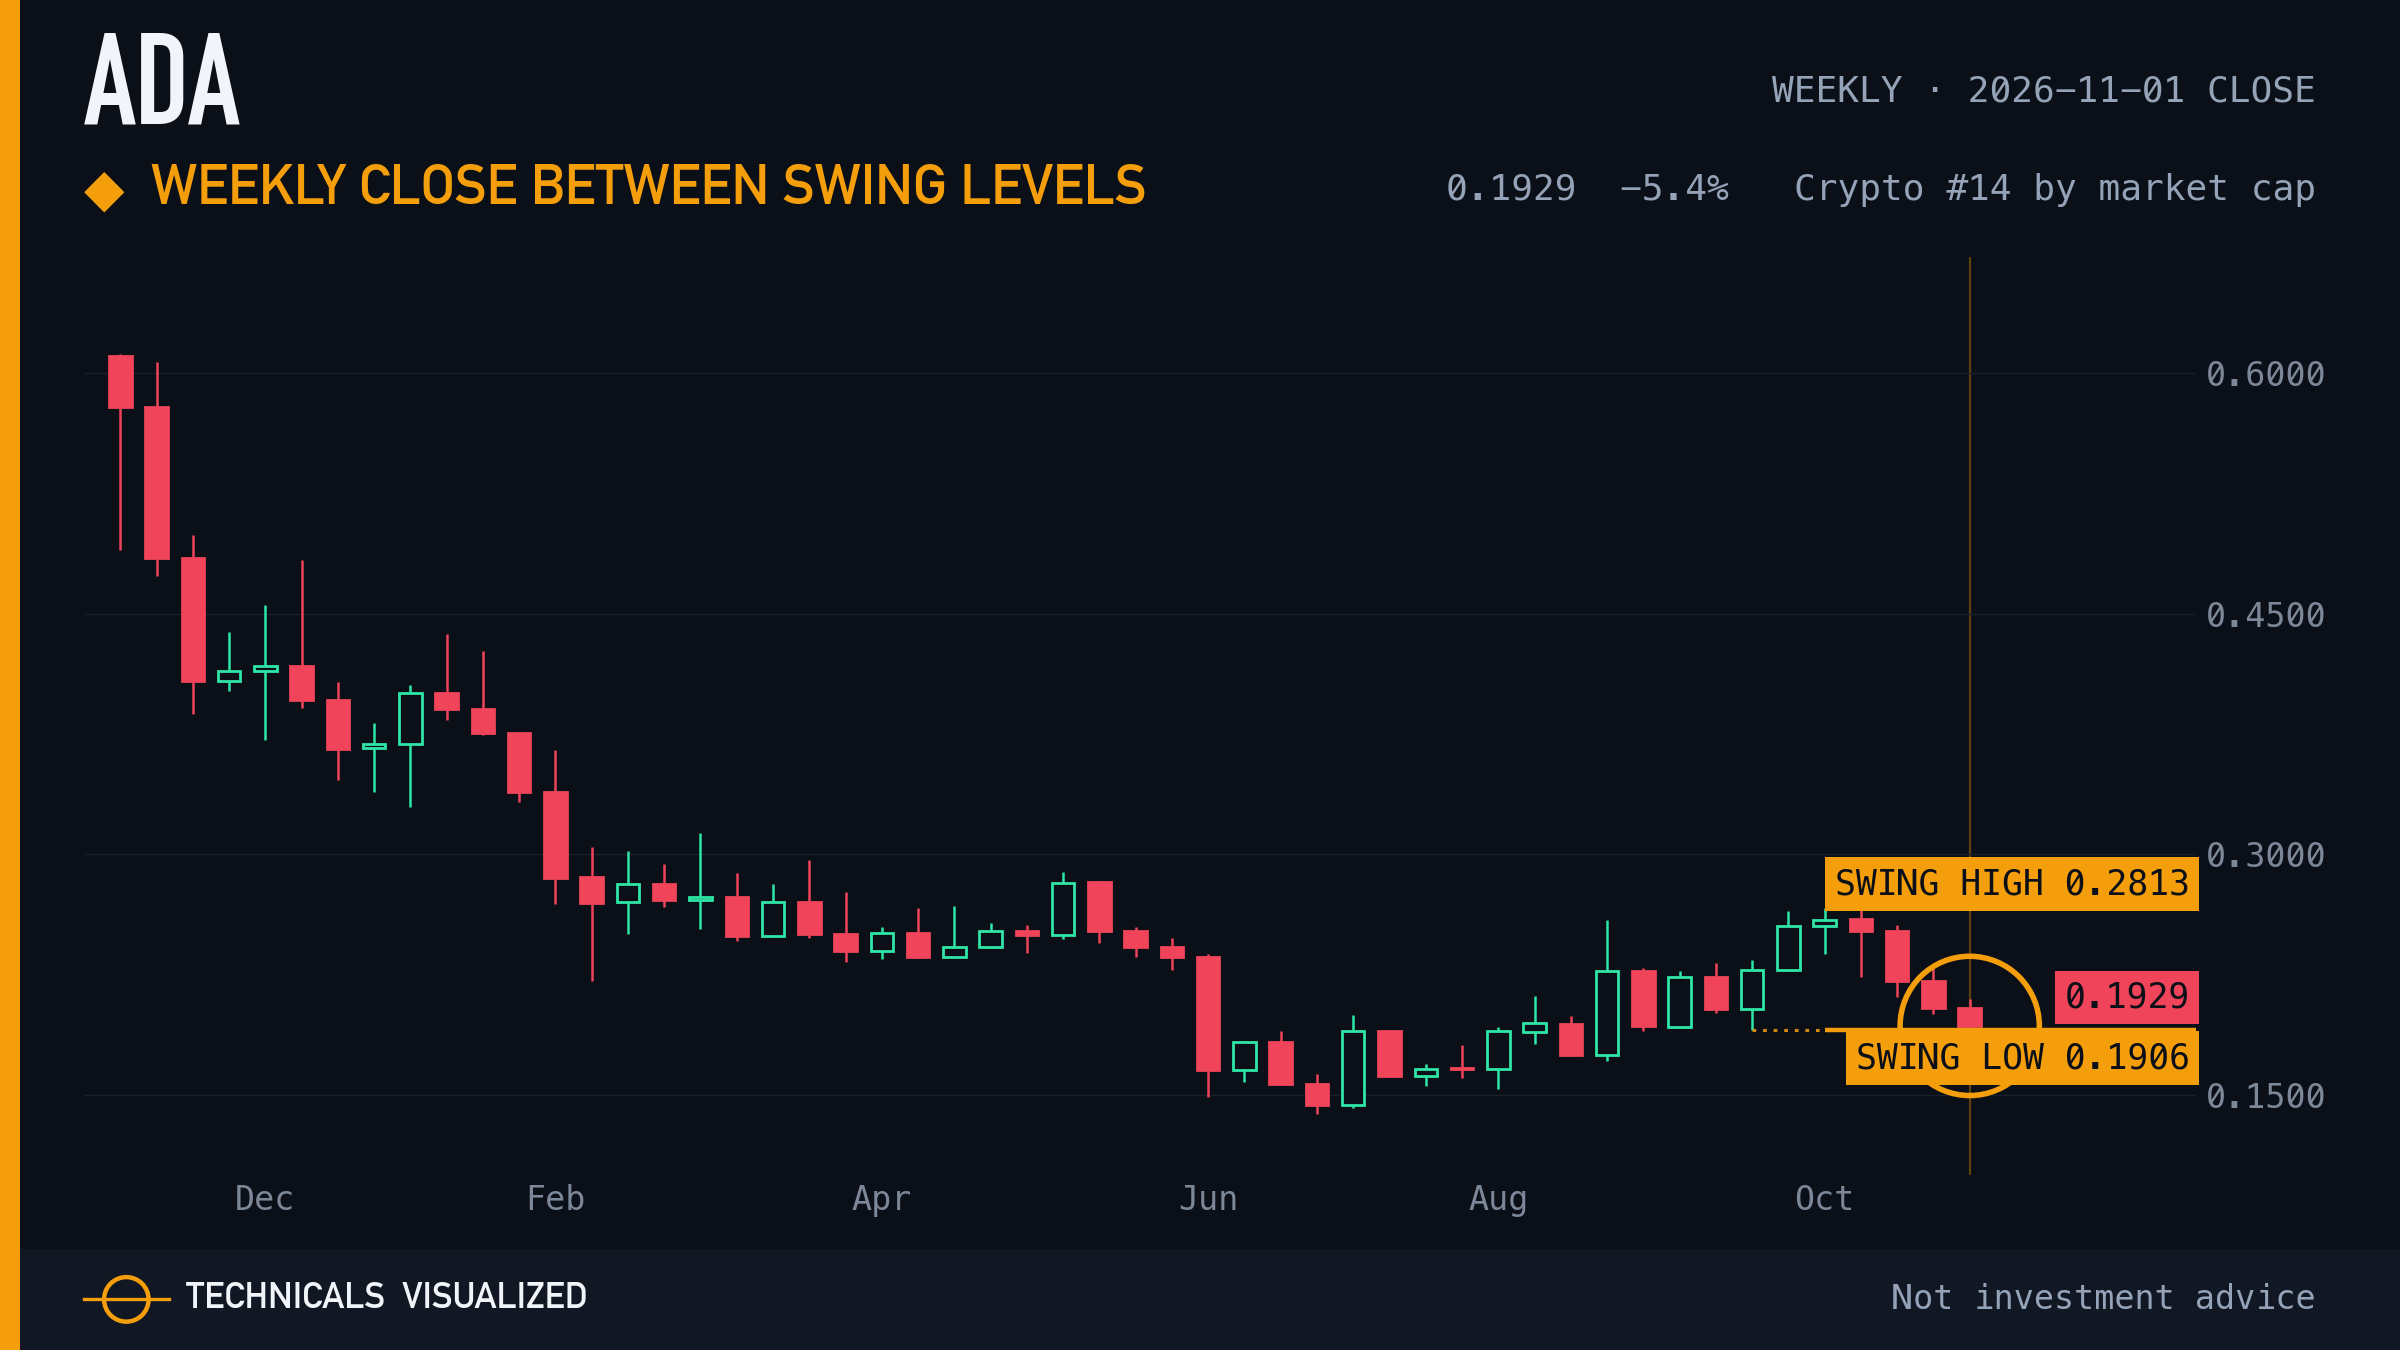
Cardano closed the week ending Nov 1, 2026 at $0.1929: 31.4% below its weekly swing high of $0.2813 (week of Oct 11) and 1.2% above its weekly swing low of $0.1906 (week of Sep 20).
Weekly swing lows have risen 3 times in a row since the $0.1382 low in the week of Jun 28. The last weekly close above the swing high standing at the time was the week of Oct 4. The last weekly close below the swing low standing at the time was the week of Jun 28. Each line starts the week its swing was confirmed, two weeks after the swing.
|
Today's readings |
|
07 · Akedo (AKE) · Lost the 200-day
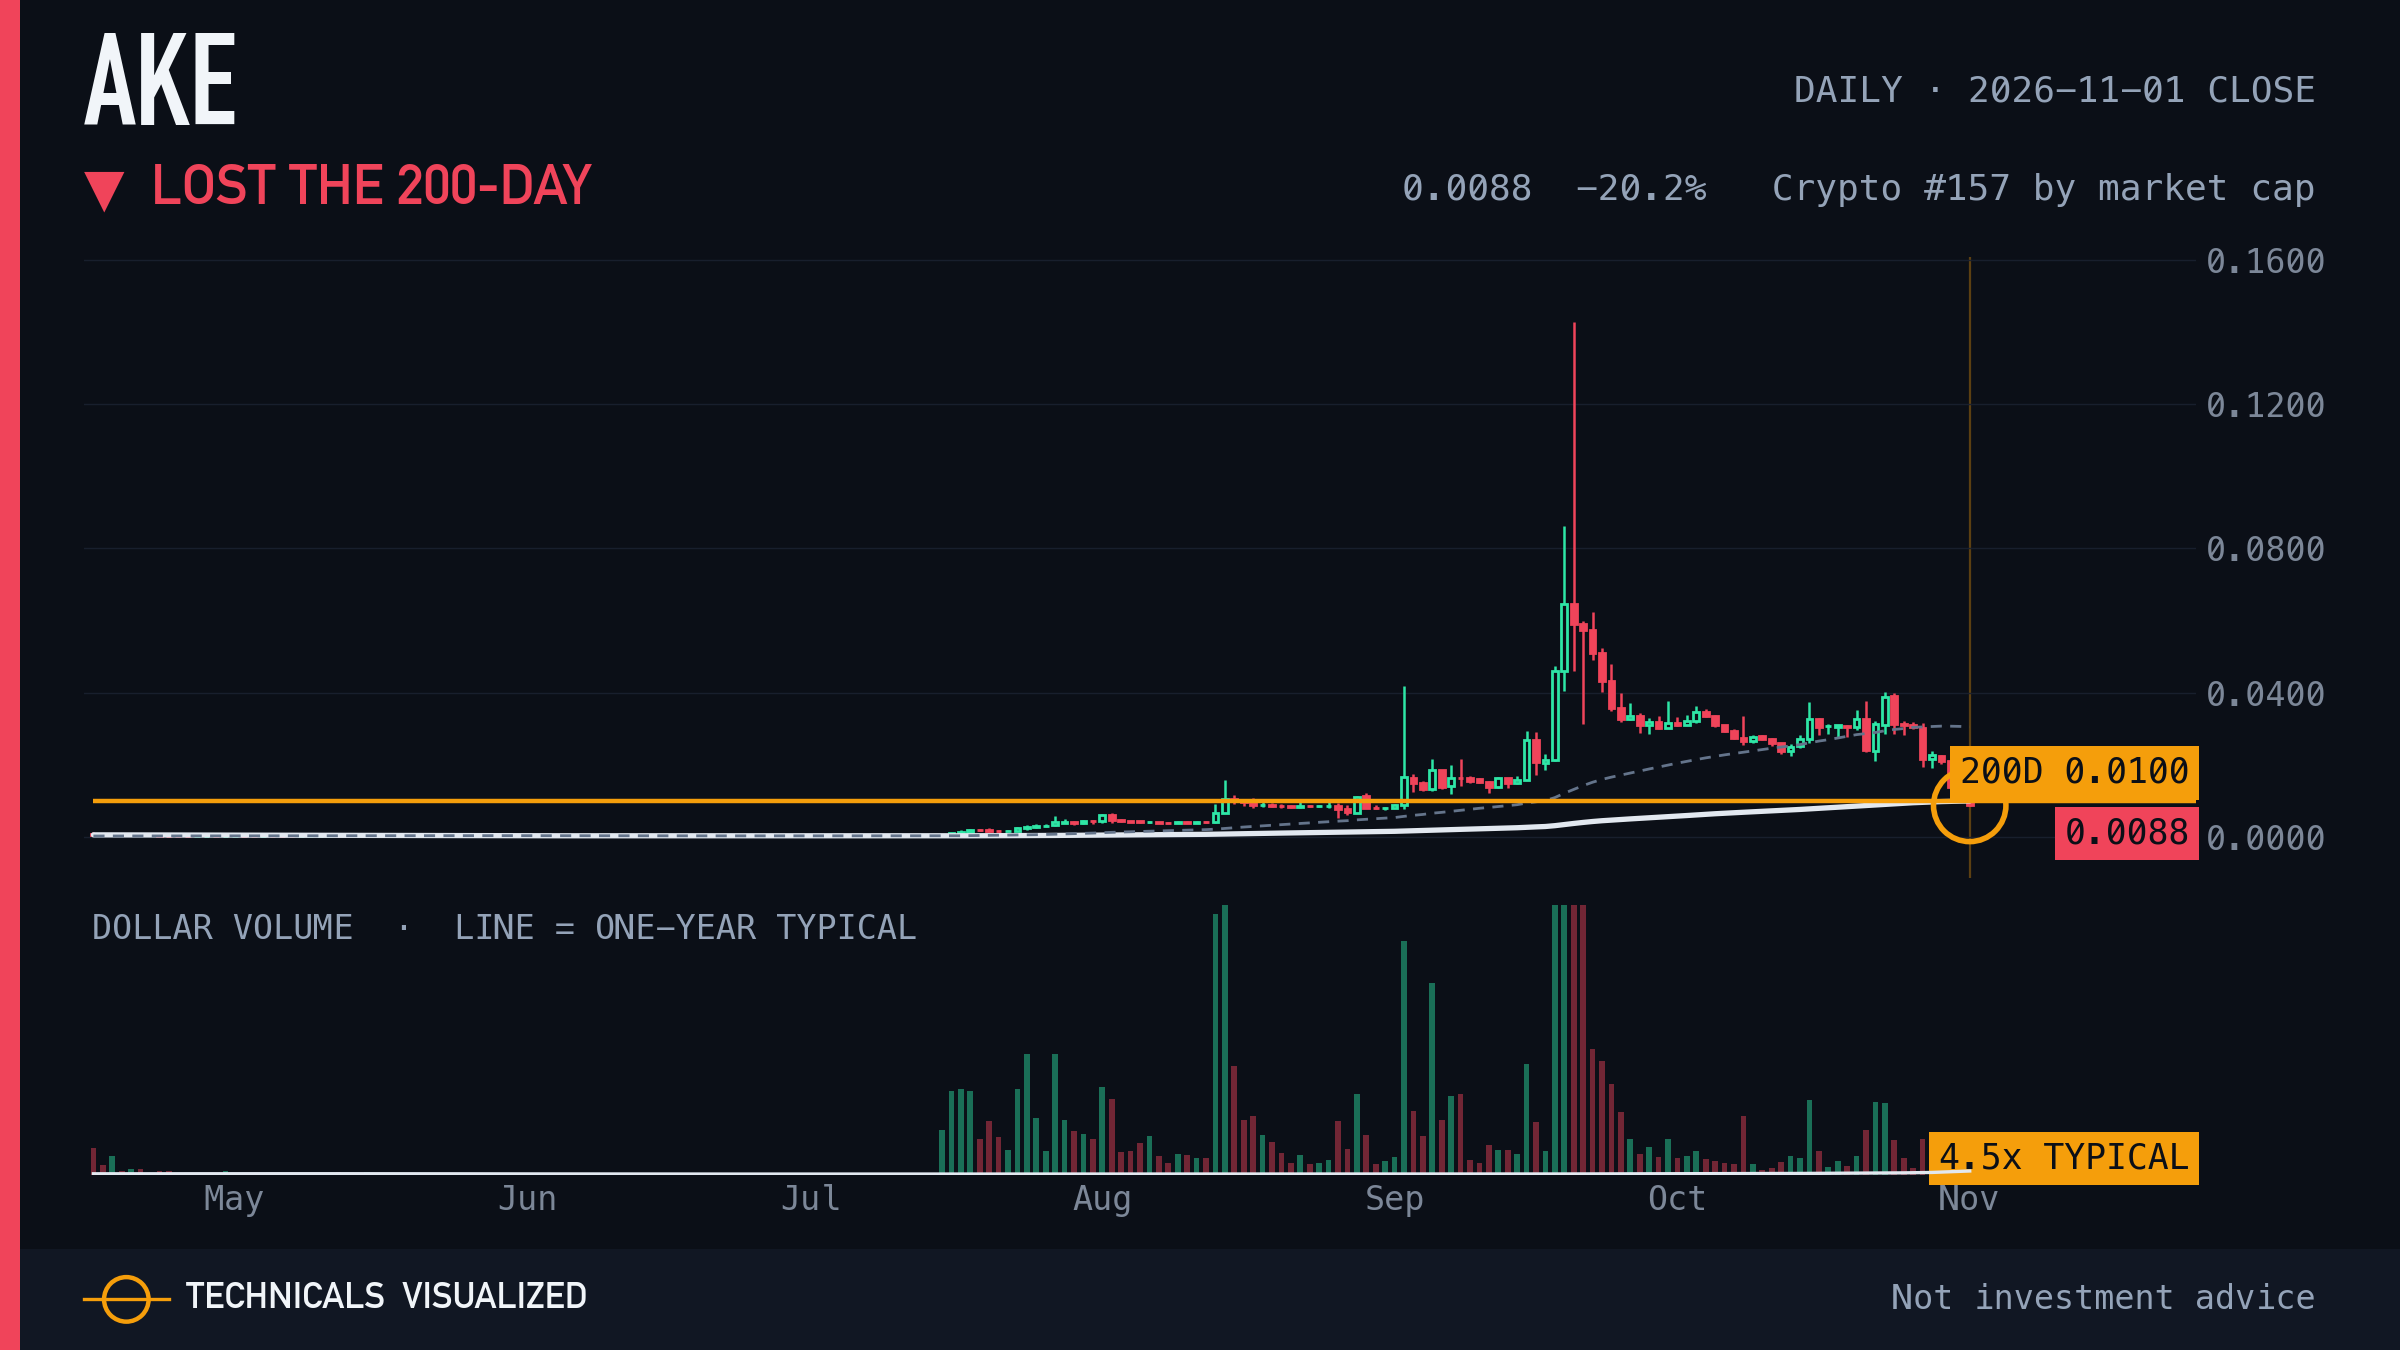
Akedo first close below the 200-day average after closing above it on 50 of the prior 50 sessions.
The 200-day average sits at $0.01. The chart shows the line; it does not say the cross will hold.
|
|
08 · Avalanche (AVAX) · Exhaustion count (weekly)
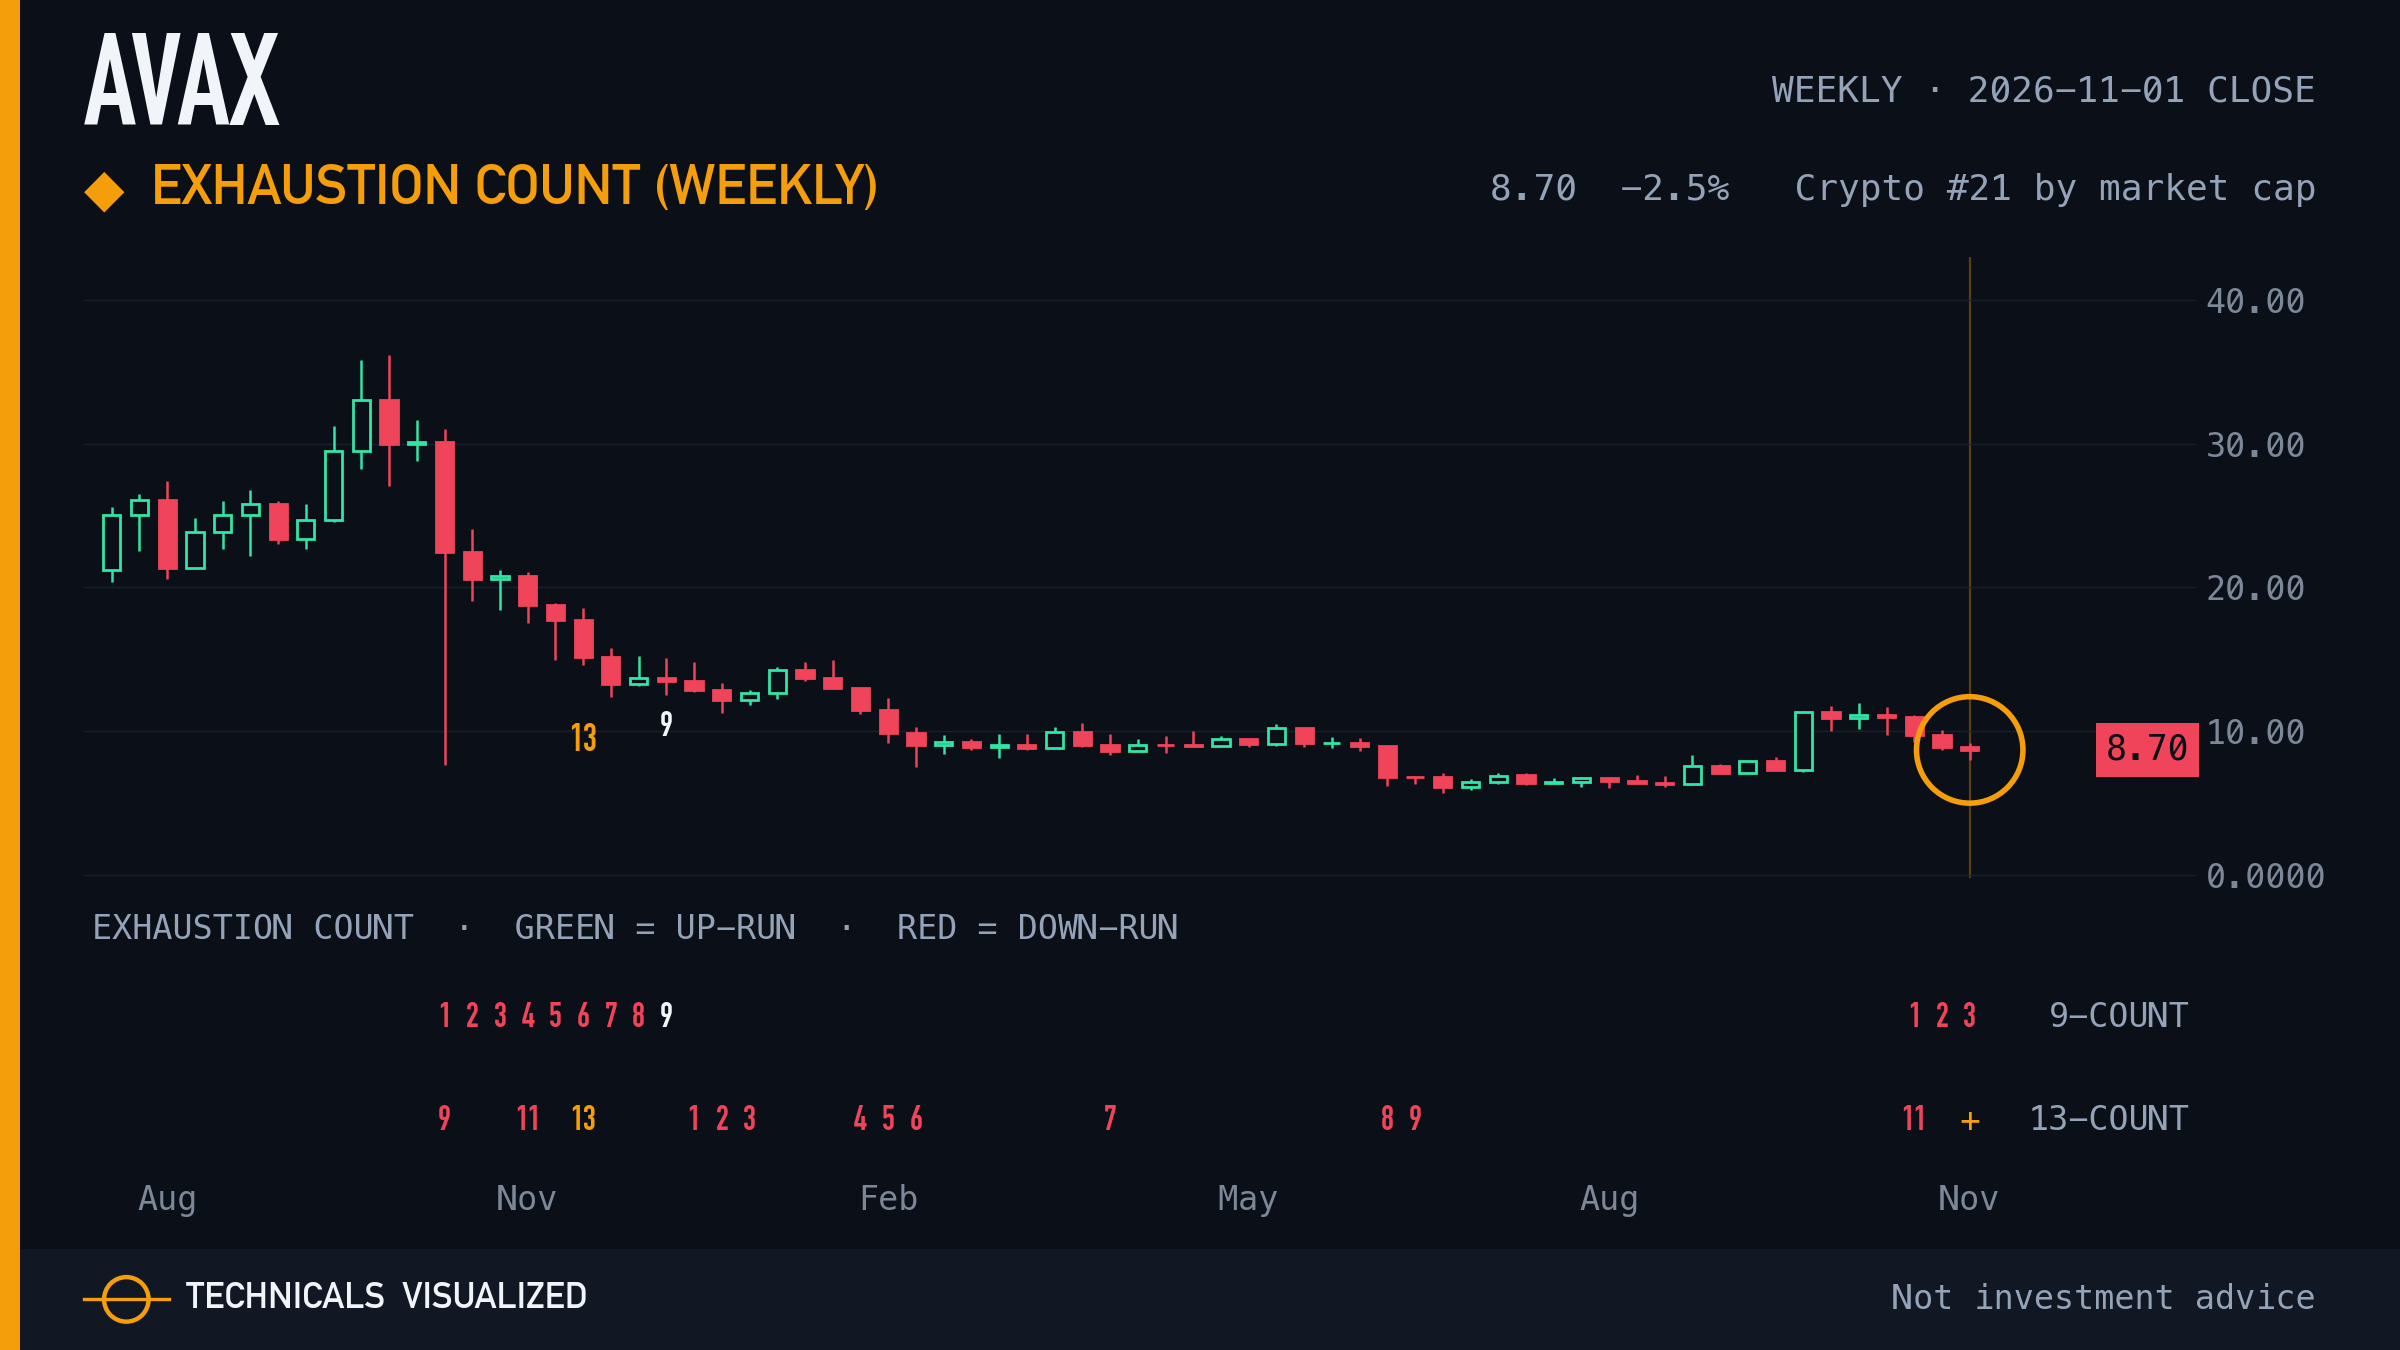
Avalanche weekly exhaustion count: 13 reached, final condition pending (downside count).
A completed count marks a stretched move. It is a pause marker, not a turn signal.
|
|
09 · Starknet (STRK) · Exhaustion count (weekly)
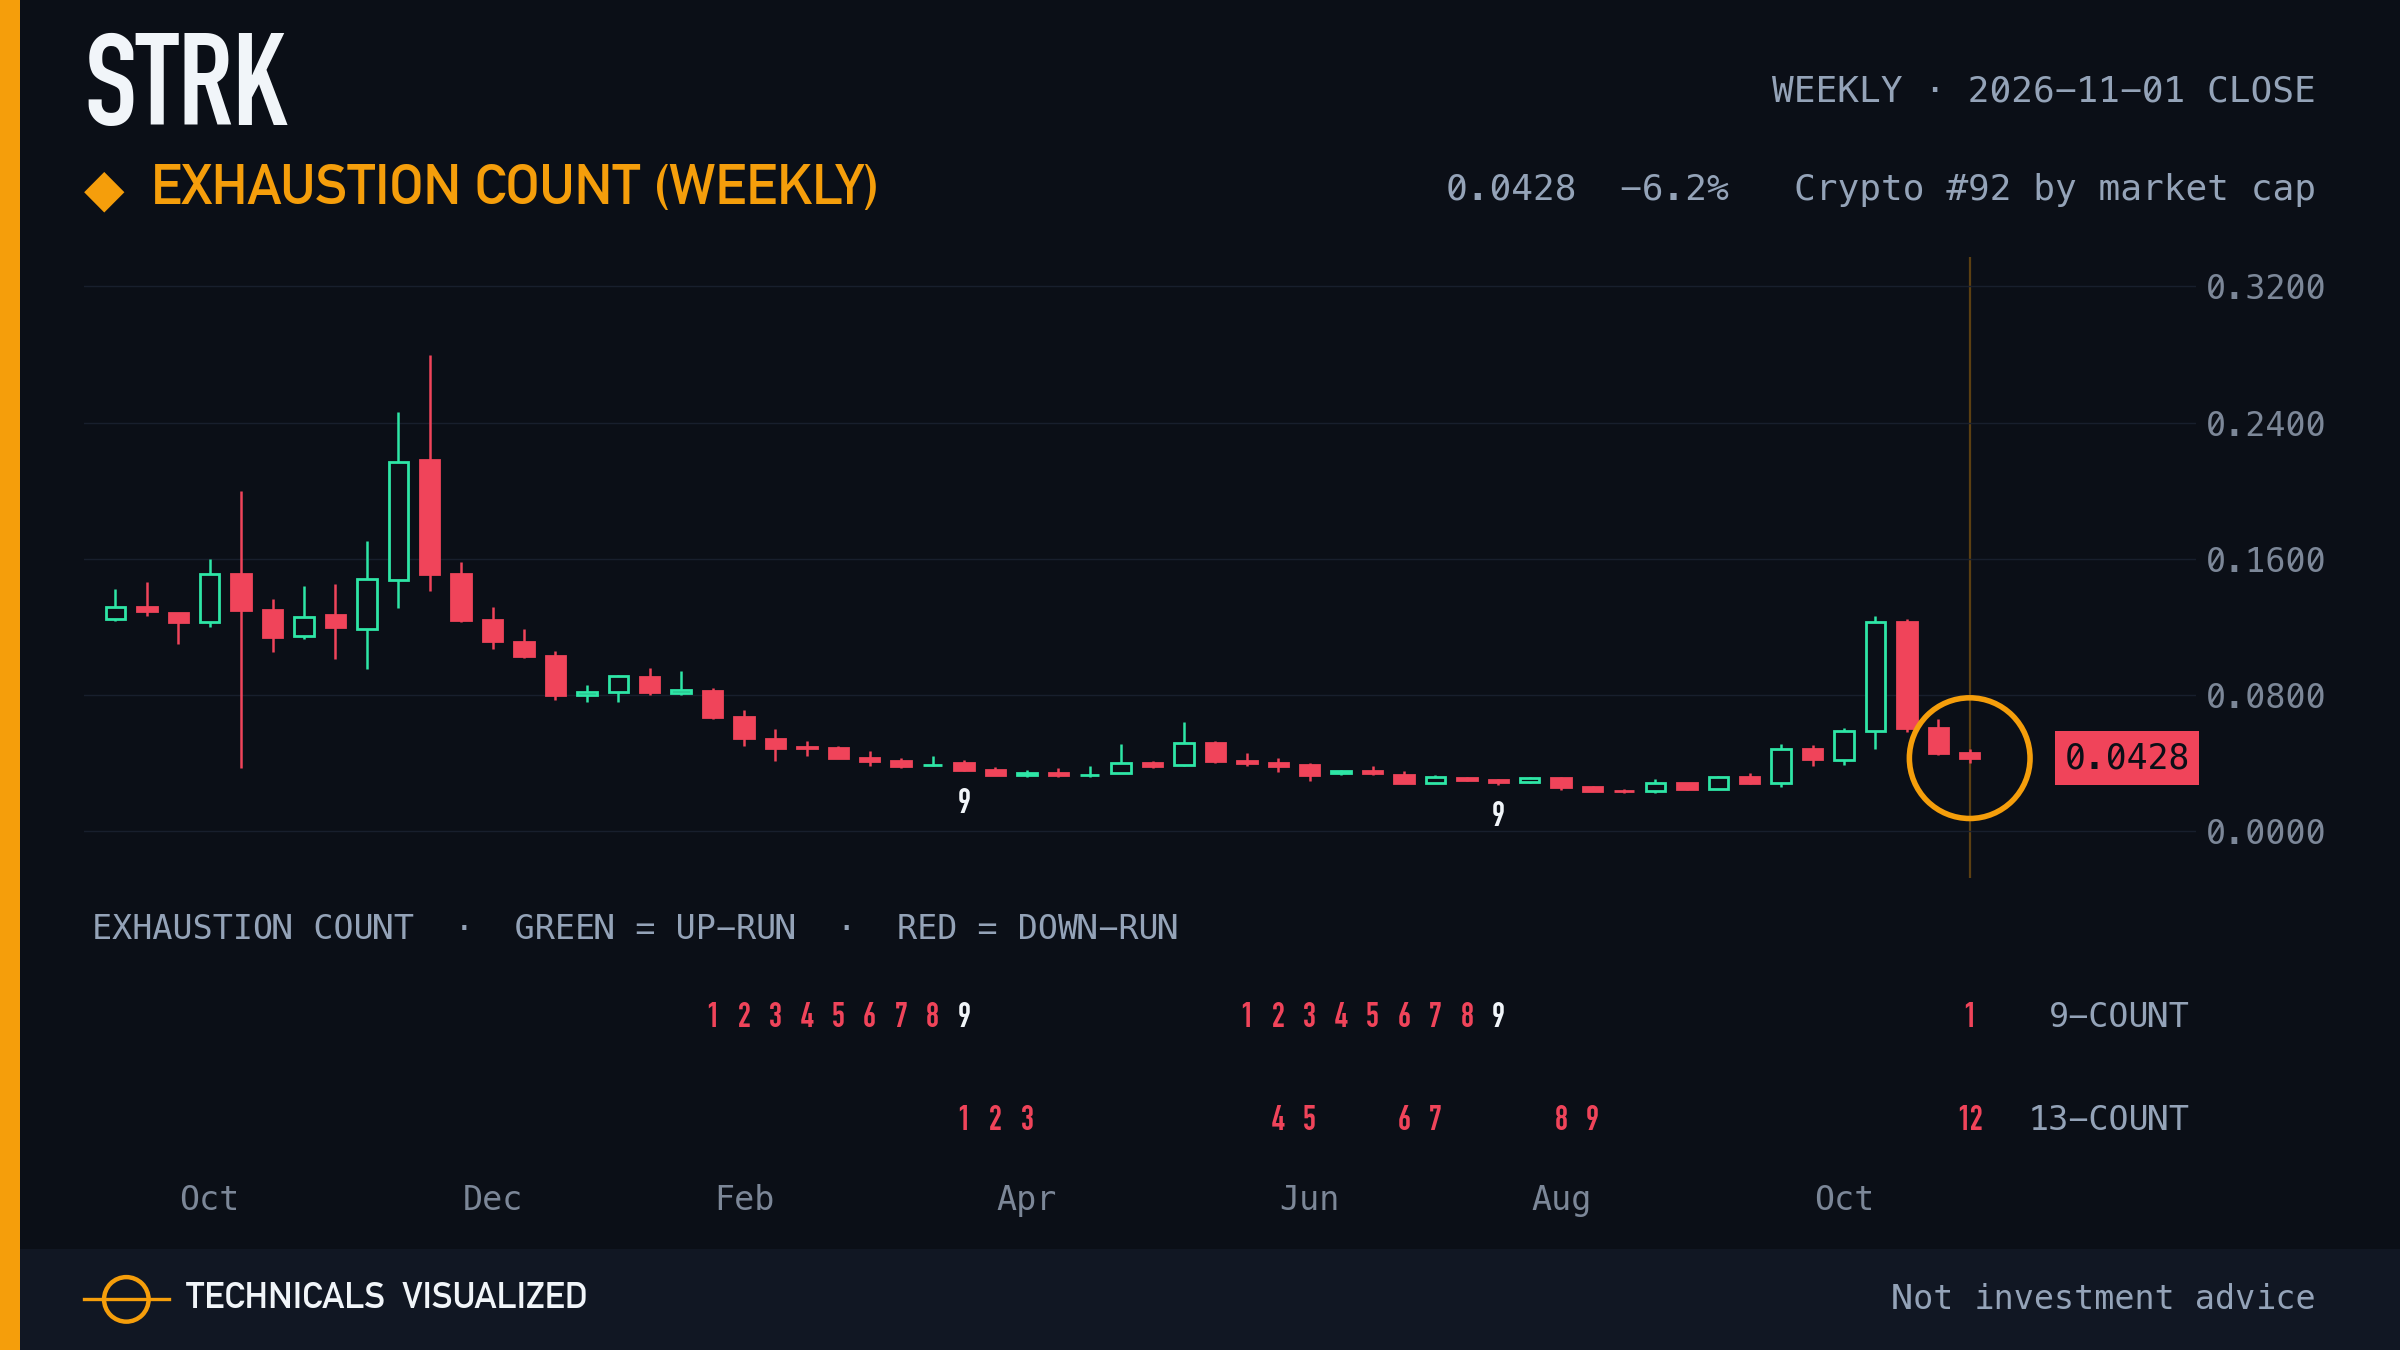
Starknet weekly exhaustion count: count at 12 of 13 (downside count).
One bar short of a completed count. A count marks a stretched move, not a turn signal.
|
|
10 · XDC Network (XDC) · Exhaustion count (weekly)
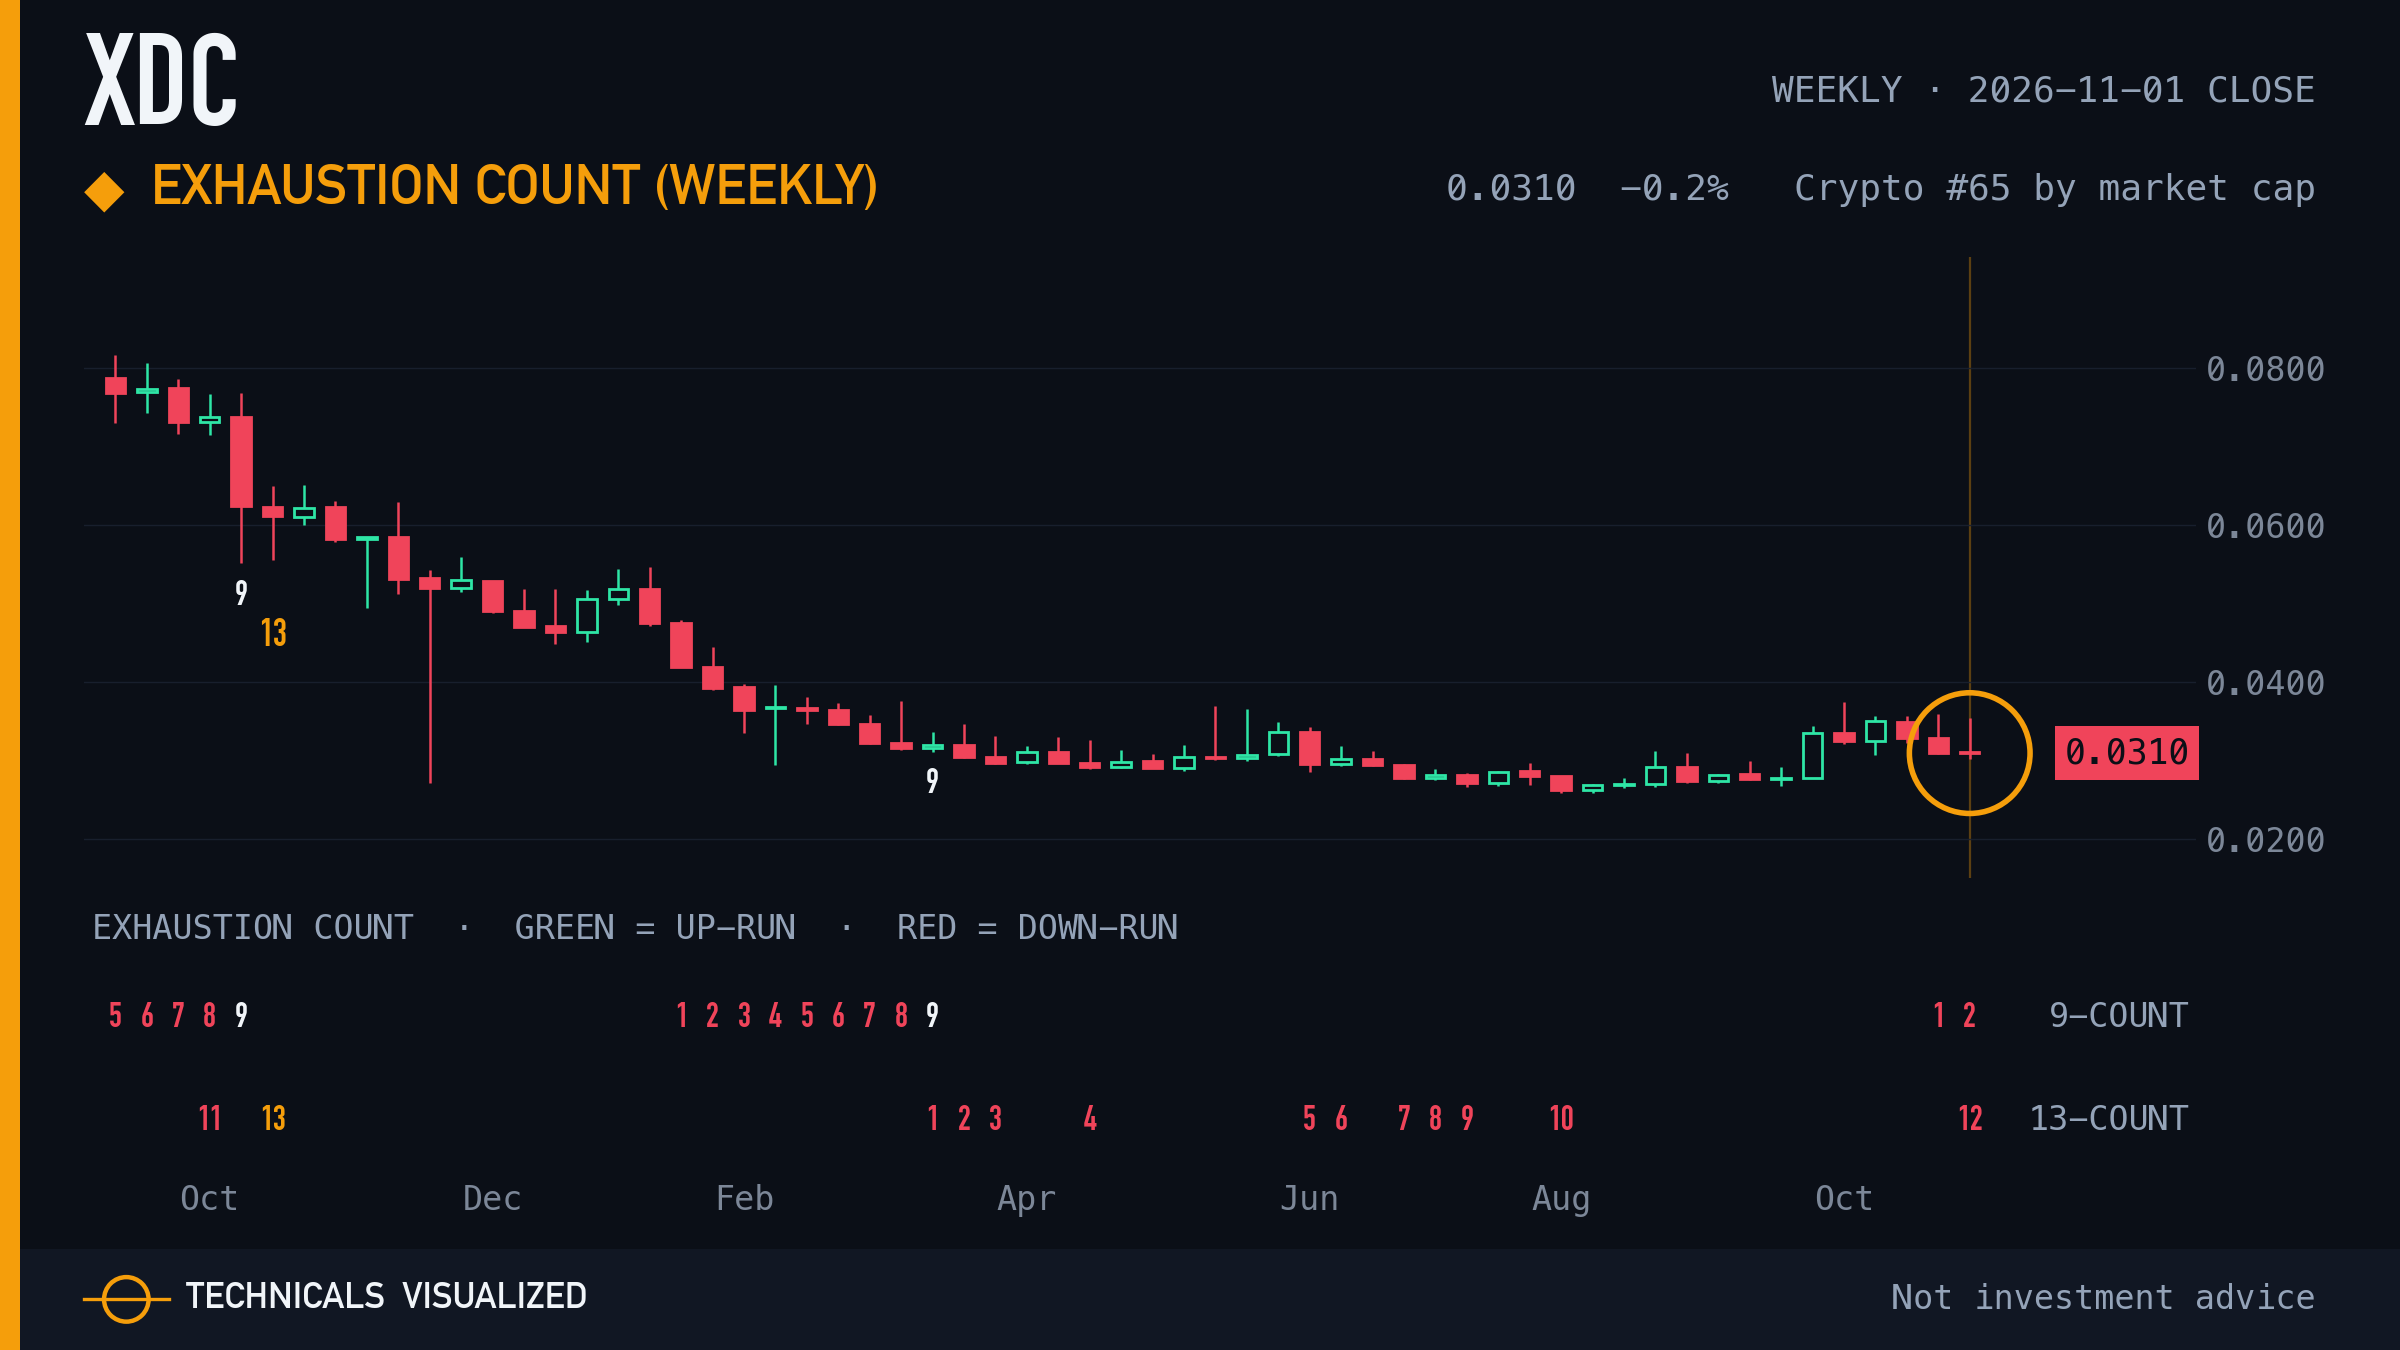
XDC Network weekly exhaustion count: count at 12 of 13 (downside count).
One bar short of a completed count. A count marks a stretched move, not a turn signal.
|
|
11 · World Liberty Financial (WLFI) · Exhaustion count (daily)
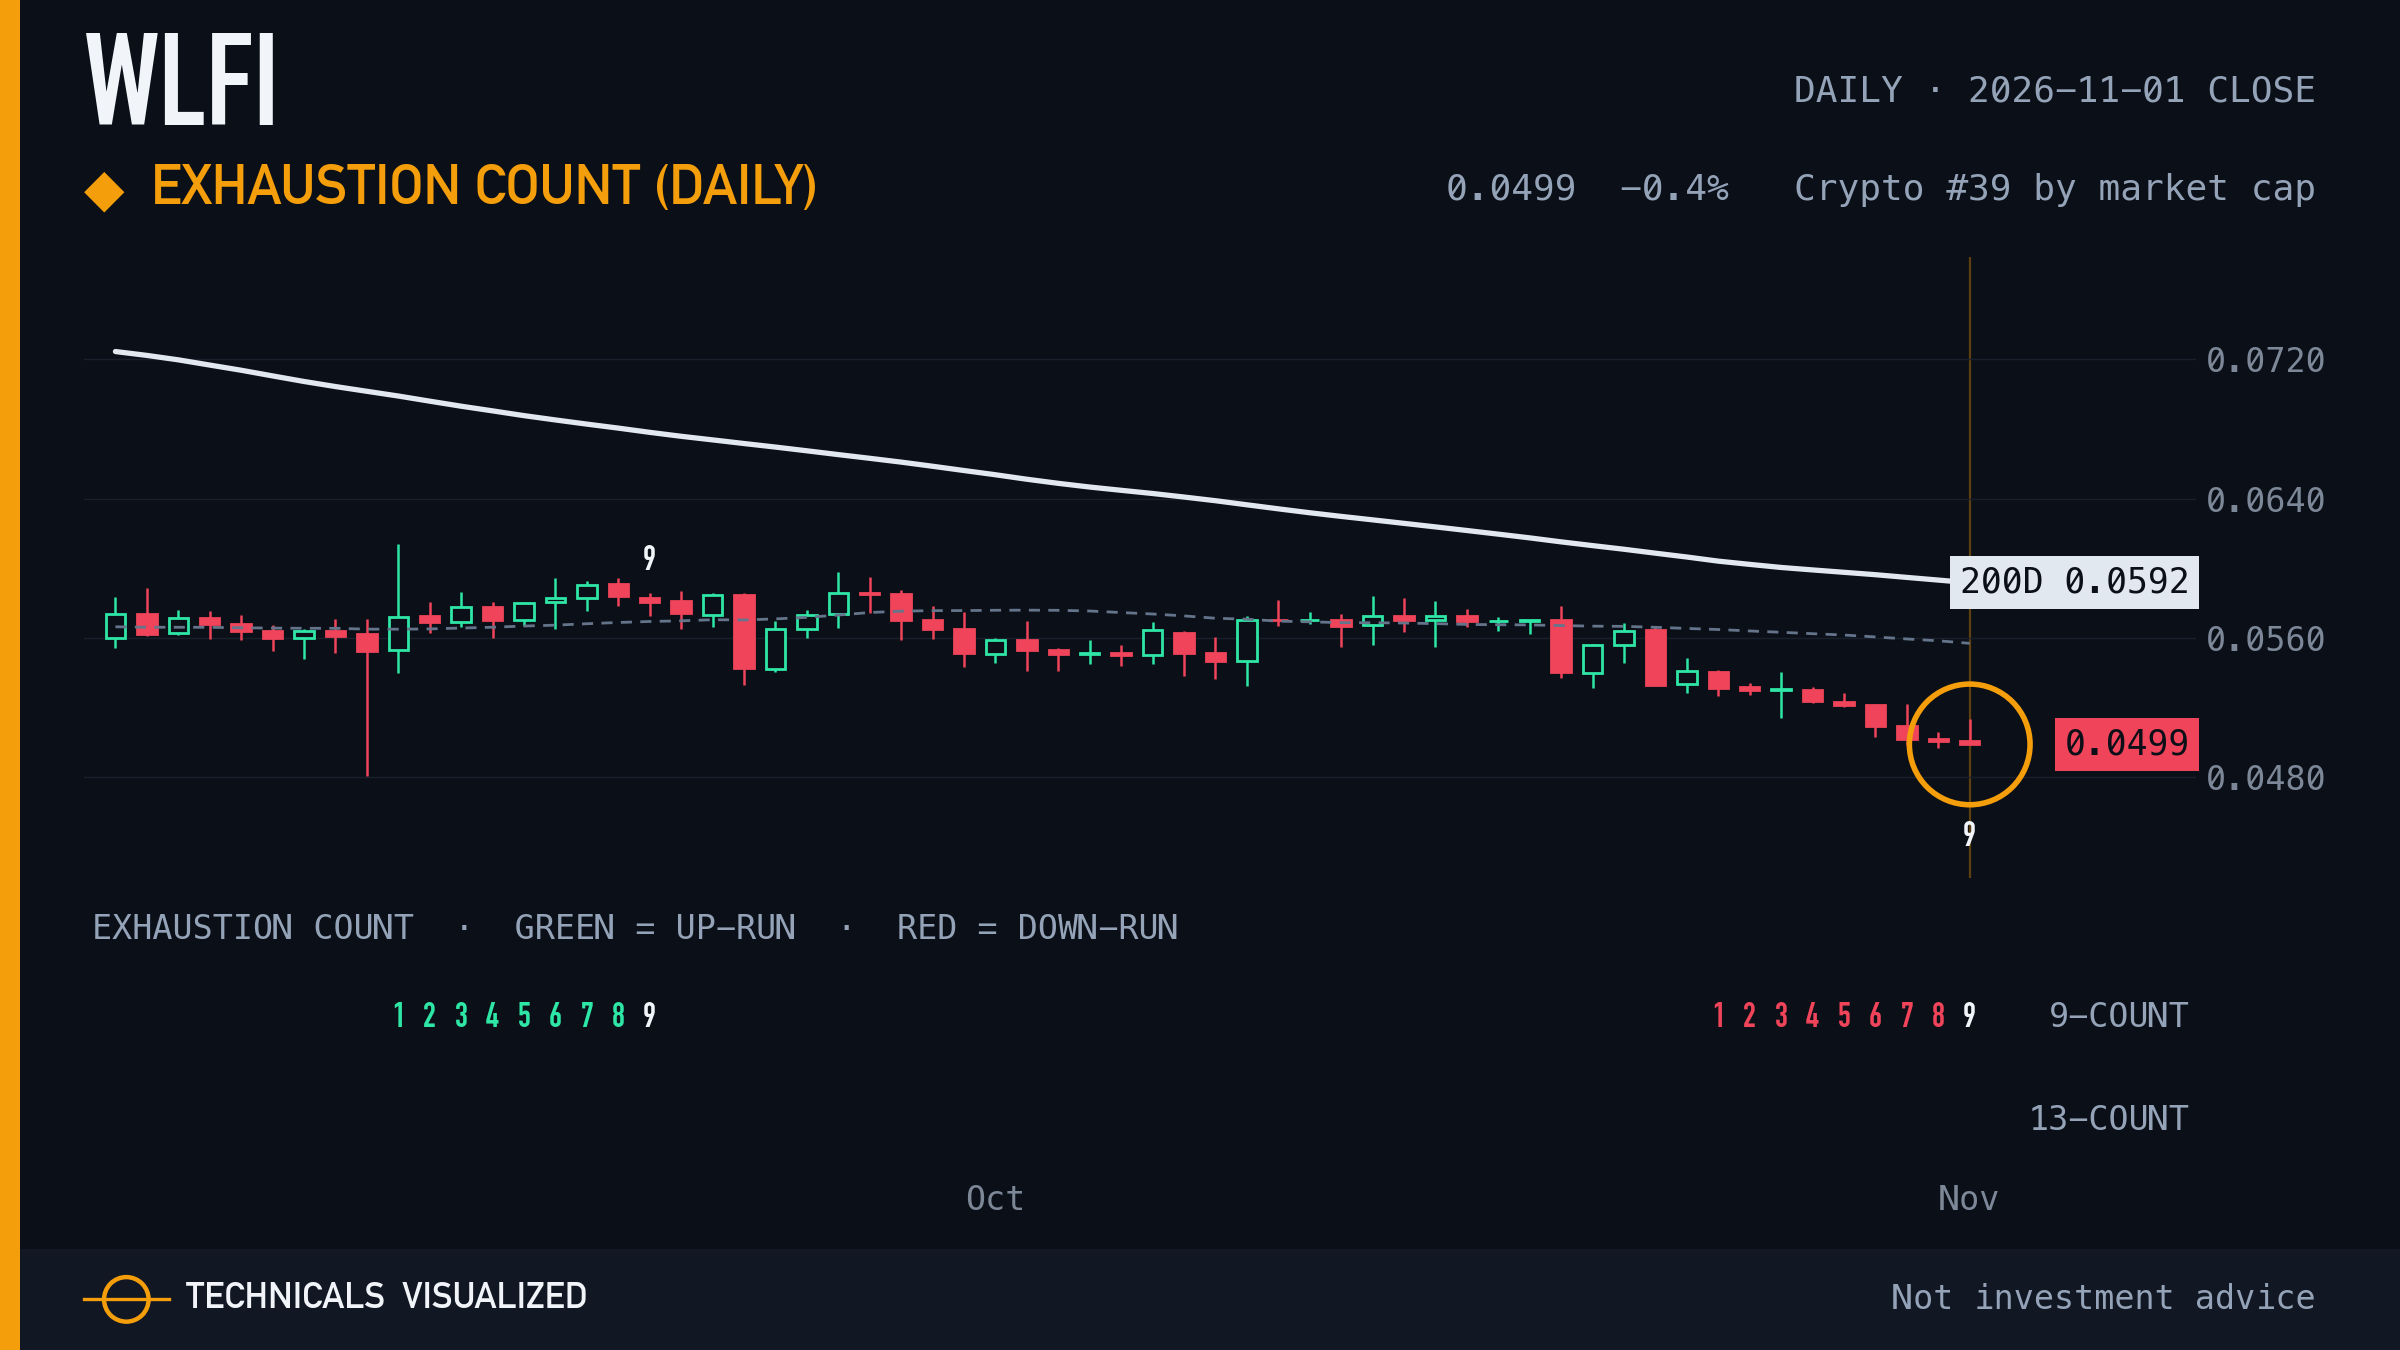
World Liberty Financial daily exhaustion count: setup phase complete and qualified (downside count).
A completed setup marks a stretched run. It is a pause marker, not a turn signal.
|
|
12 · Beam · RSI 84: overbought extreme
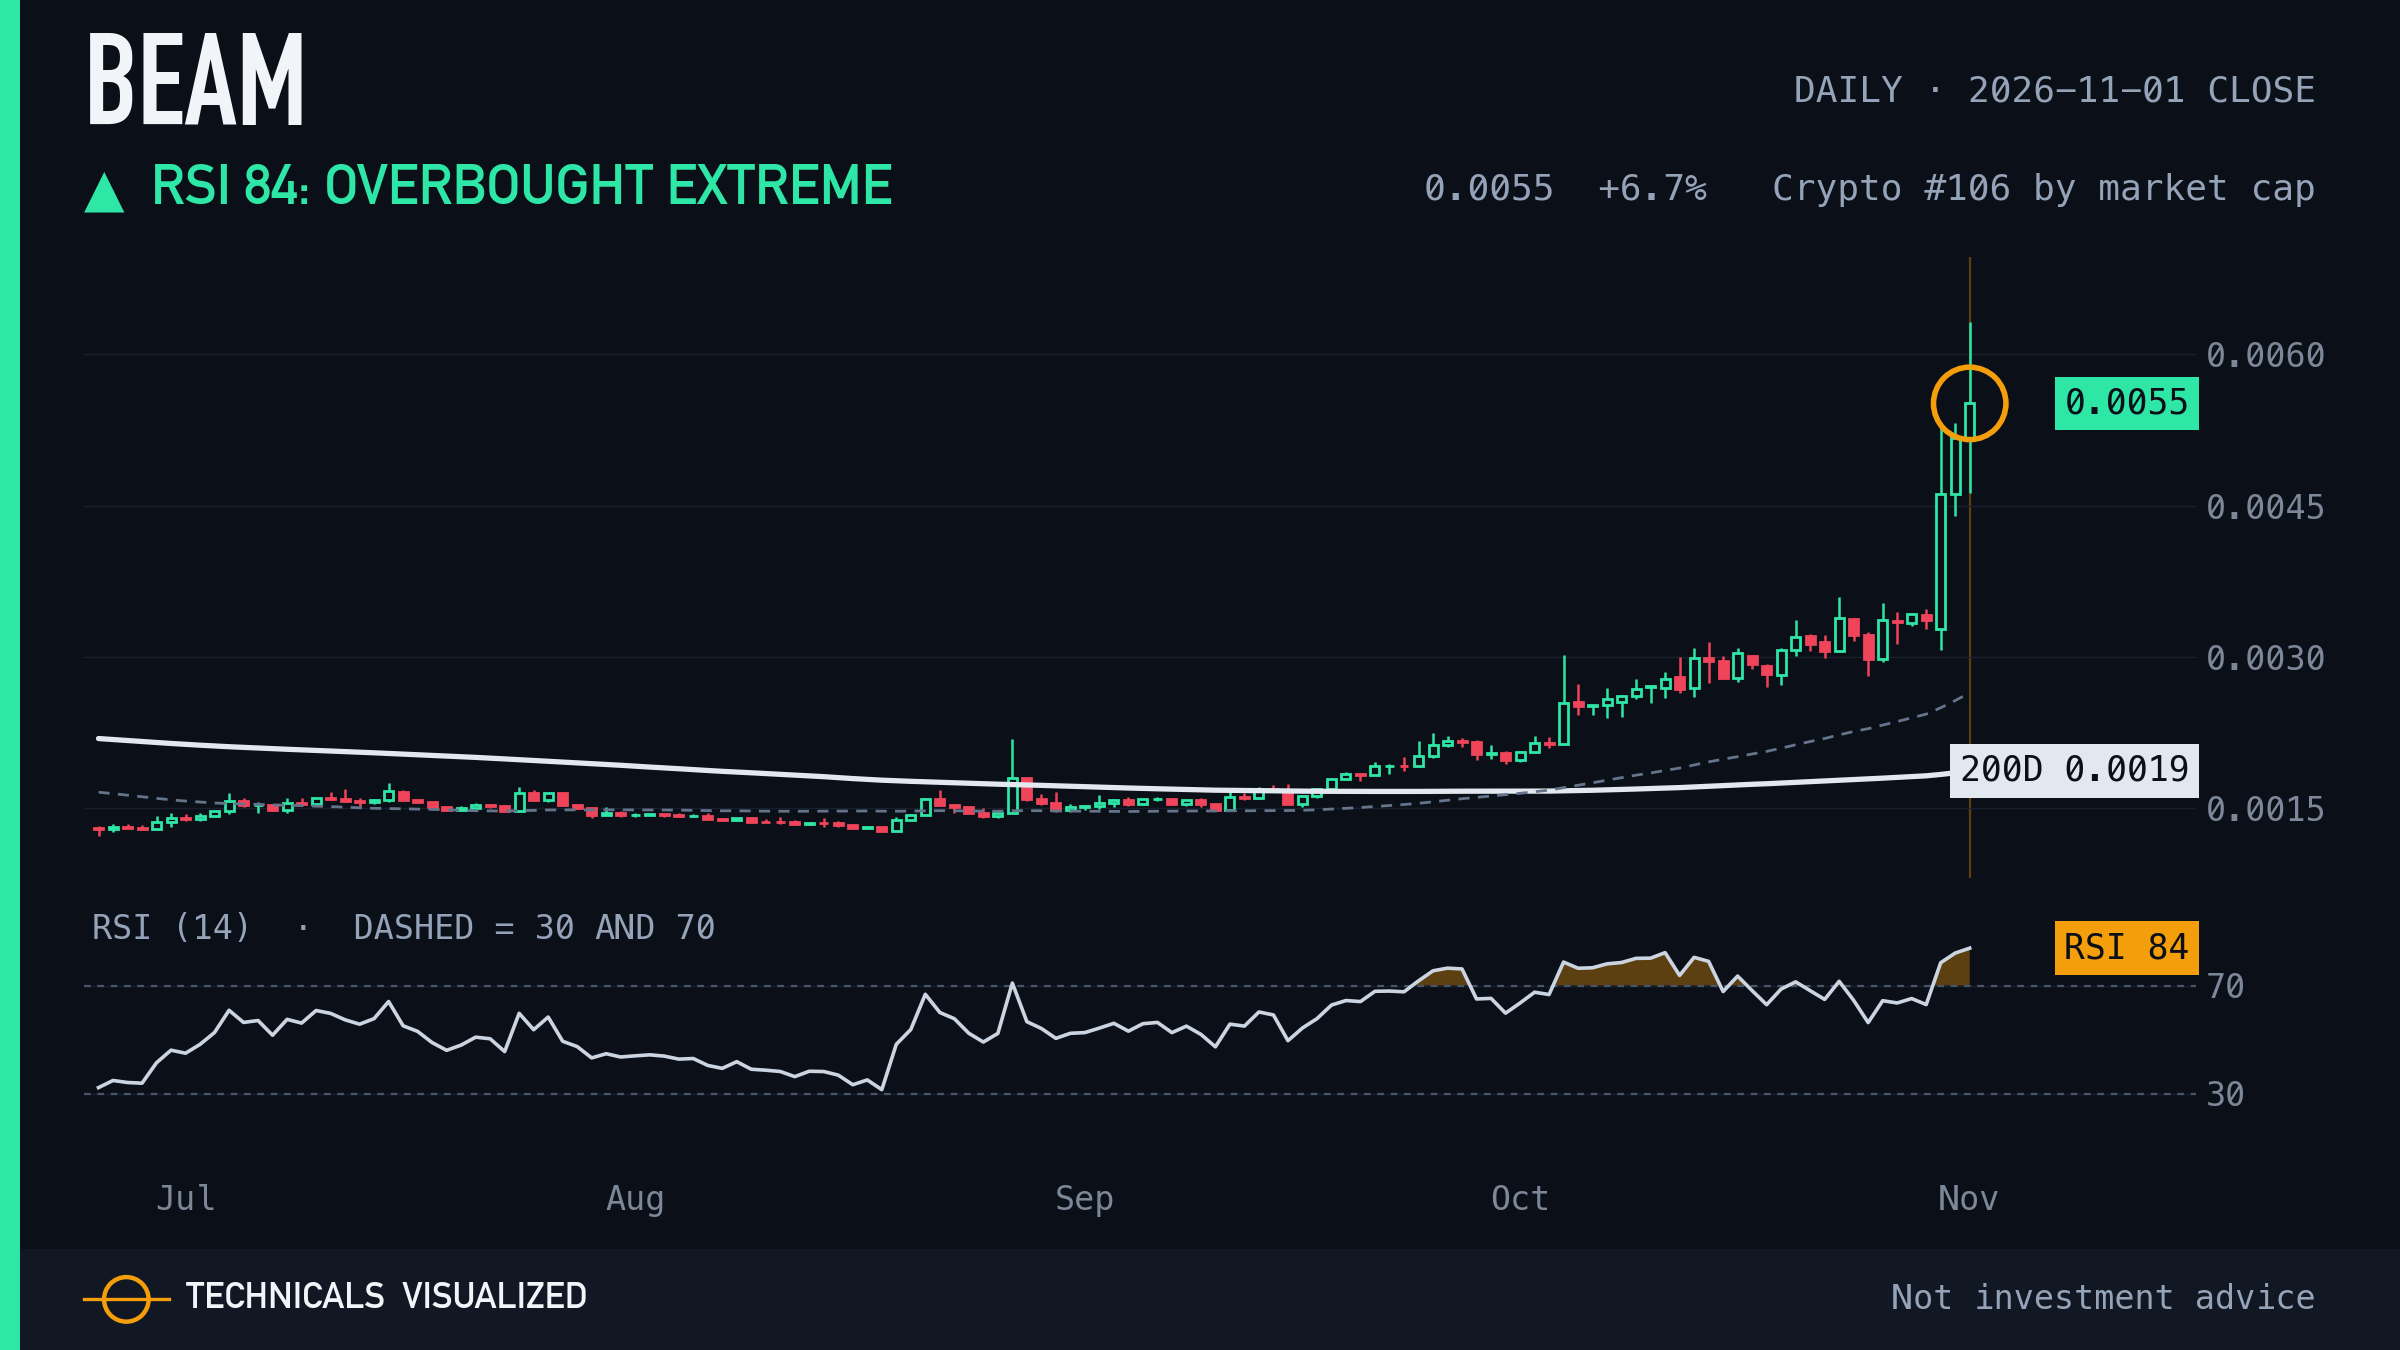
Beam 14-day RSI closed at 84, its most extreme reading since December 2023.
Readings this stretched describe the selling or buying already done, not when it ends.
|
 TECHNICALS VISUALIZED