MajorsThe same three every day: Bitcoin, Ethereum and Solana. Hyperliquid and Zcash join when they print a reading. |
|
01 · Bitcoin (BTC) · Daily chart
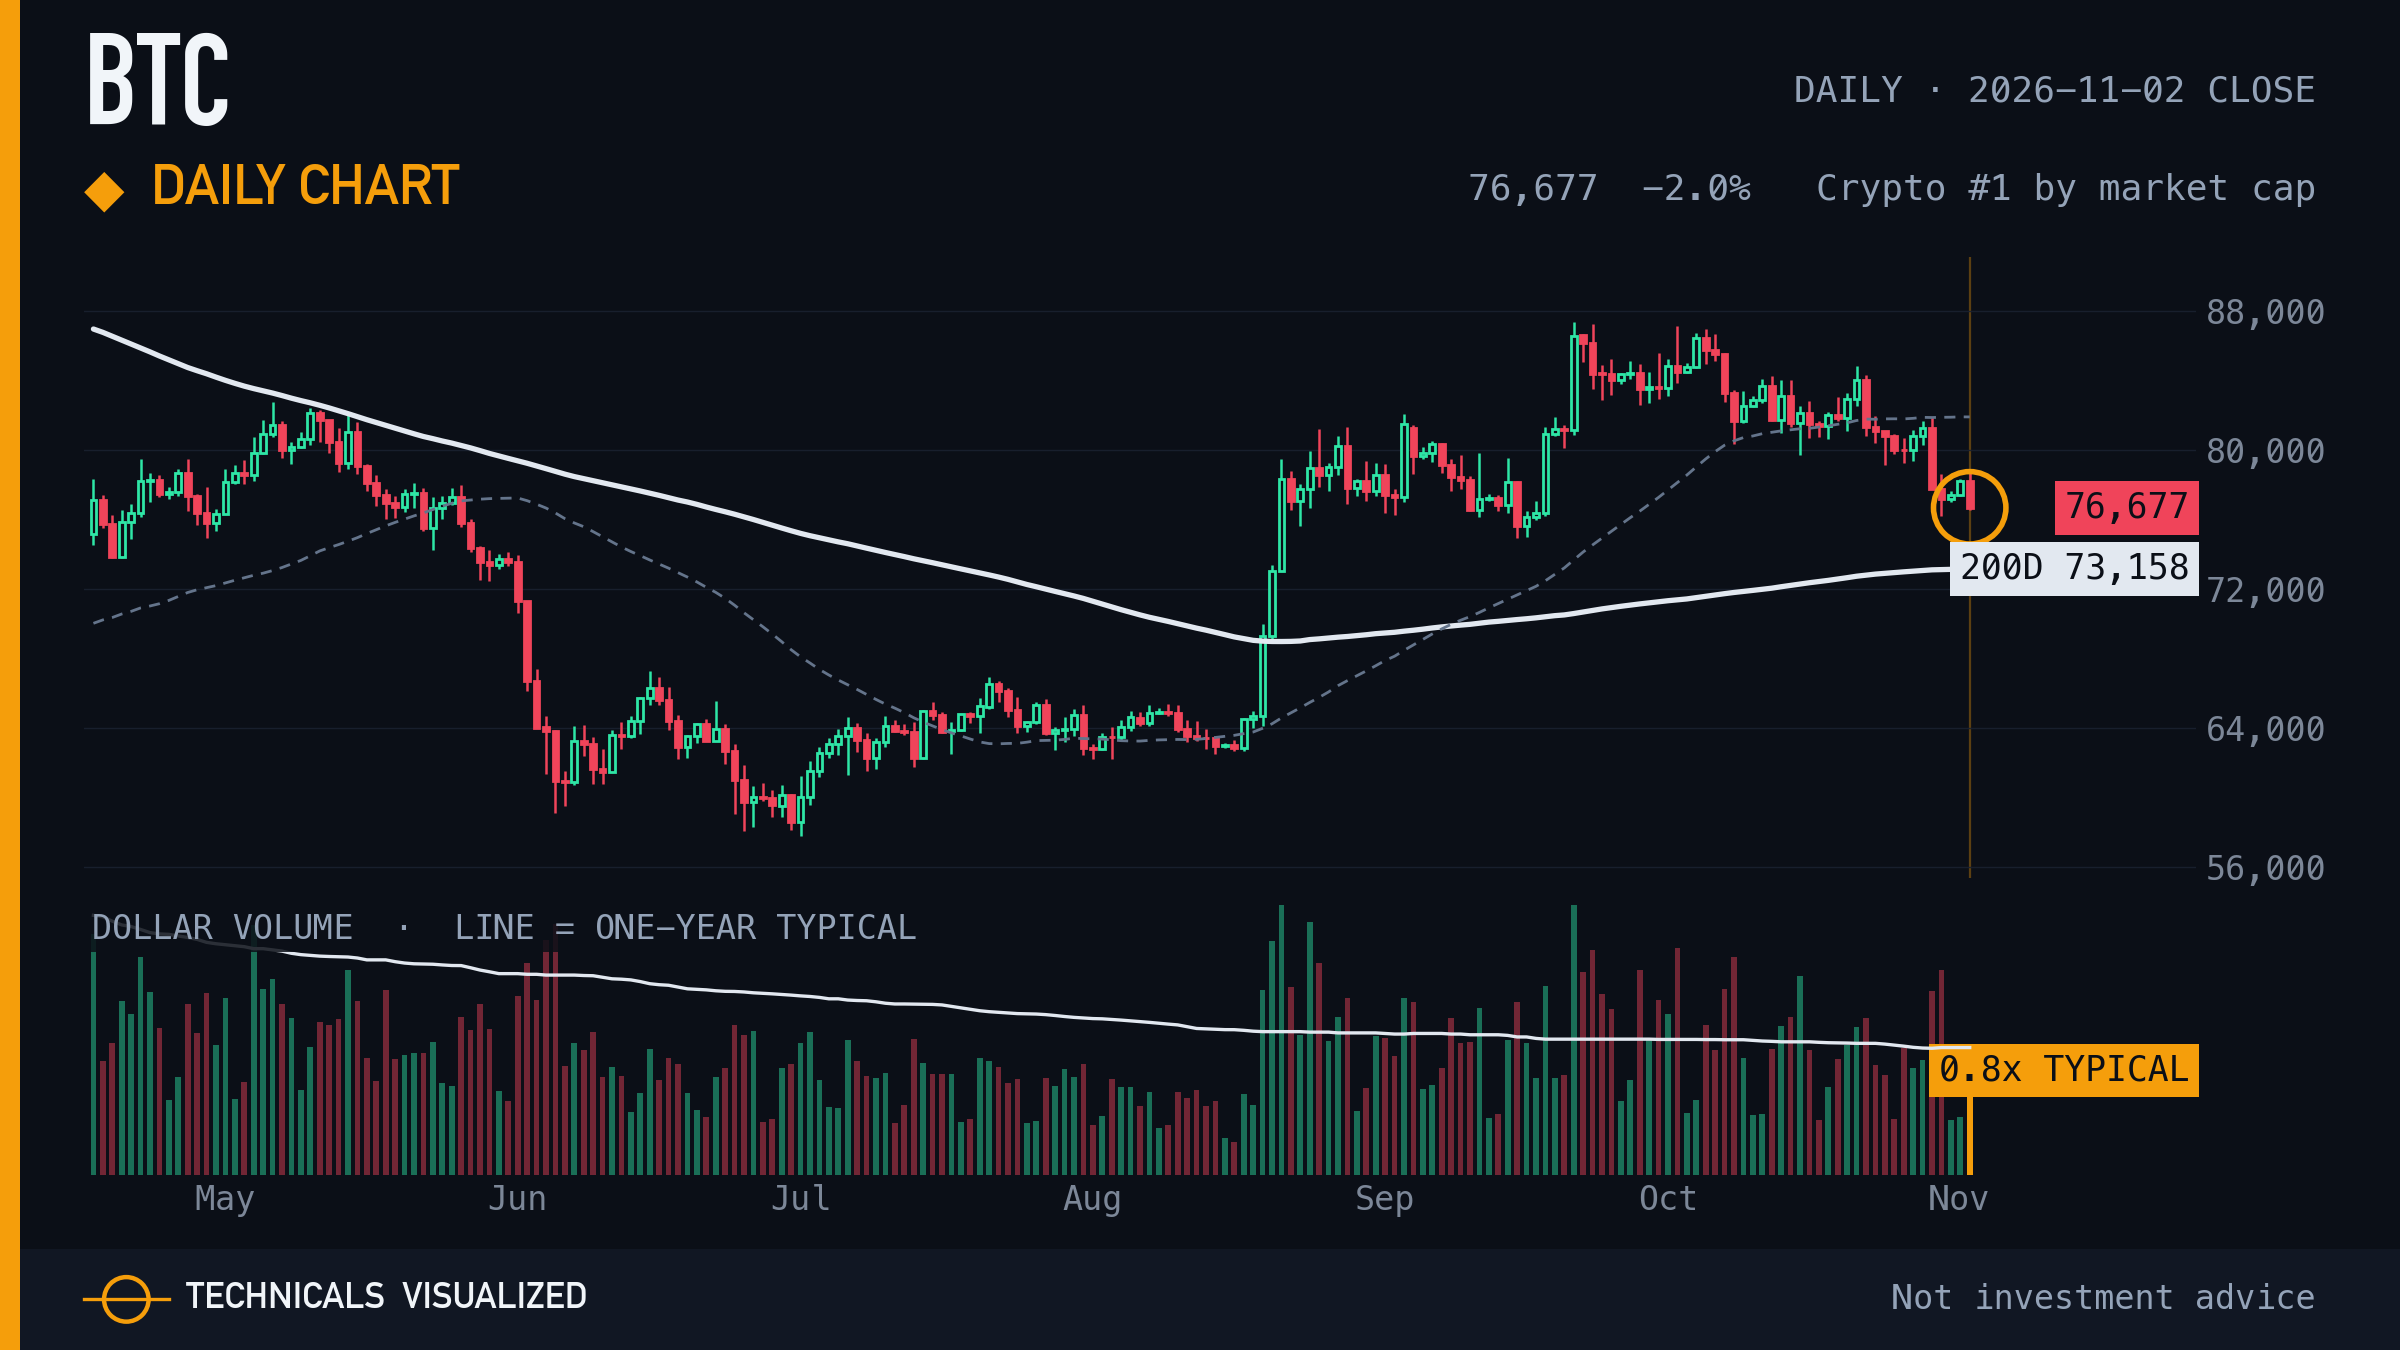
Bitcoin closed at $76,677, -2.0% on the day, 4.8% above its 200-day average.
Shown in every edition, whether or not it printed a reading. The amber ring marks this close.
|
|
02 · Ethereum (ETH) · Daily chart
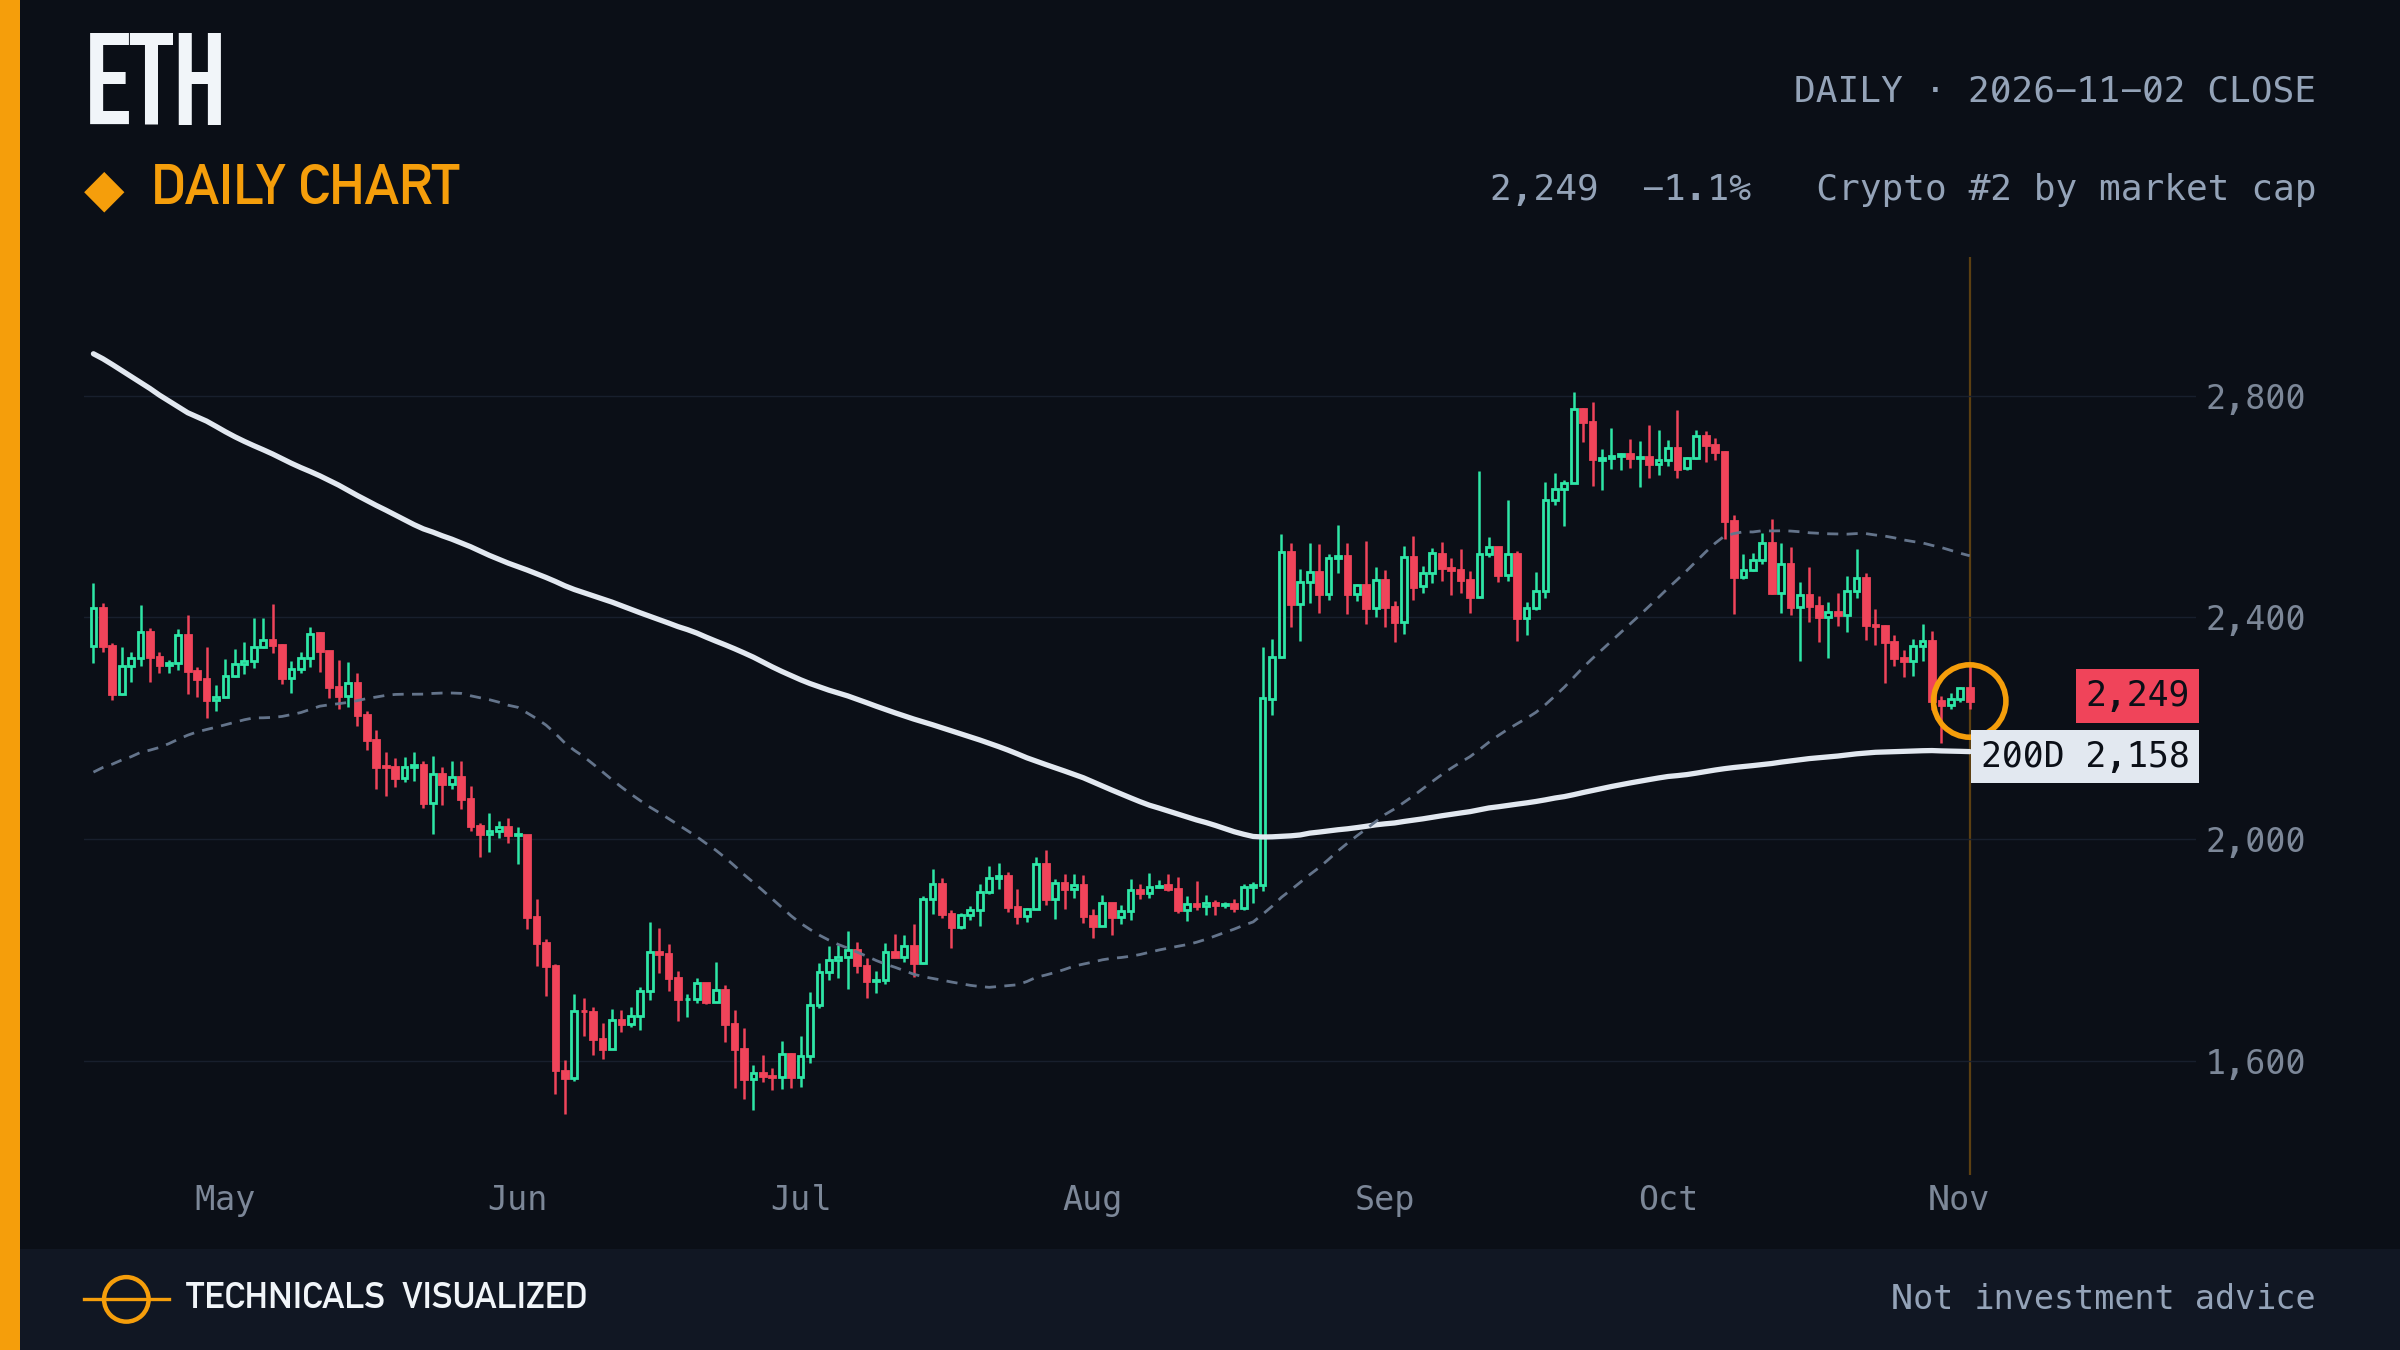
Ethereum closed at $2,249, -1.1% on the day, 4.2% above its 200-day average.
Shown in every edition, whether or not it printed a reading. The amber ring marks this close.
|
|
03 · Solana (SOL) · Daily chart
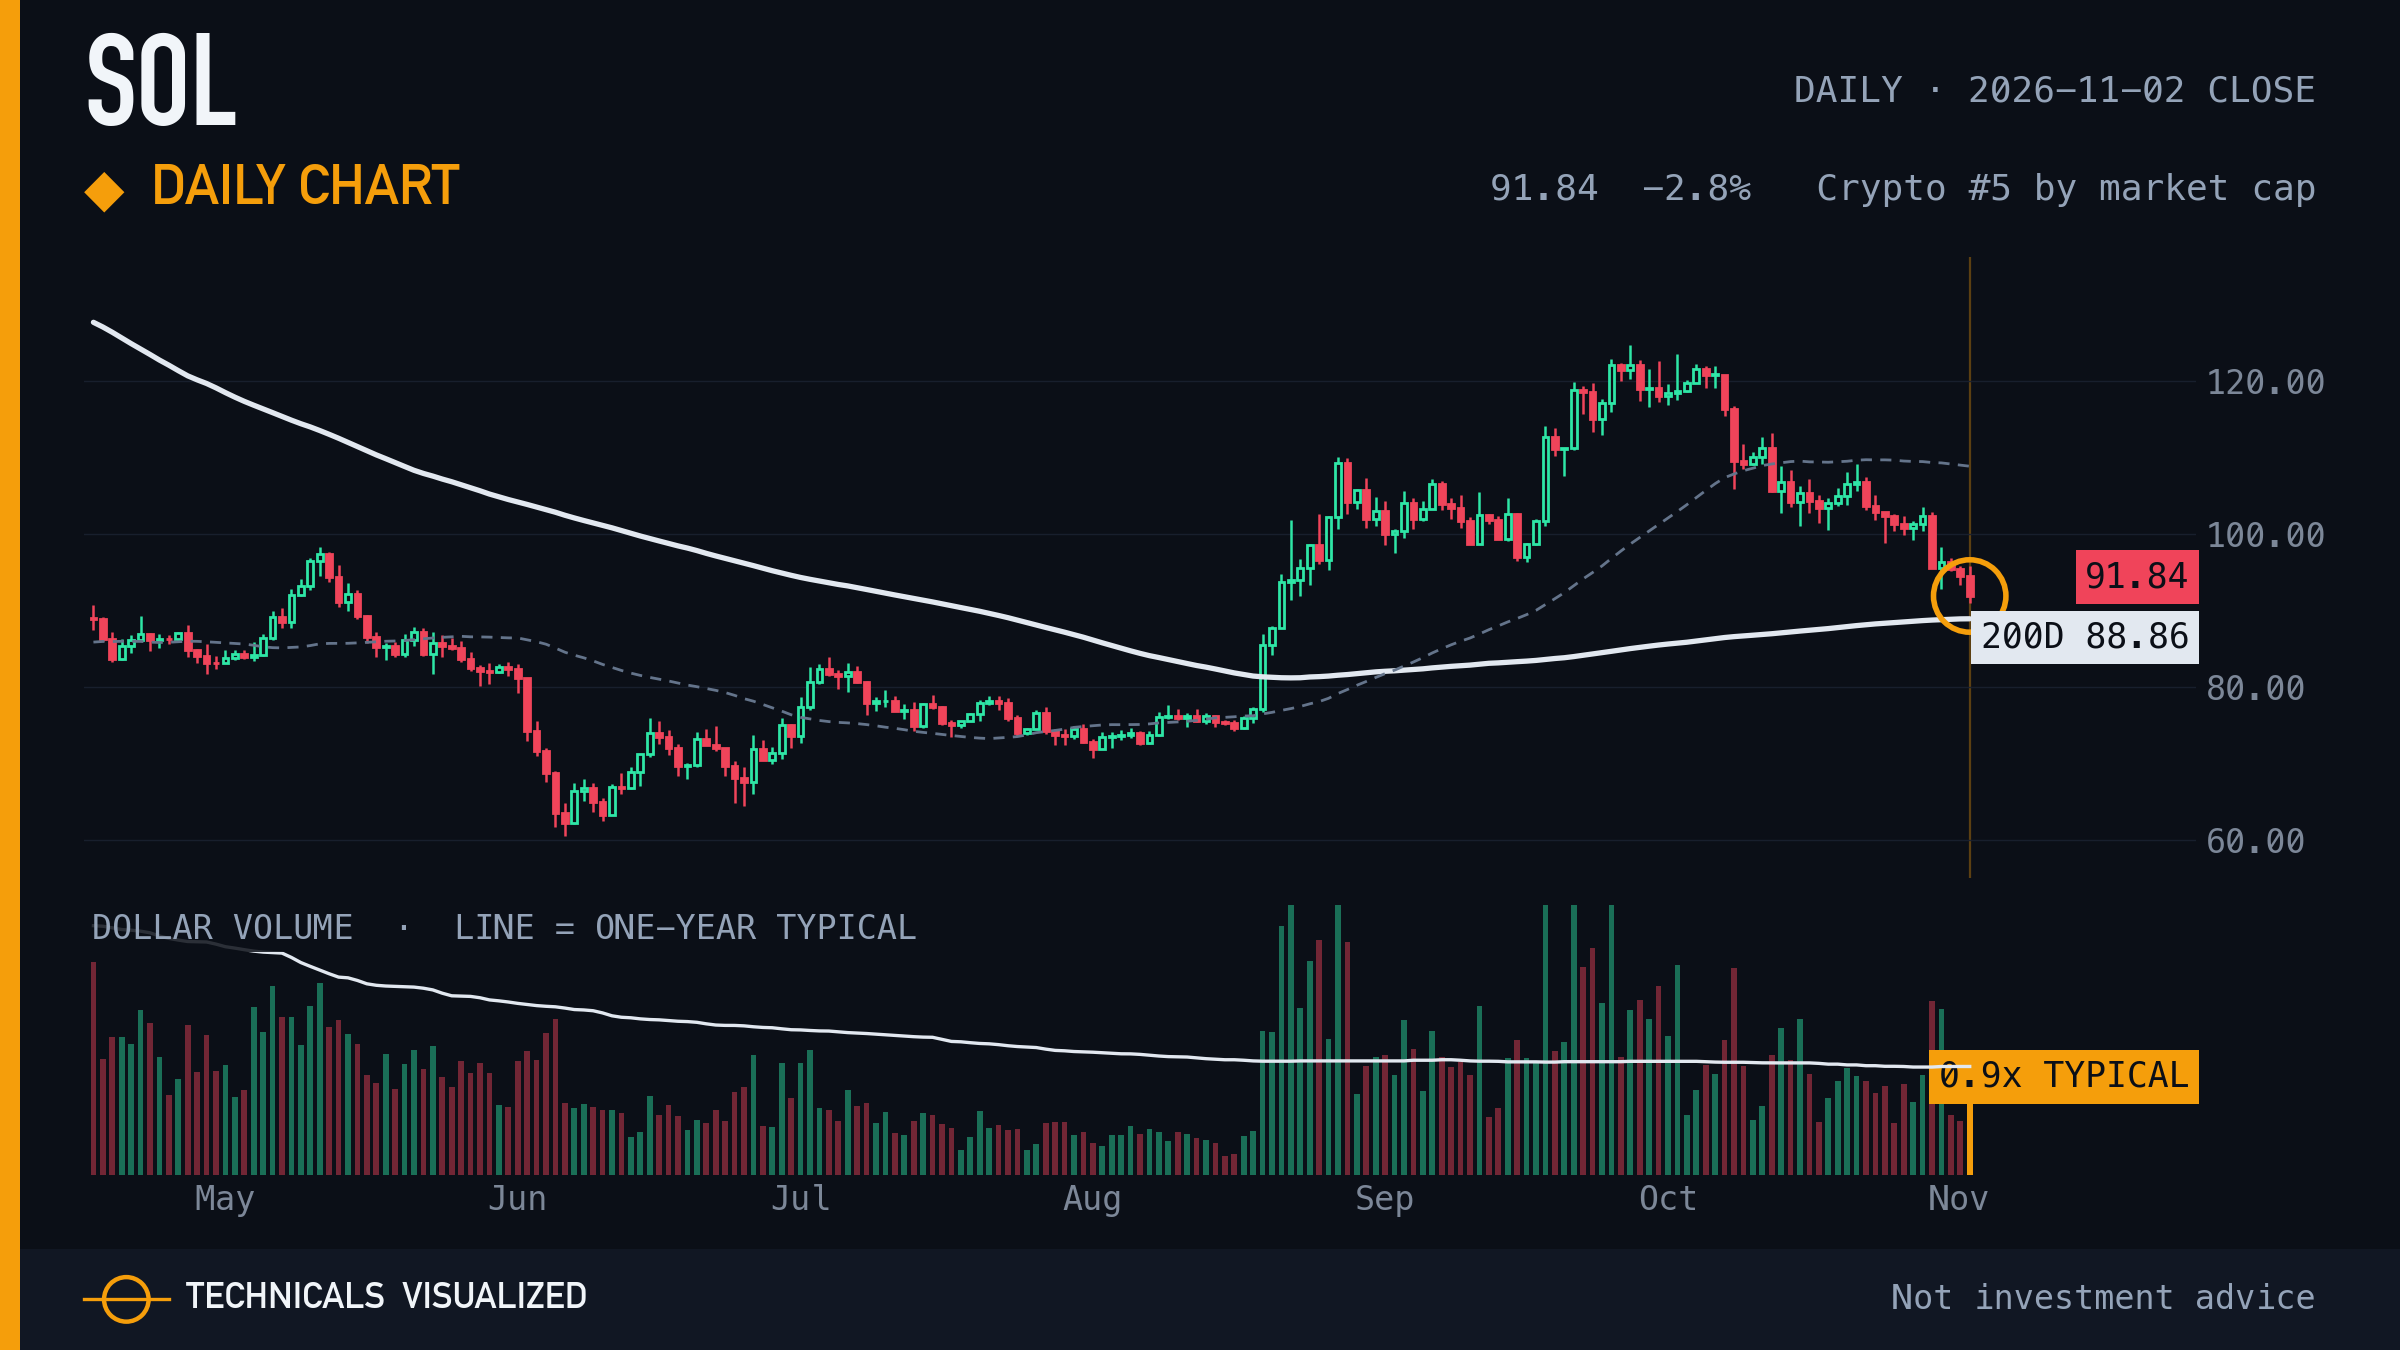
Solana closed at $91.84, -2.8% on the day, 3.4% above its 200-day average.
Shown in every edition, whether or not it printed a reading. The amber ring marks this close.
|
Today's readings |
|
04 · Monad (MON) · New 52-week low
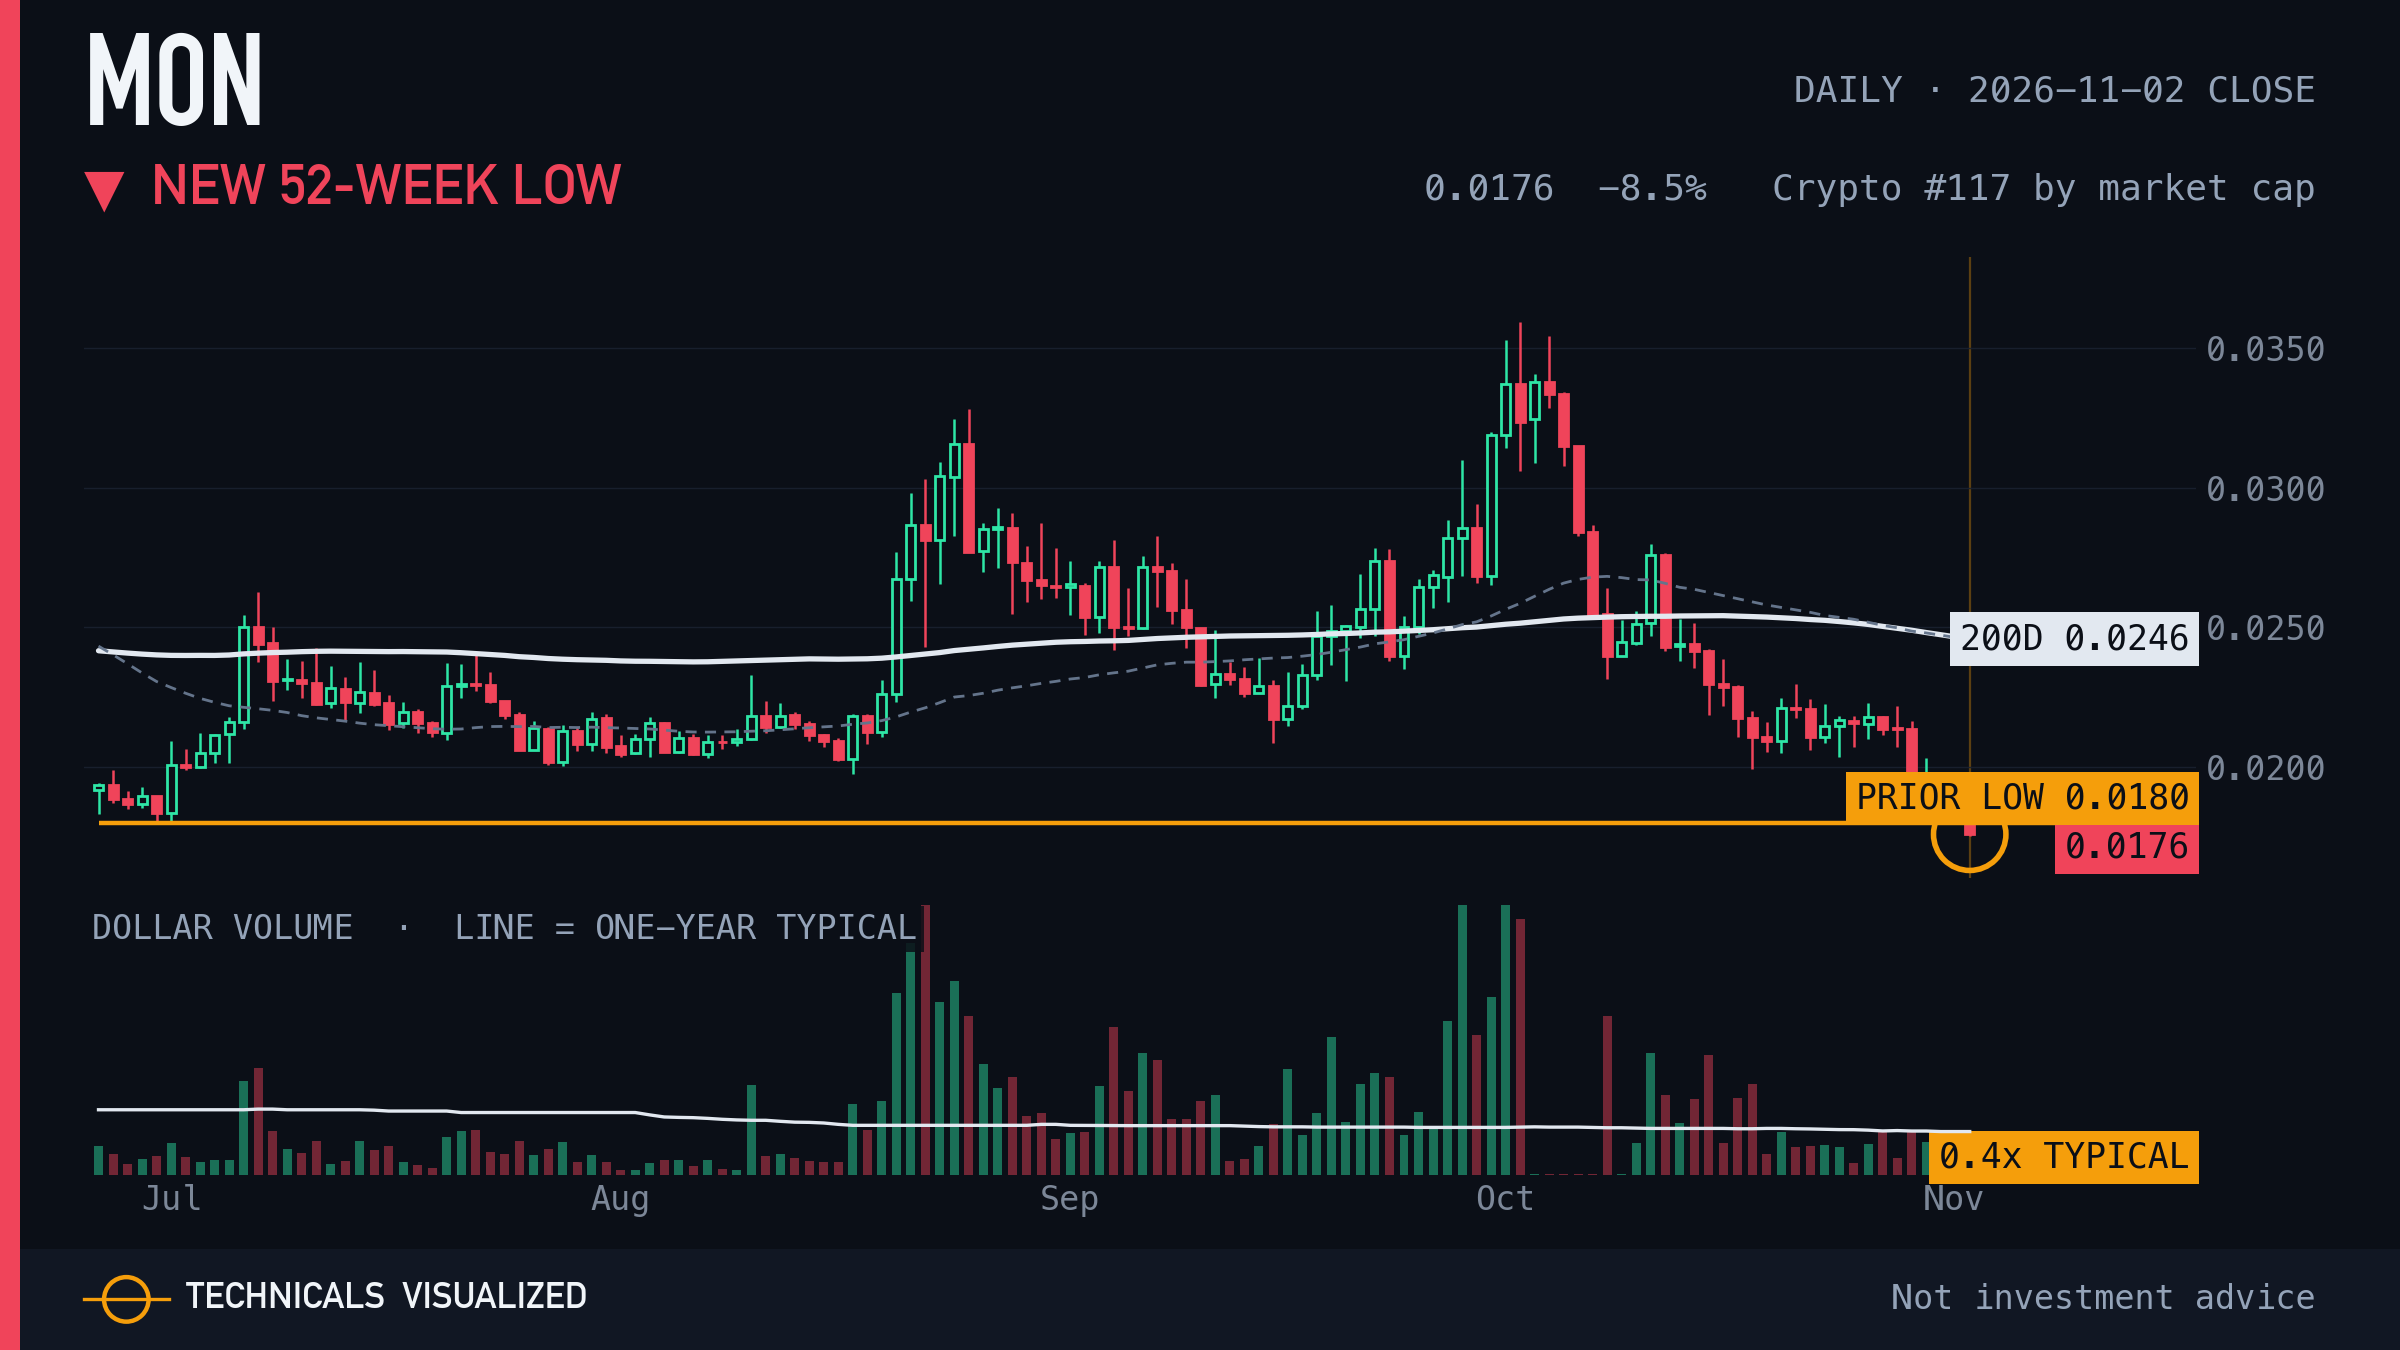
Monad closed below its prior 52-week low (first such close in 389 sessions).
The prior 52-week low was $0.02.
|
|
05 · POL (ex-MATIC) · Lost the 200-day
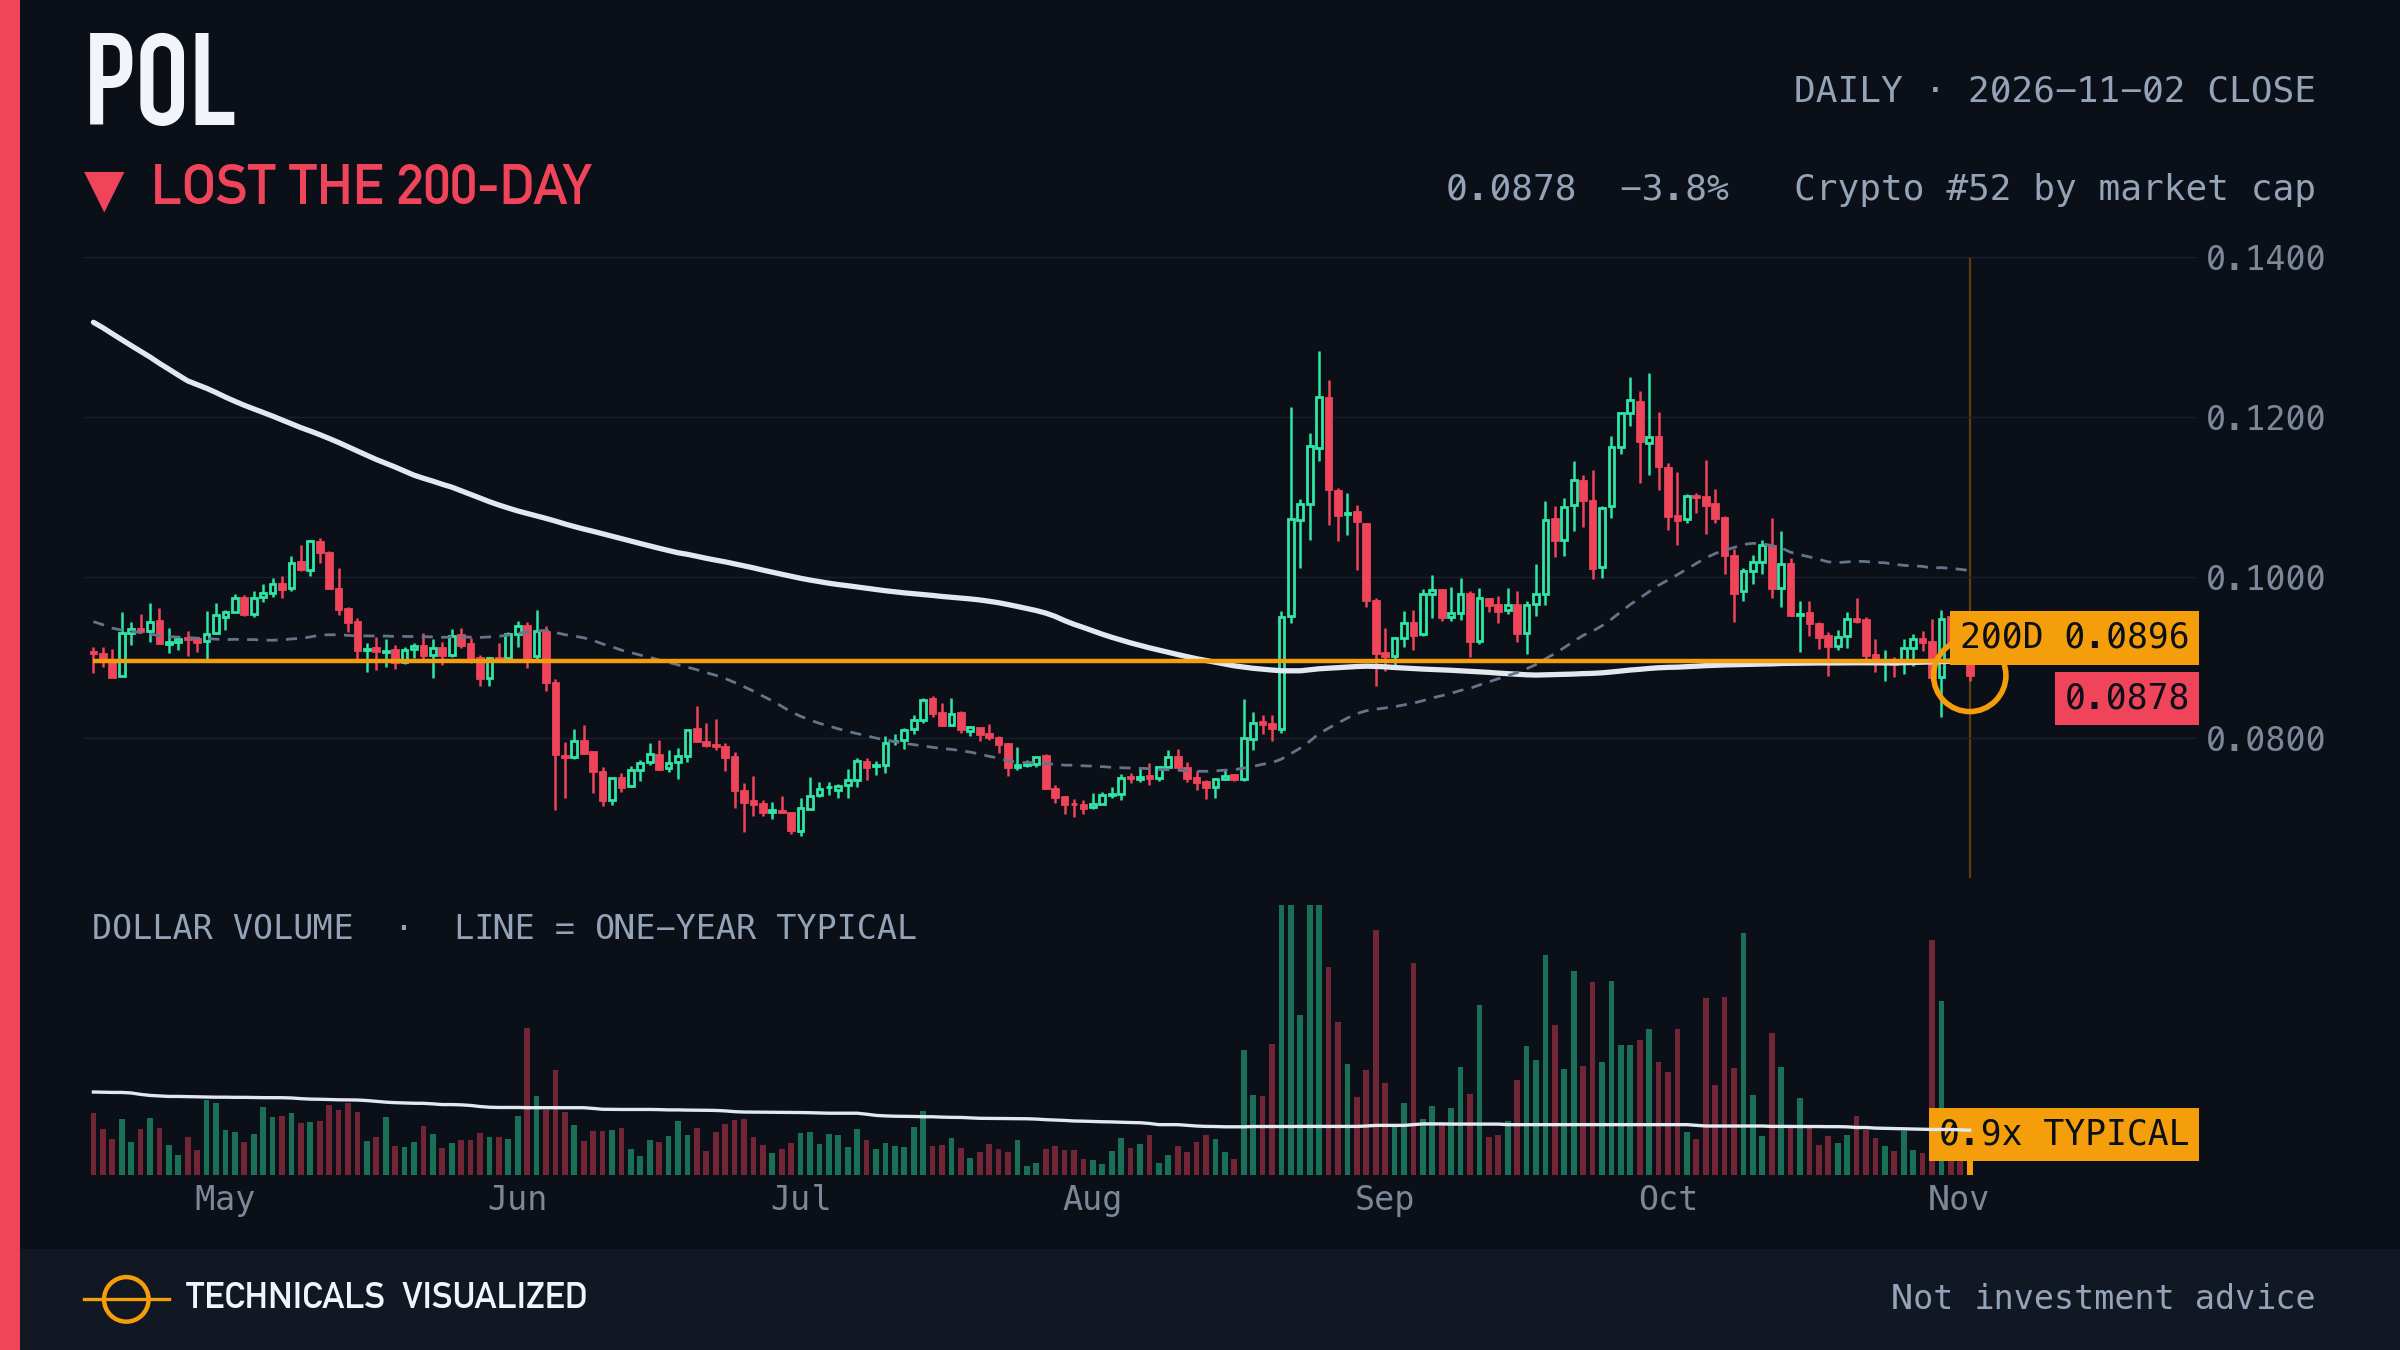
POL (ex-MATIC) first close below the 200-day average after closing above it on 48 of the prior 50 sessions.
The 200-day average sits at $0.09. The chart shows the line; it does not say the cross will hold.
|
|
06 · Optimism (OP) · Lost the 200-day
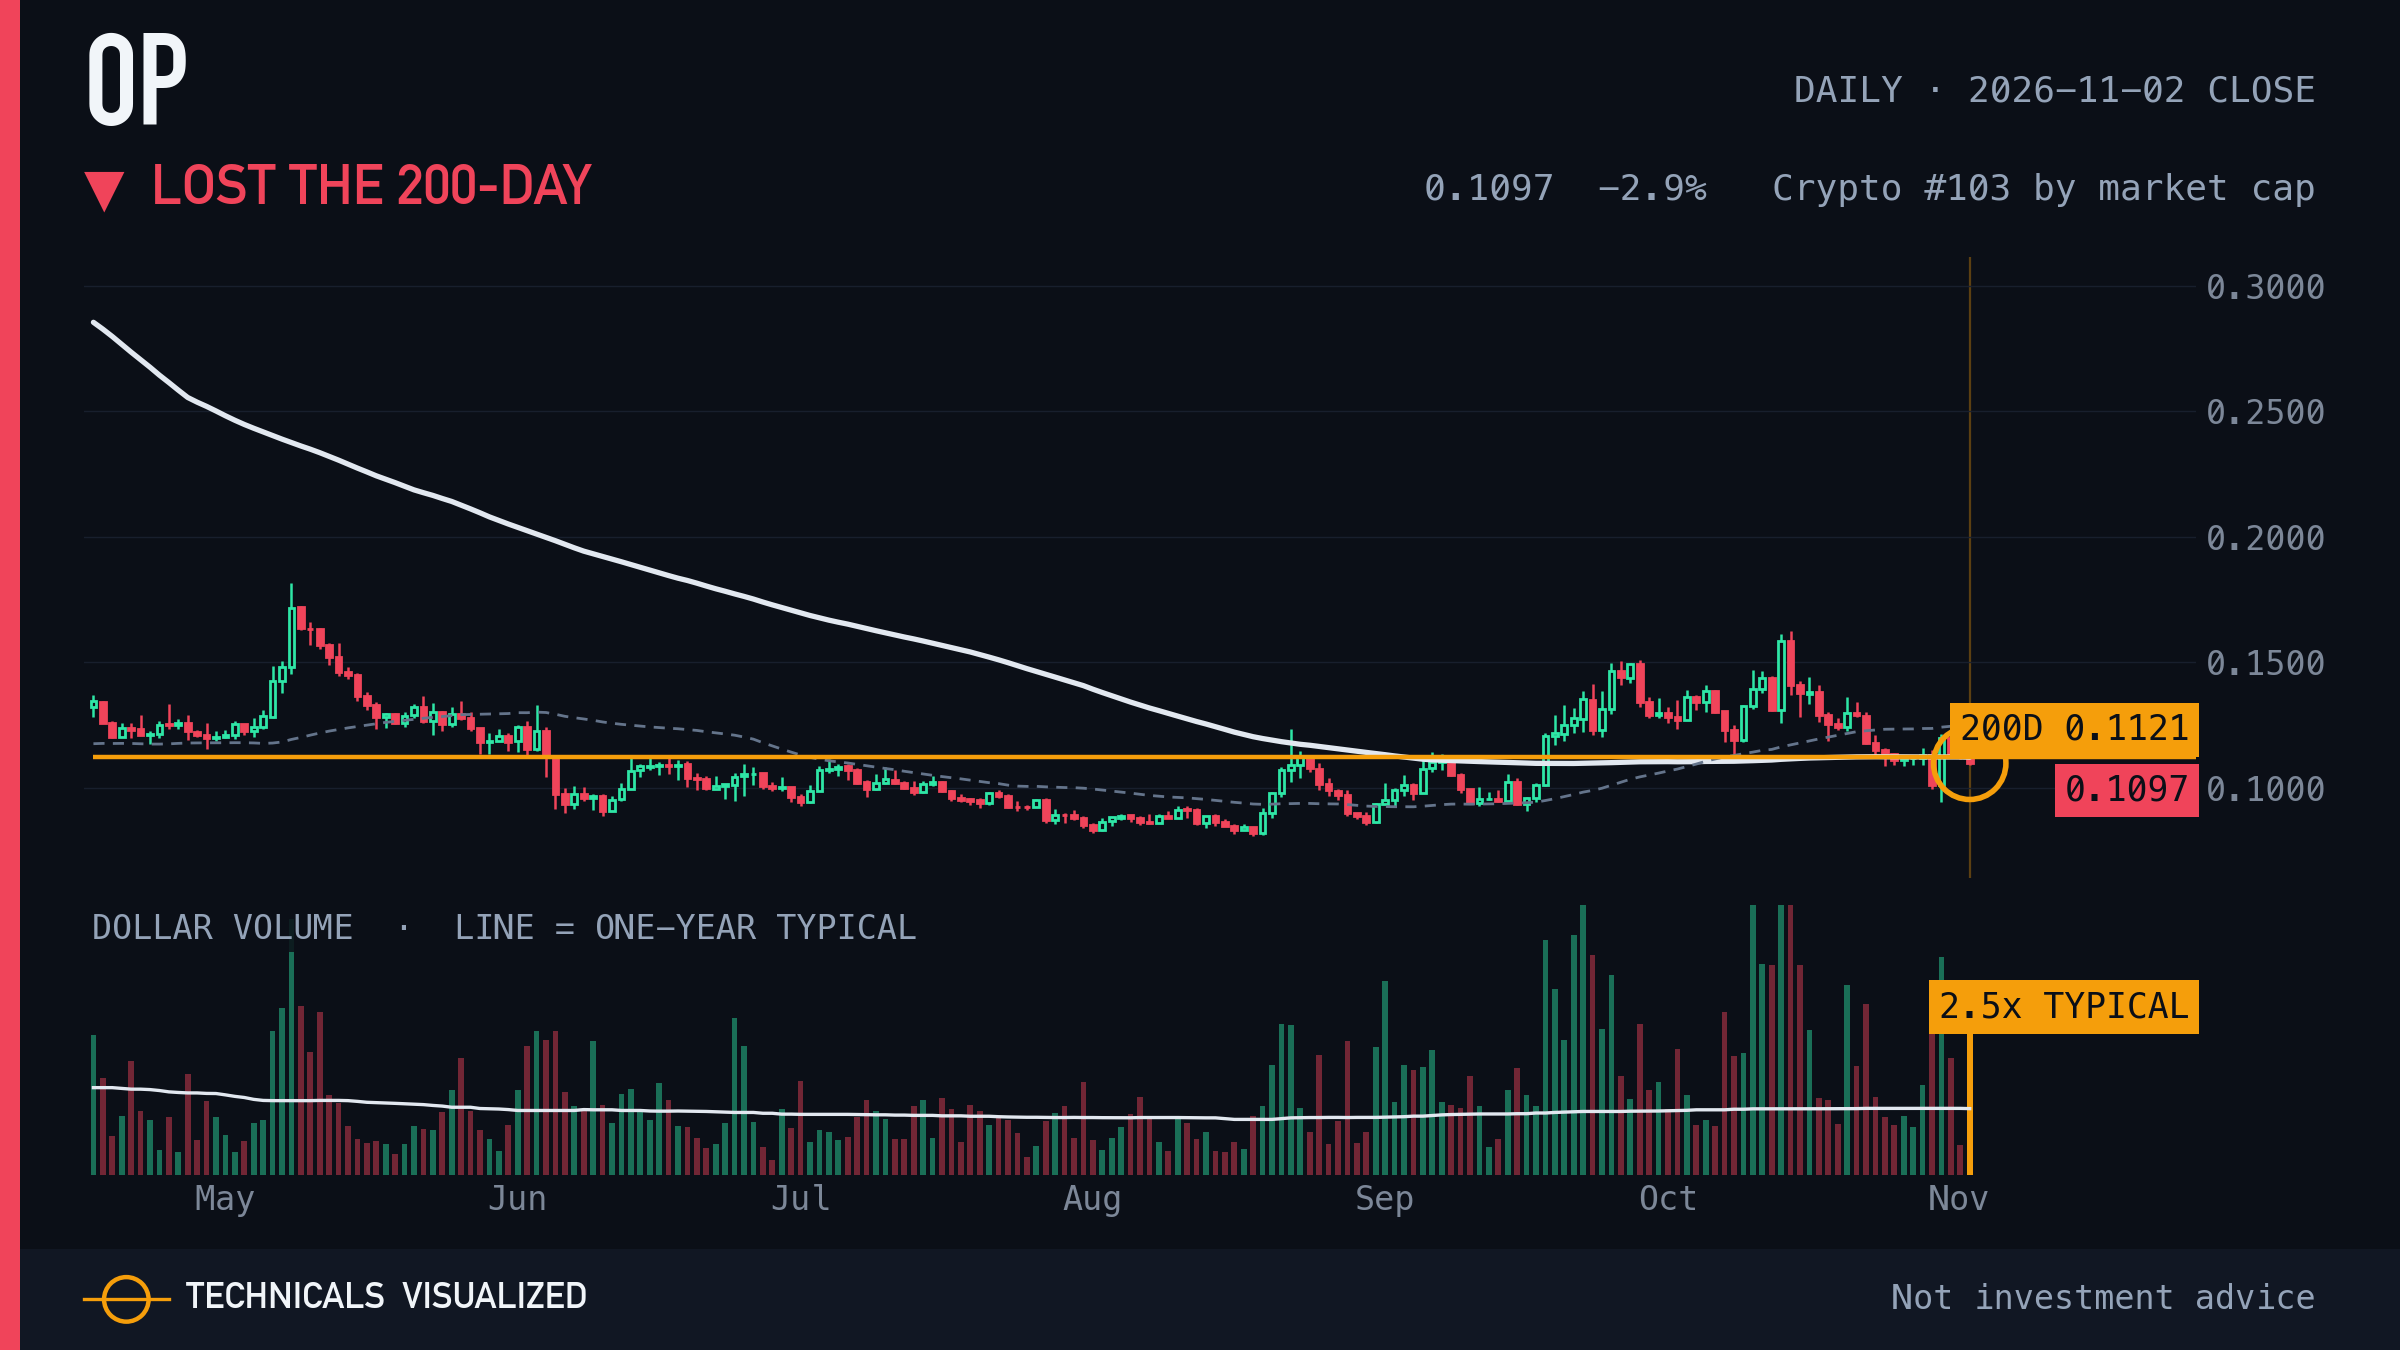
Optimism first close below the 200-day average after closing above it on 41 of the prior 50 sessions.
The 200-day average sits at $0.11. The chart shows the line; it does not say the cross will hold.
|
|
07 · Curve DAO (CRV) · Lost the 200-day
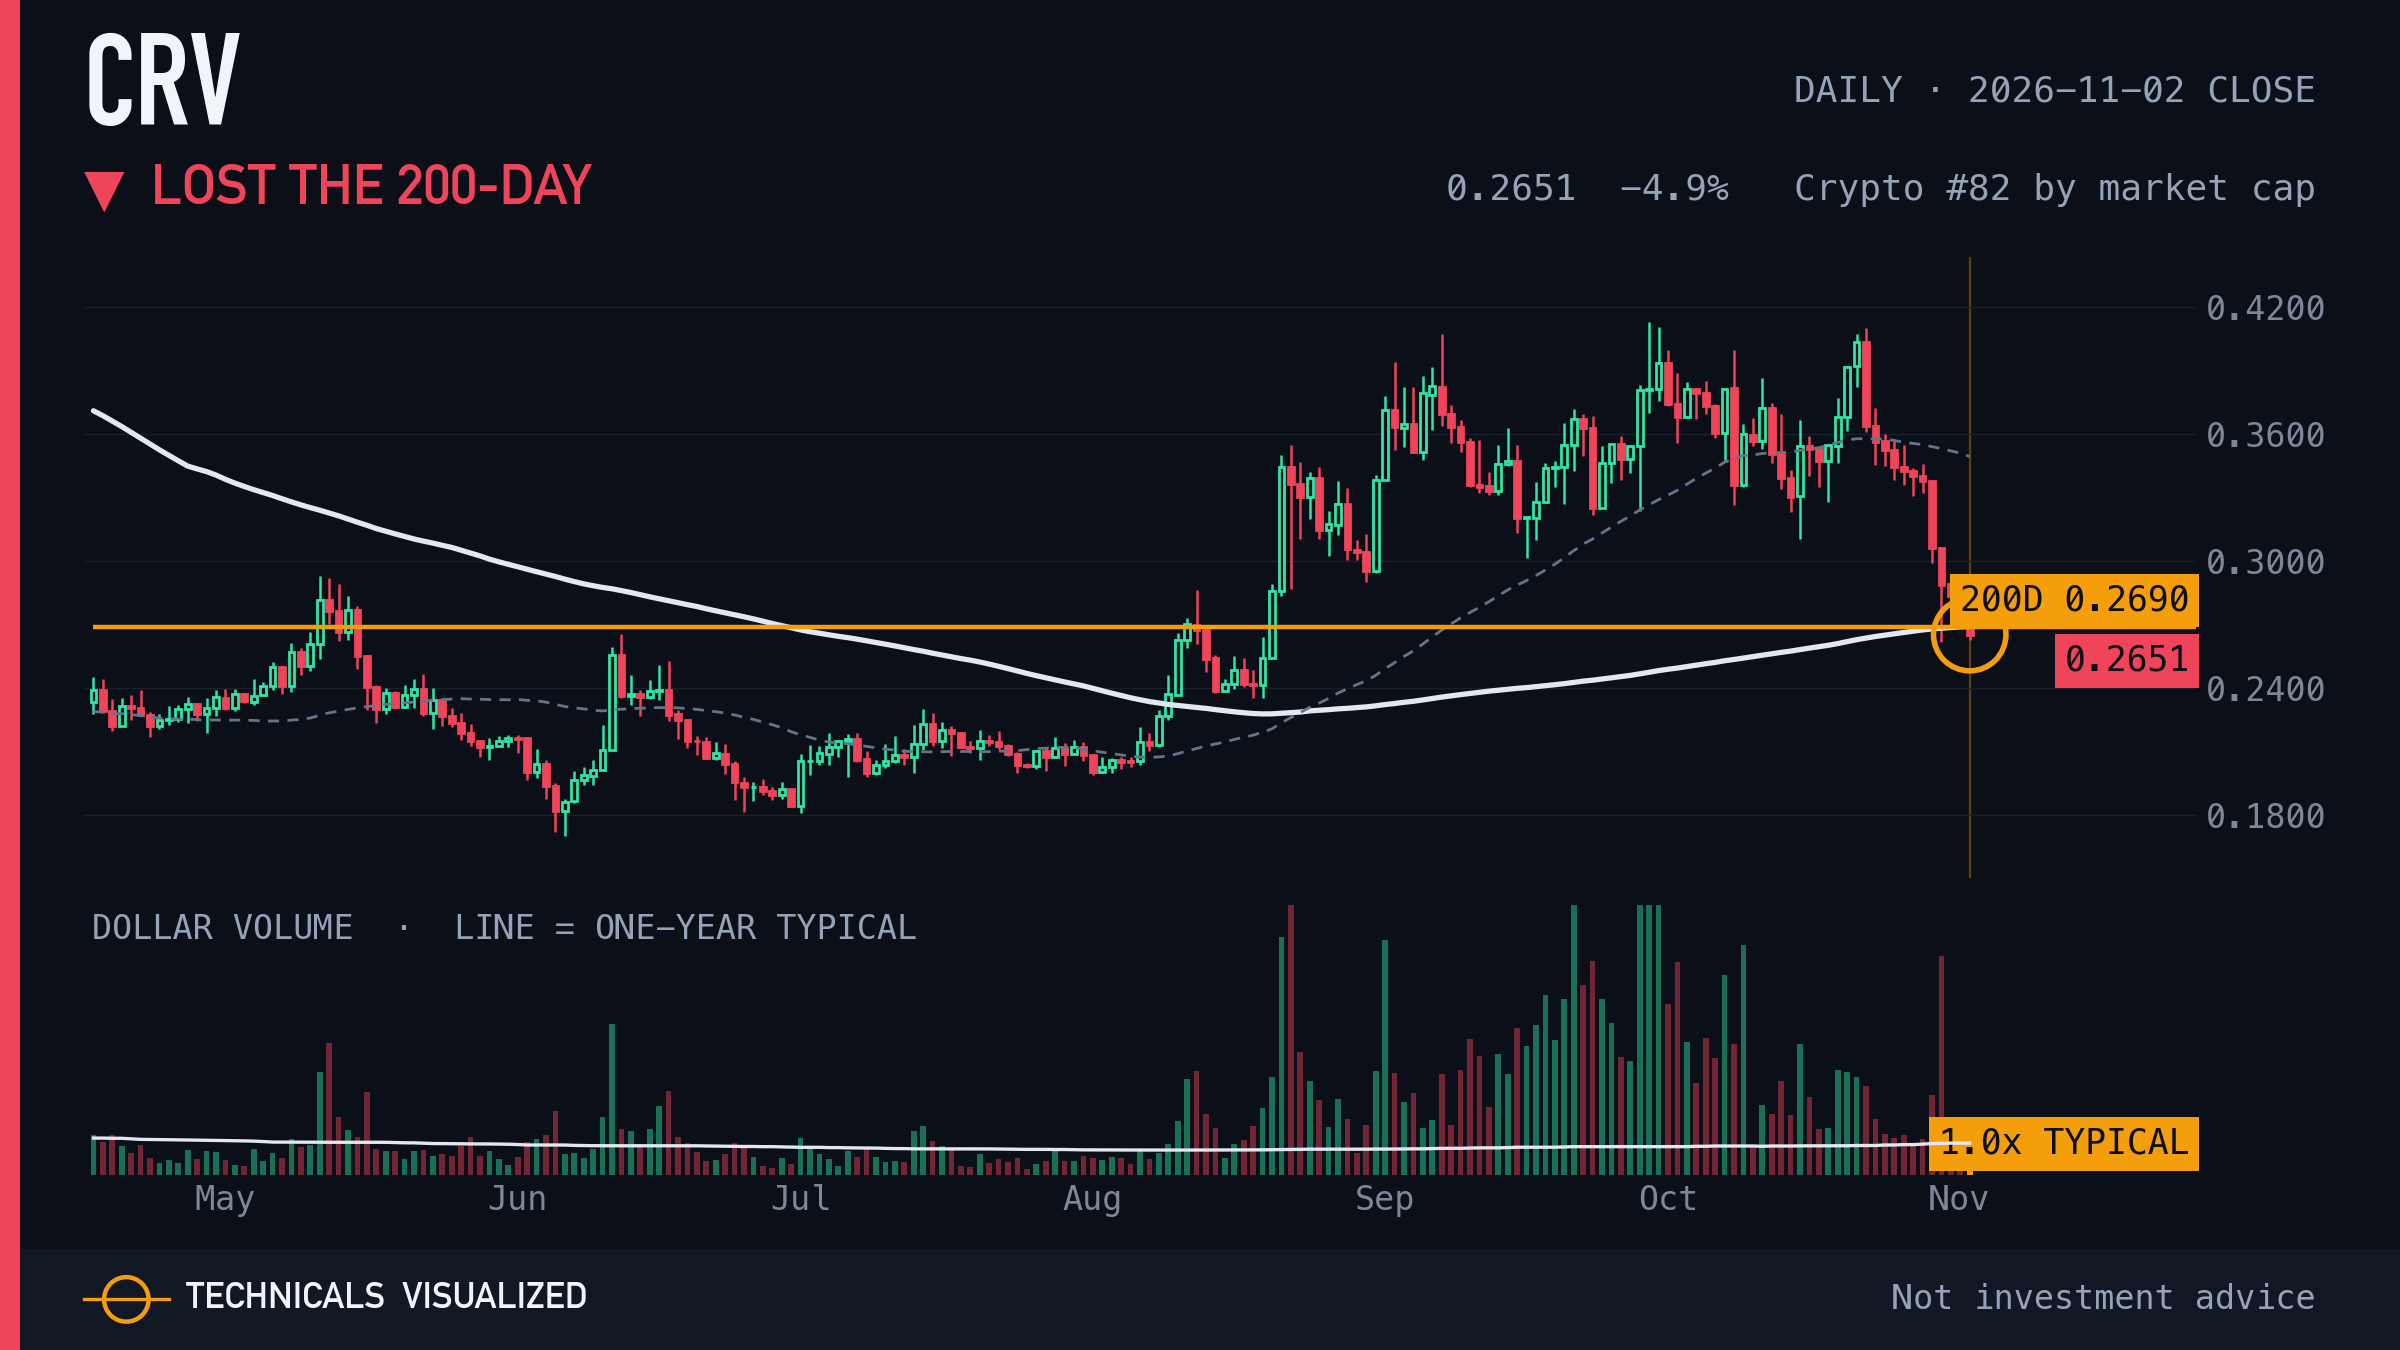
Curve DAO first close below the 200-day average after closing above it on 50 of the prior 50 sessions.
The 200-day average sits at $0.27. The chart shows the line; it does not say the cross will hold.
|
|
08 · PancakeSwap (CAKE) · Exhaustion count (daily)
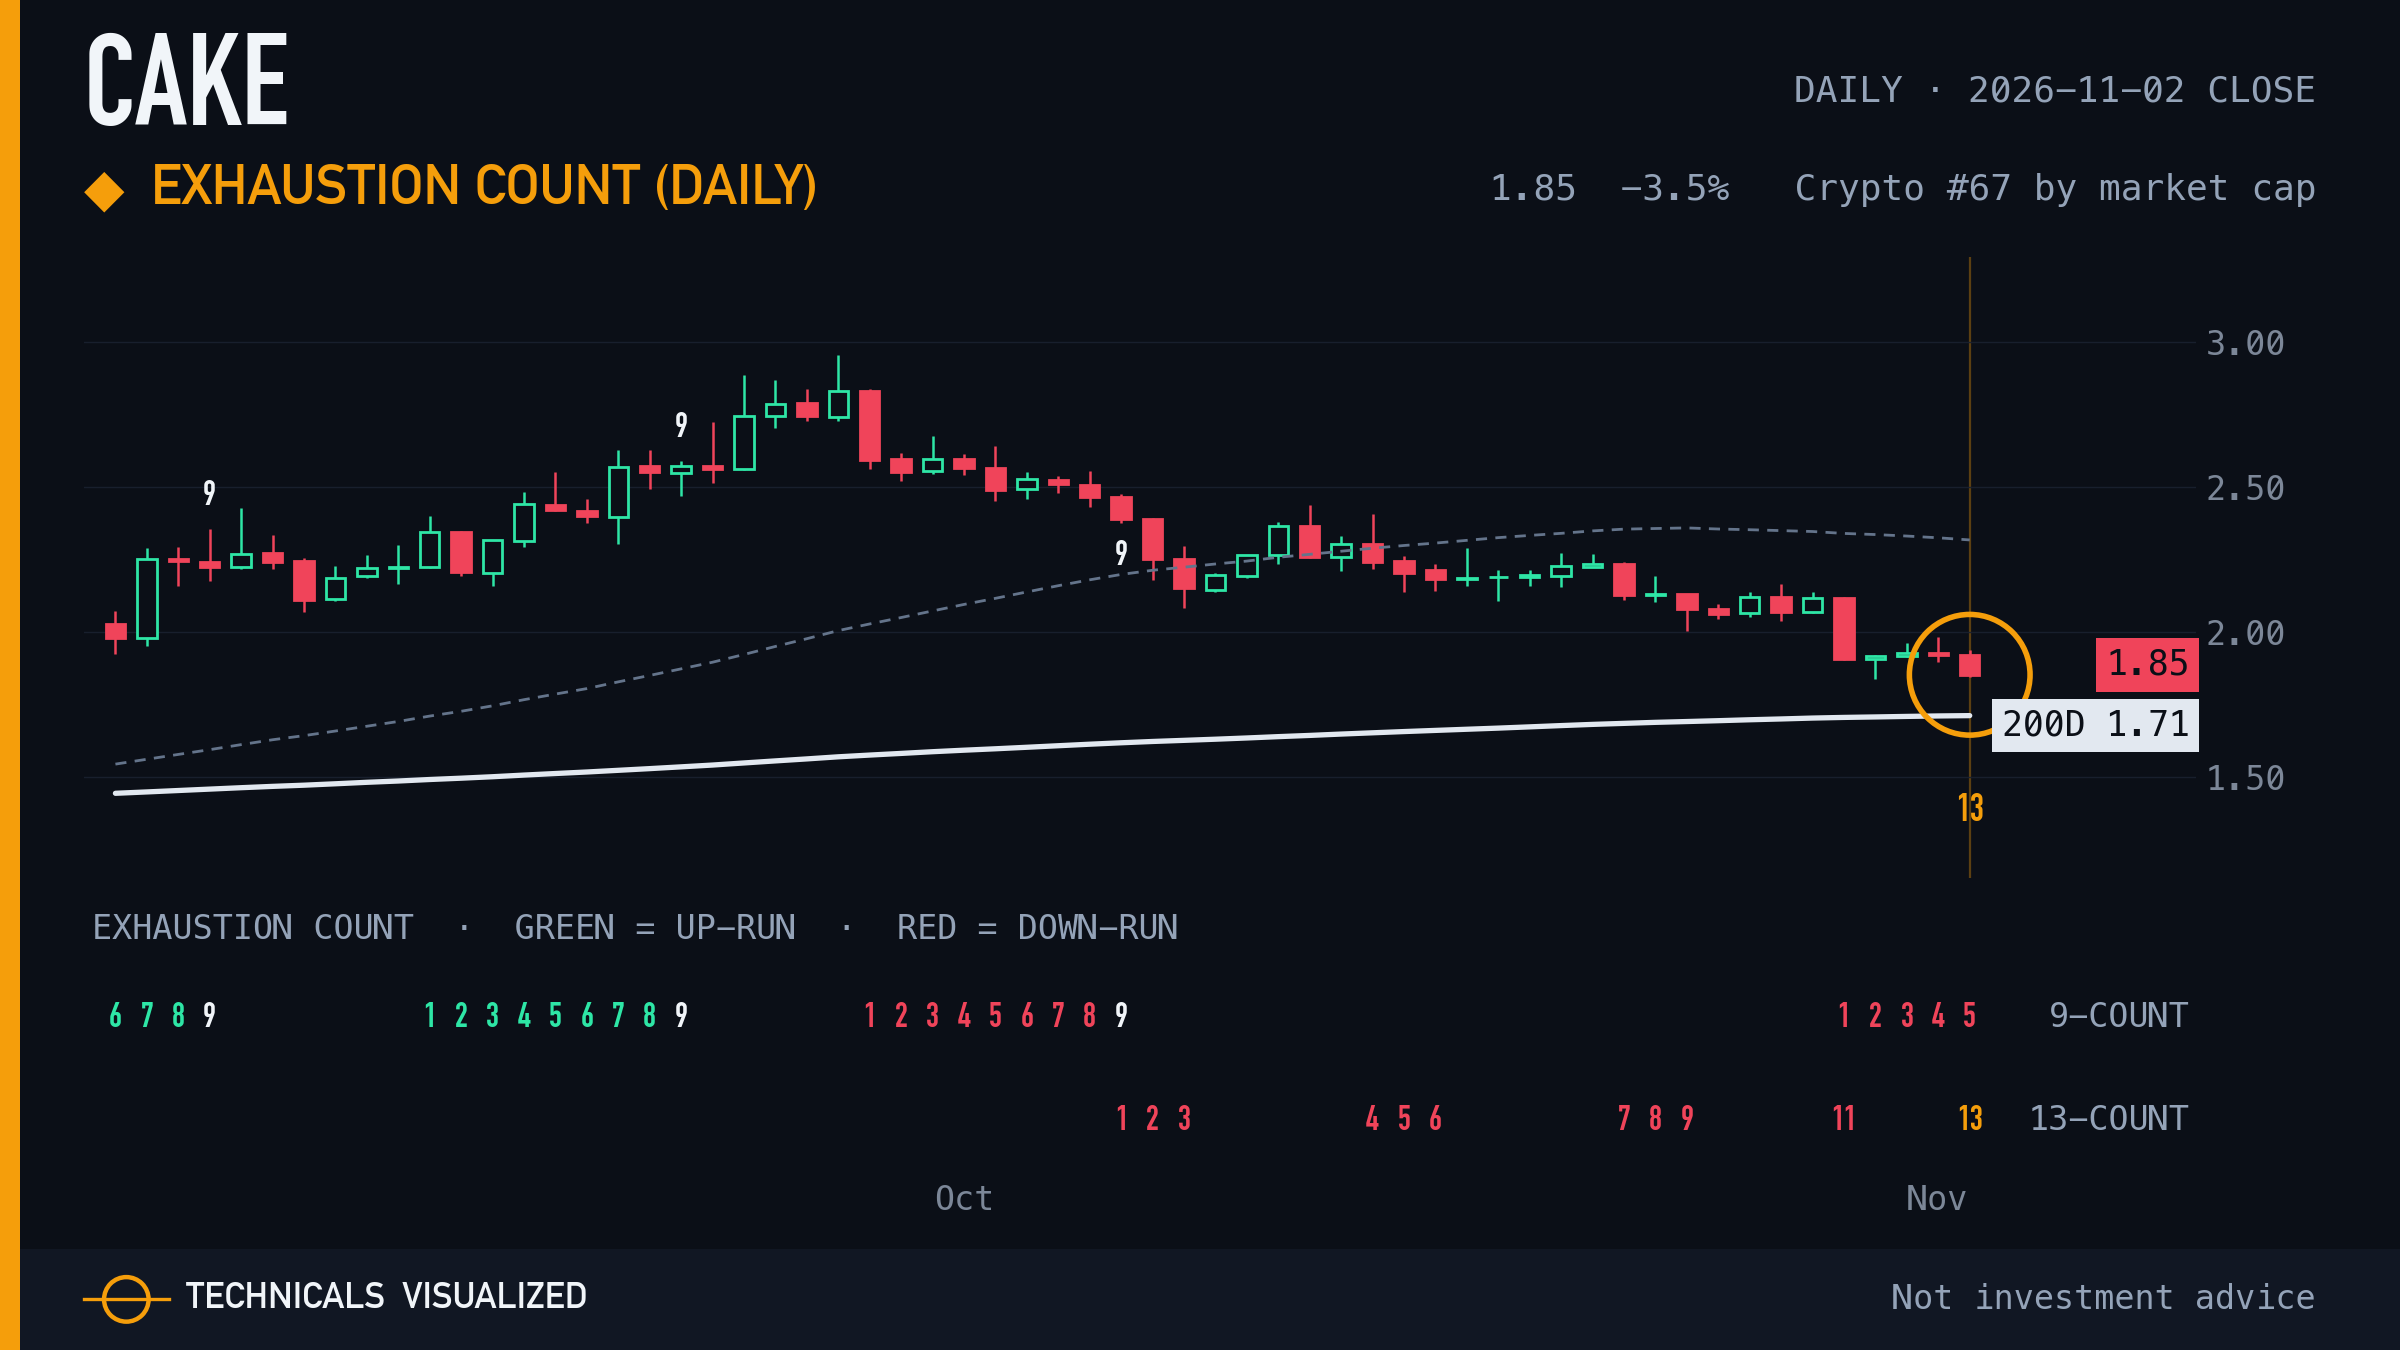
PancakeSwap daily exhaustion count: count complete, 13 of 13 (downside count).
A completed count marks a stretched move. It is a pause marker, not a turn signal.
|
|
09 · Terra Luna Classic (LUNC) · RSI 23: oversold extreme
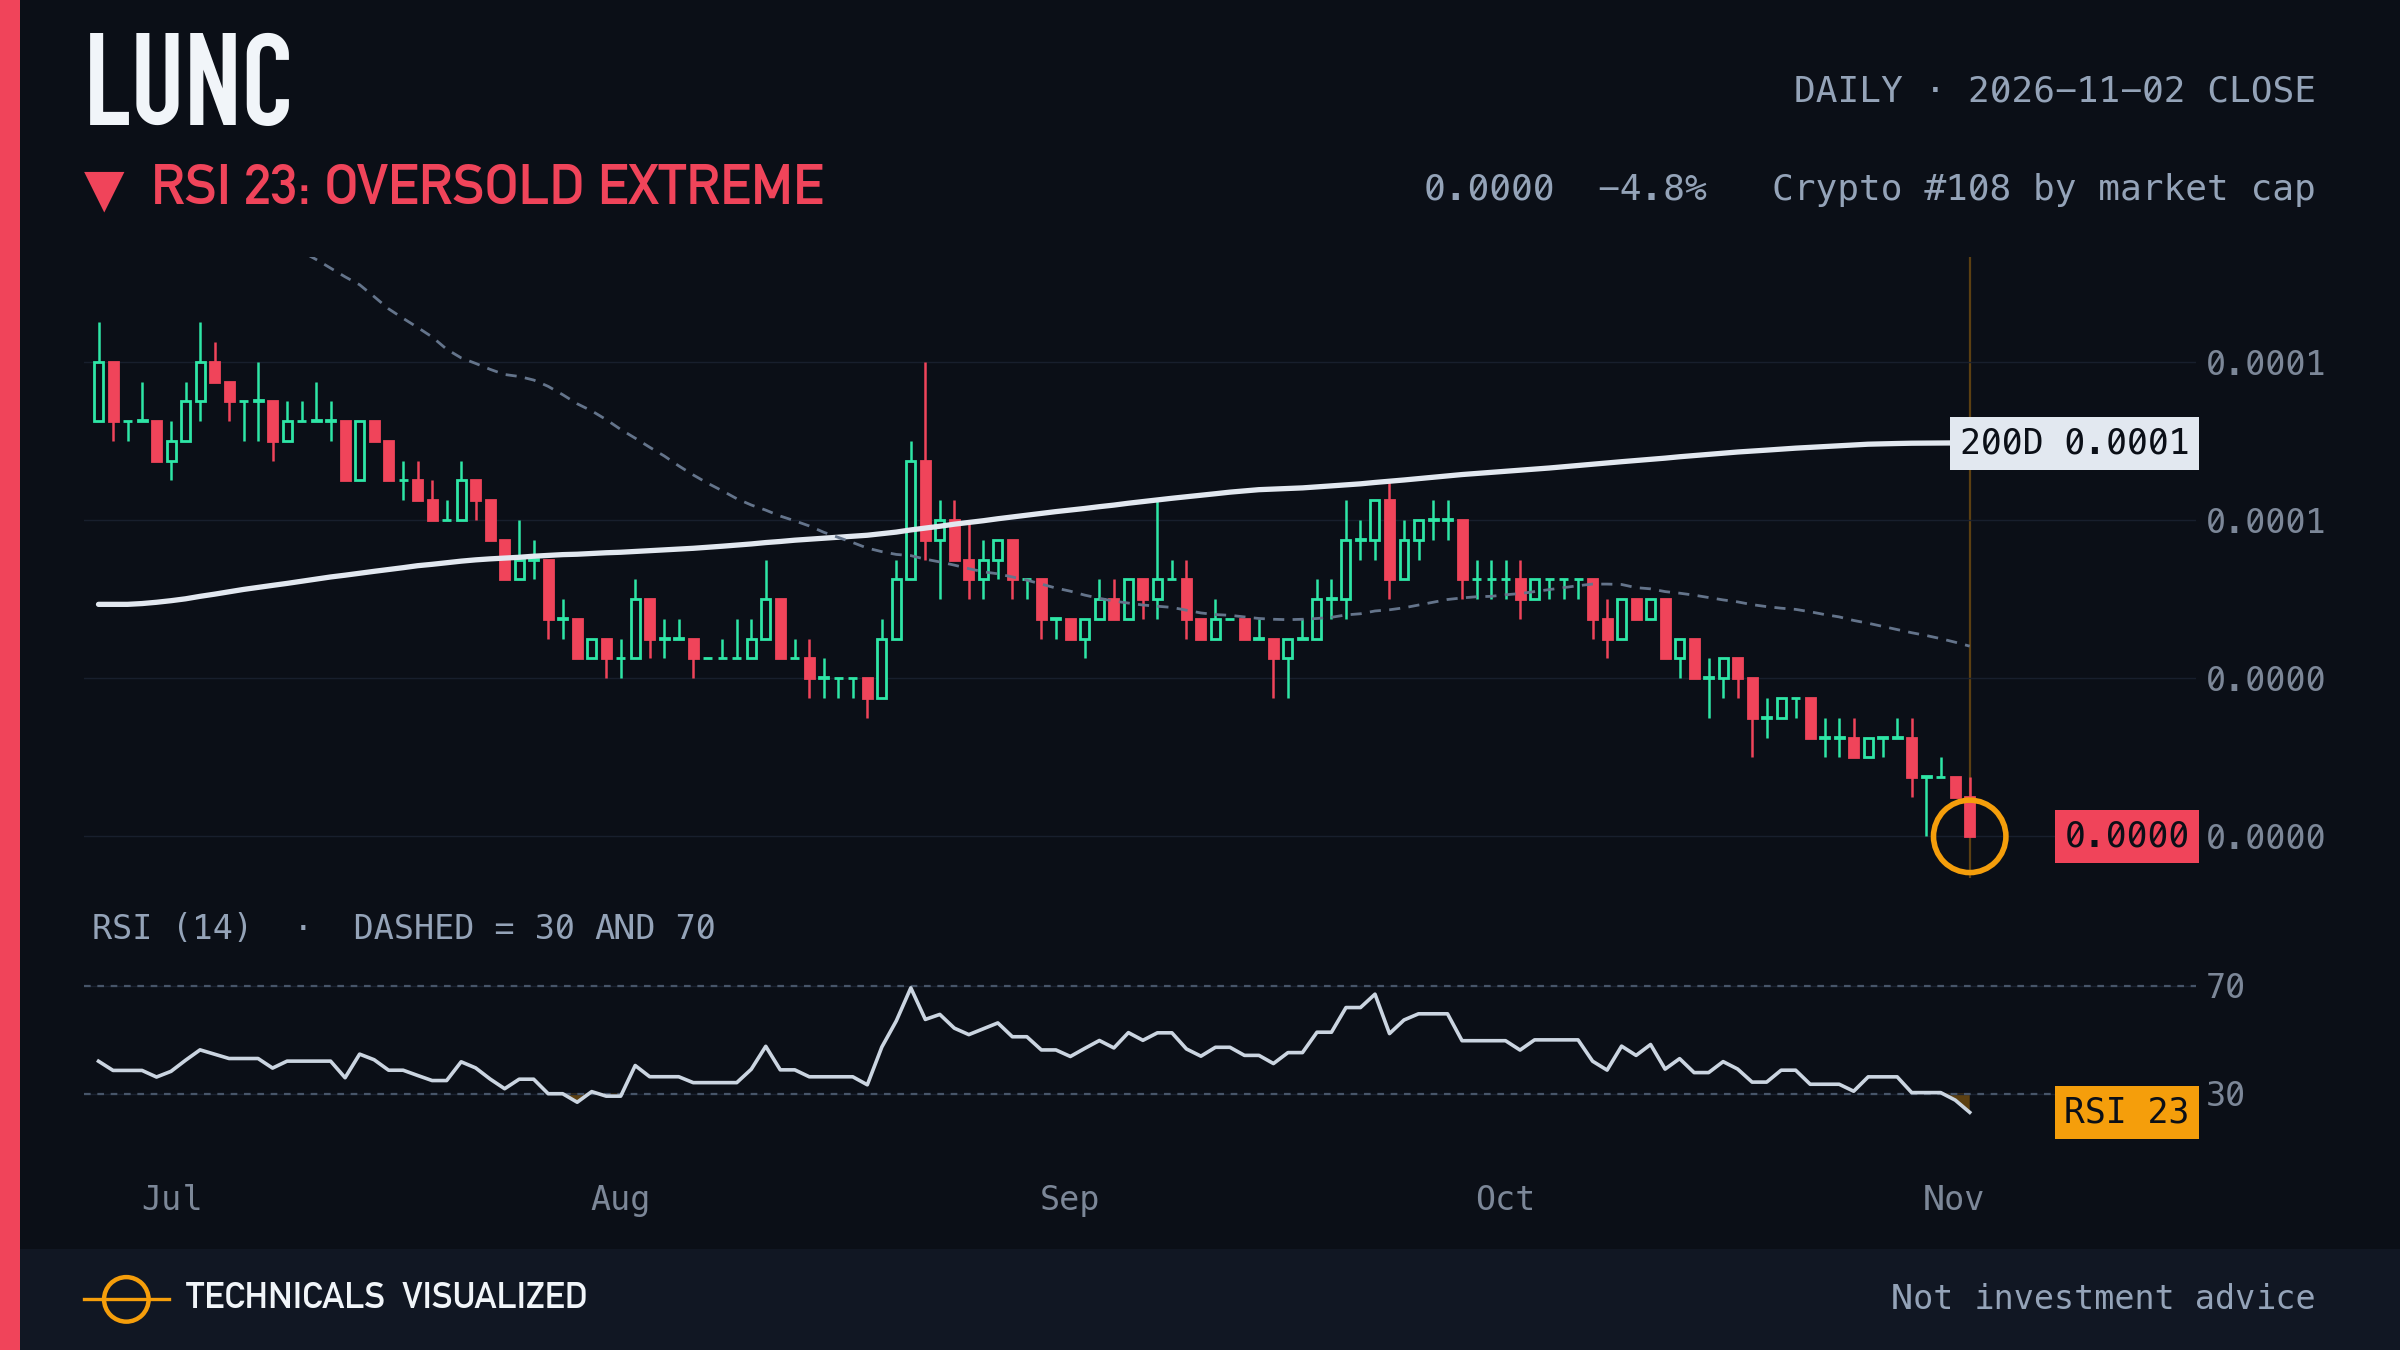
Terra Luna Classic 14-day RSI closed at 23, its most extreme reading since October 2025.
Readings this stretched describe the selling or buying already done, not when it ends.
|
 TECHNICALS VISUALIZED