MajorsThe same three every day: Bitcoin, Ethereum and Solana. Hyperliquid and Zcash join when they print a reading. |
|
01 · Bitcoin (BTC) · Daily chart
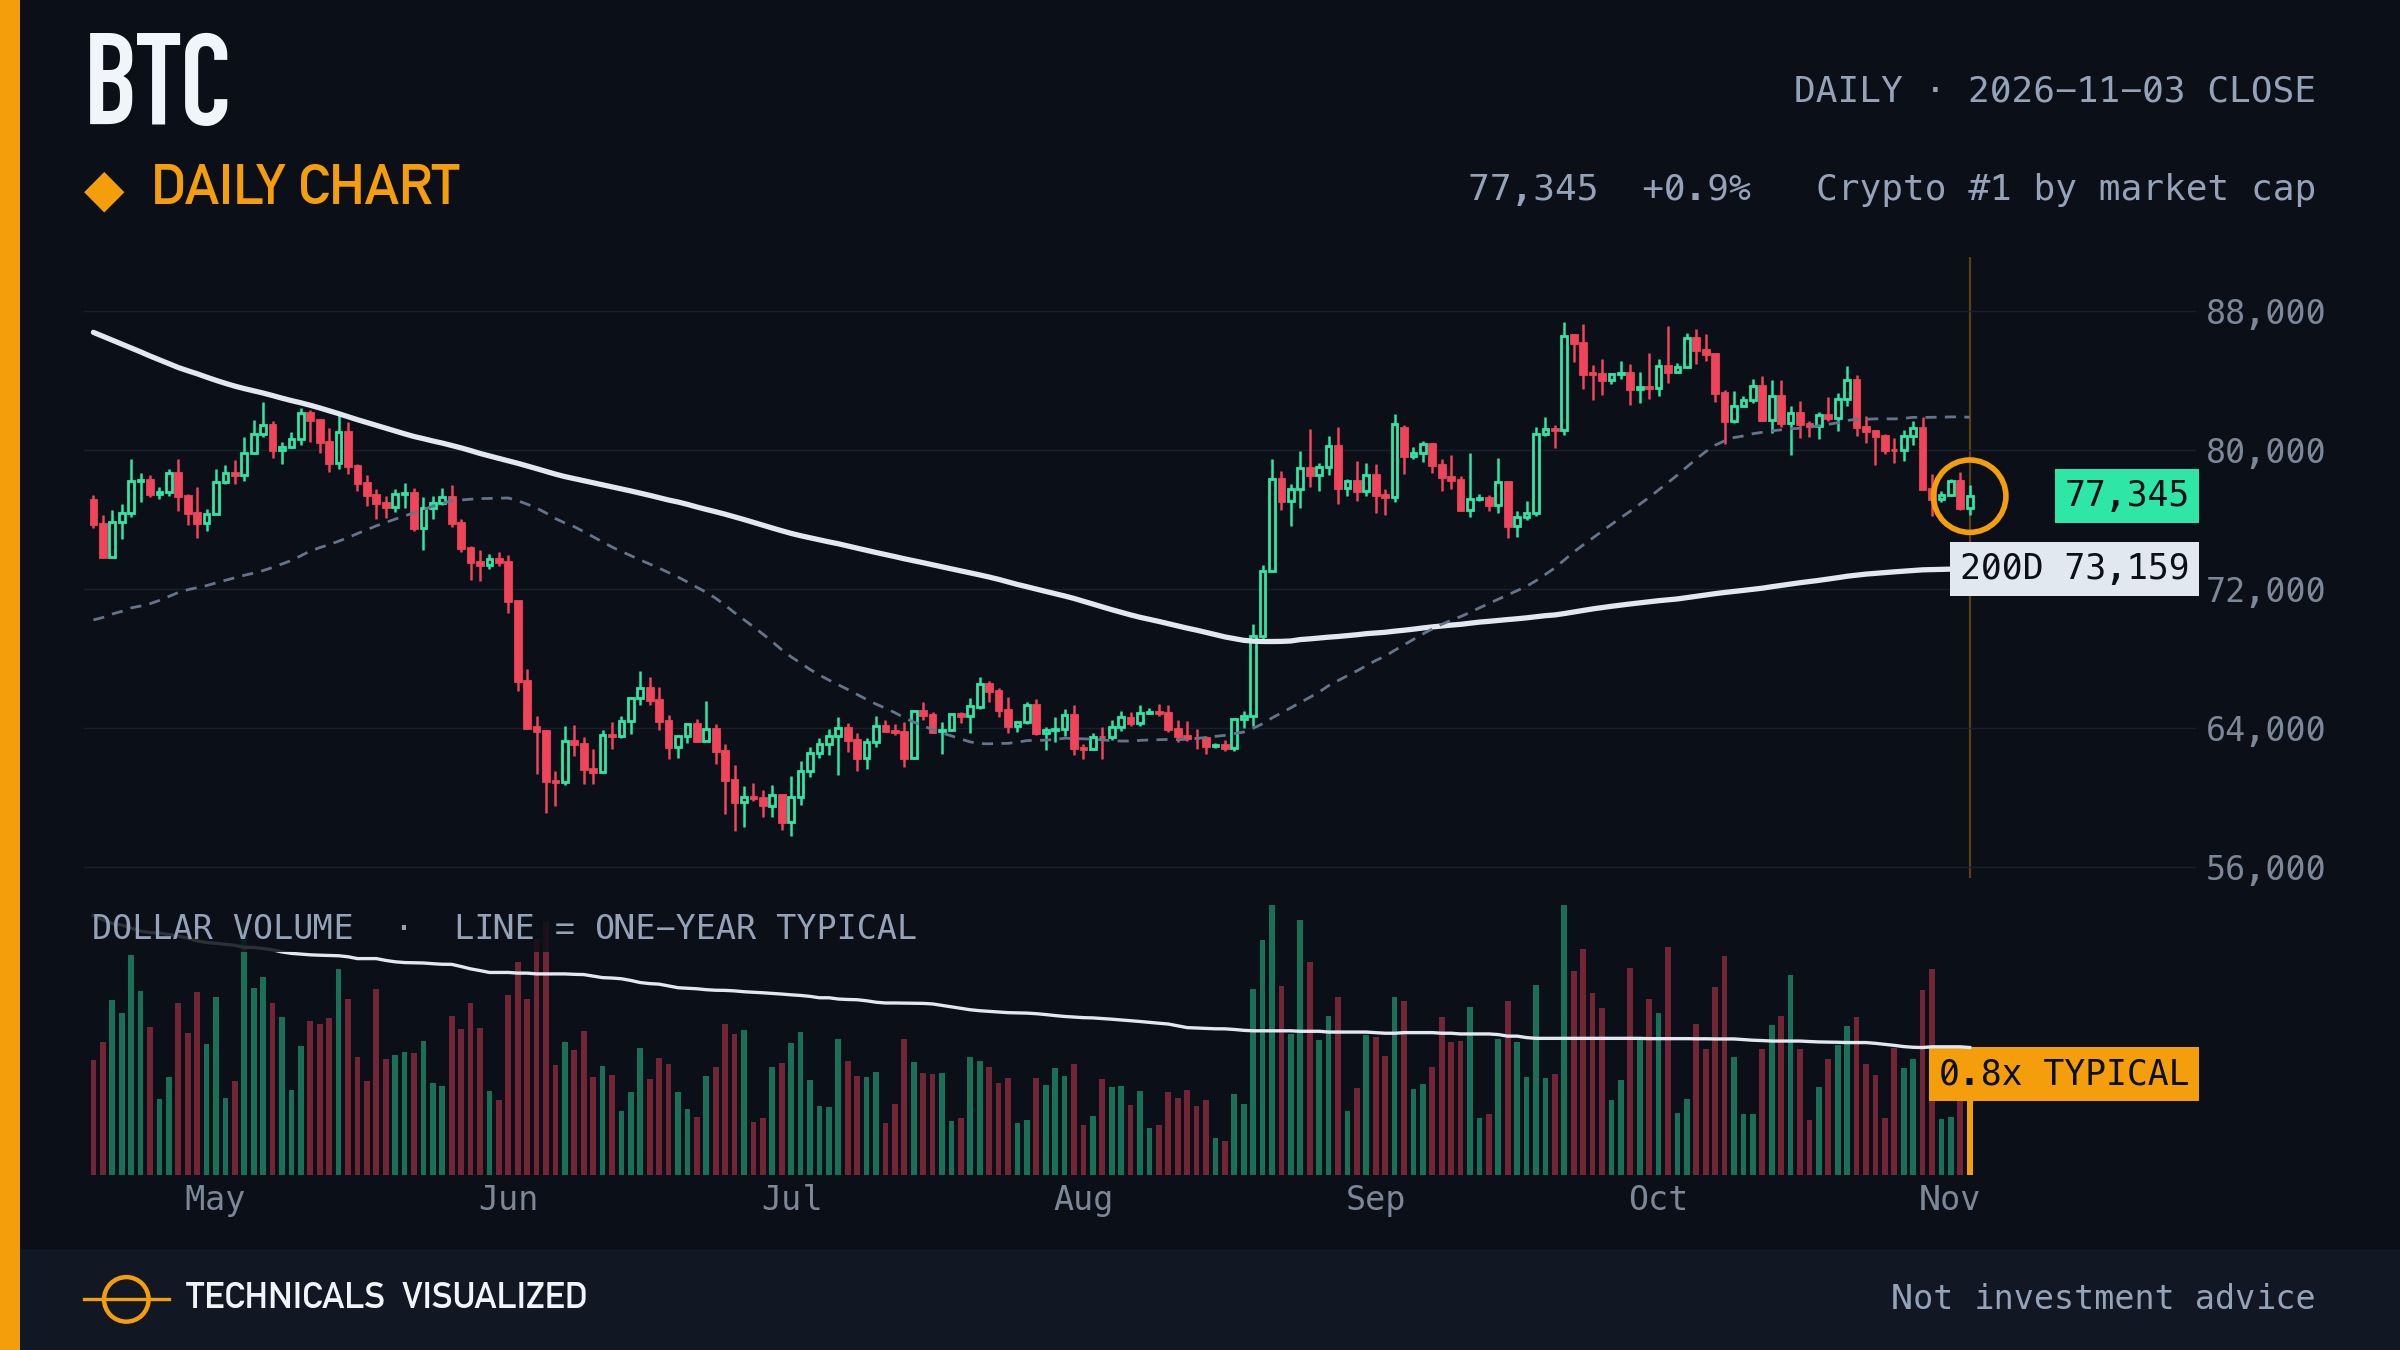
Bitcoin closed at $77,345, +0.9% on the day, 5.7% above its 200-day average.
Shown in every edition, whether or not it printed a reading. The amber ring marks this close.
|
|
02 · Ethereum (ETH) · Daily chart
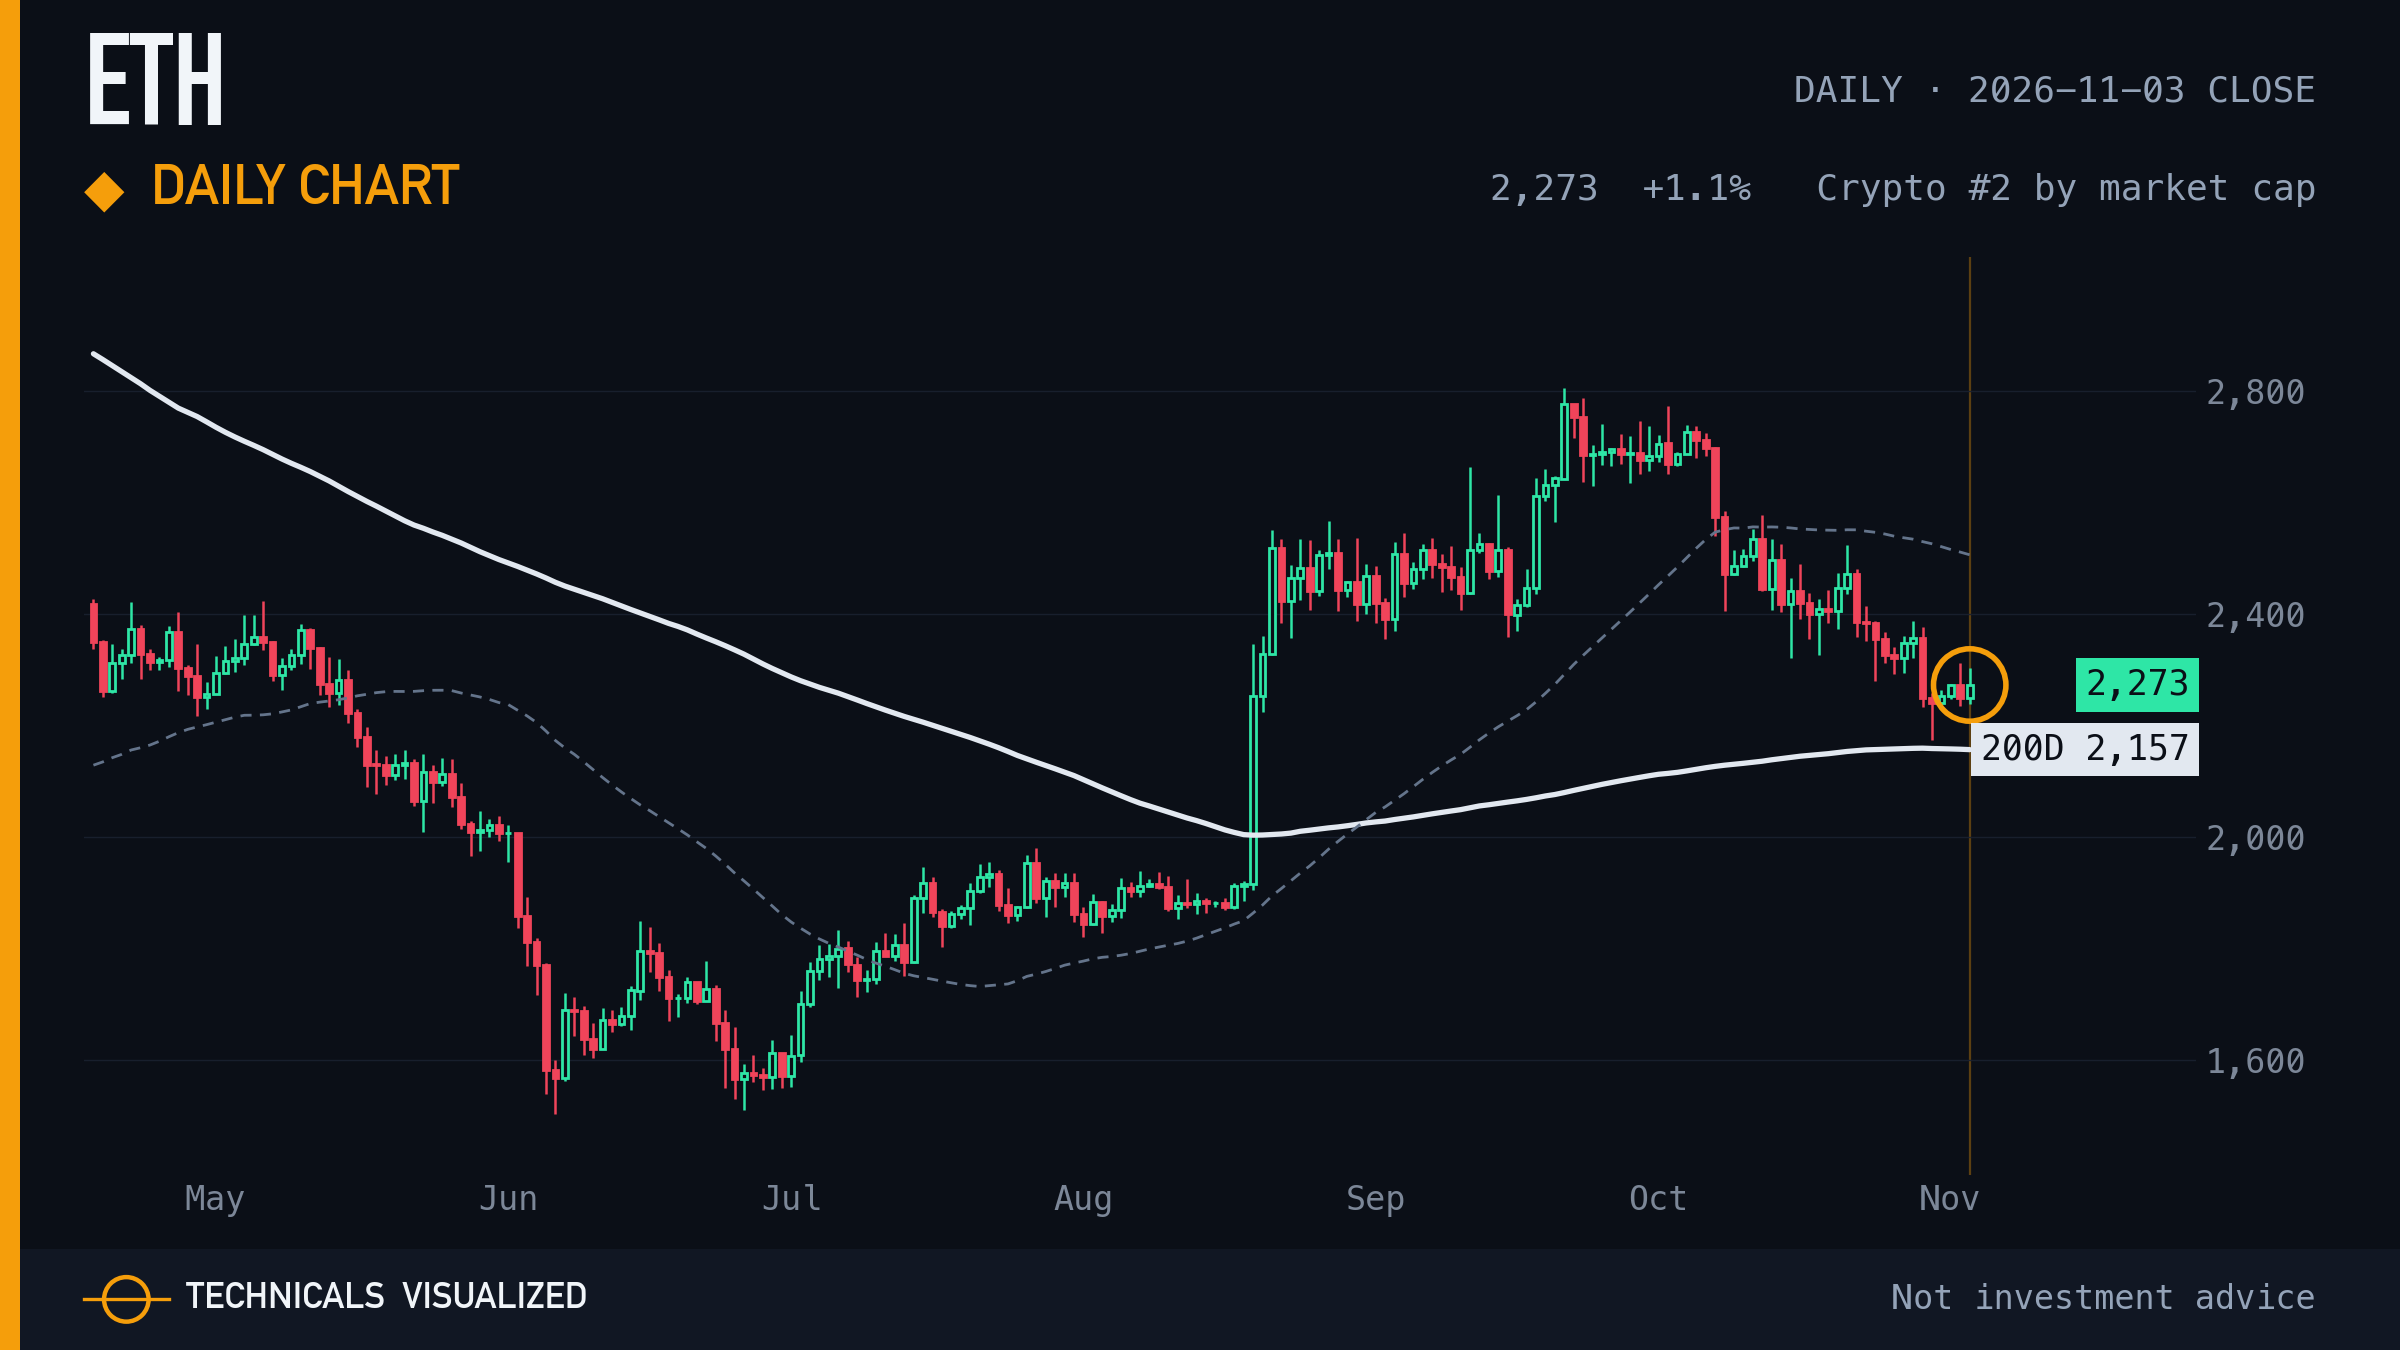
Ethereum closed at $2,273, +1.1% on the day, 5.4% above its 200-day average.
Shown in every edition, whether or not it printed a reading. The amber ring marks this close.
|
|
03 · Solana (SOL) · Daily chart
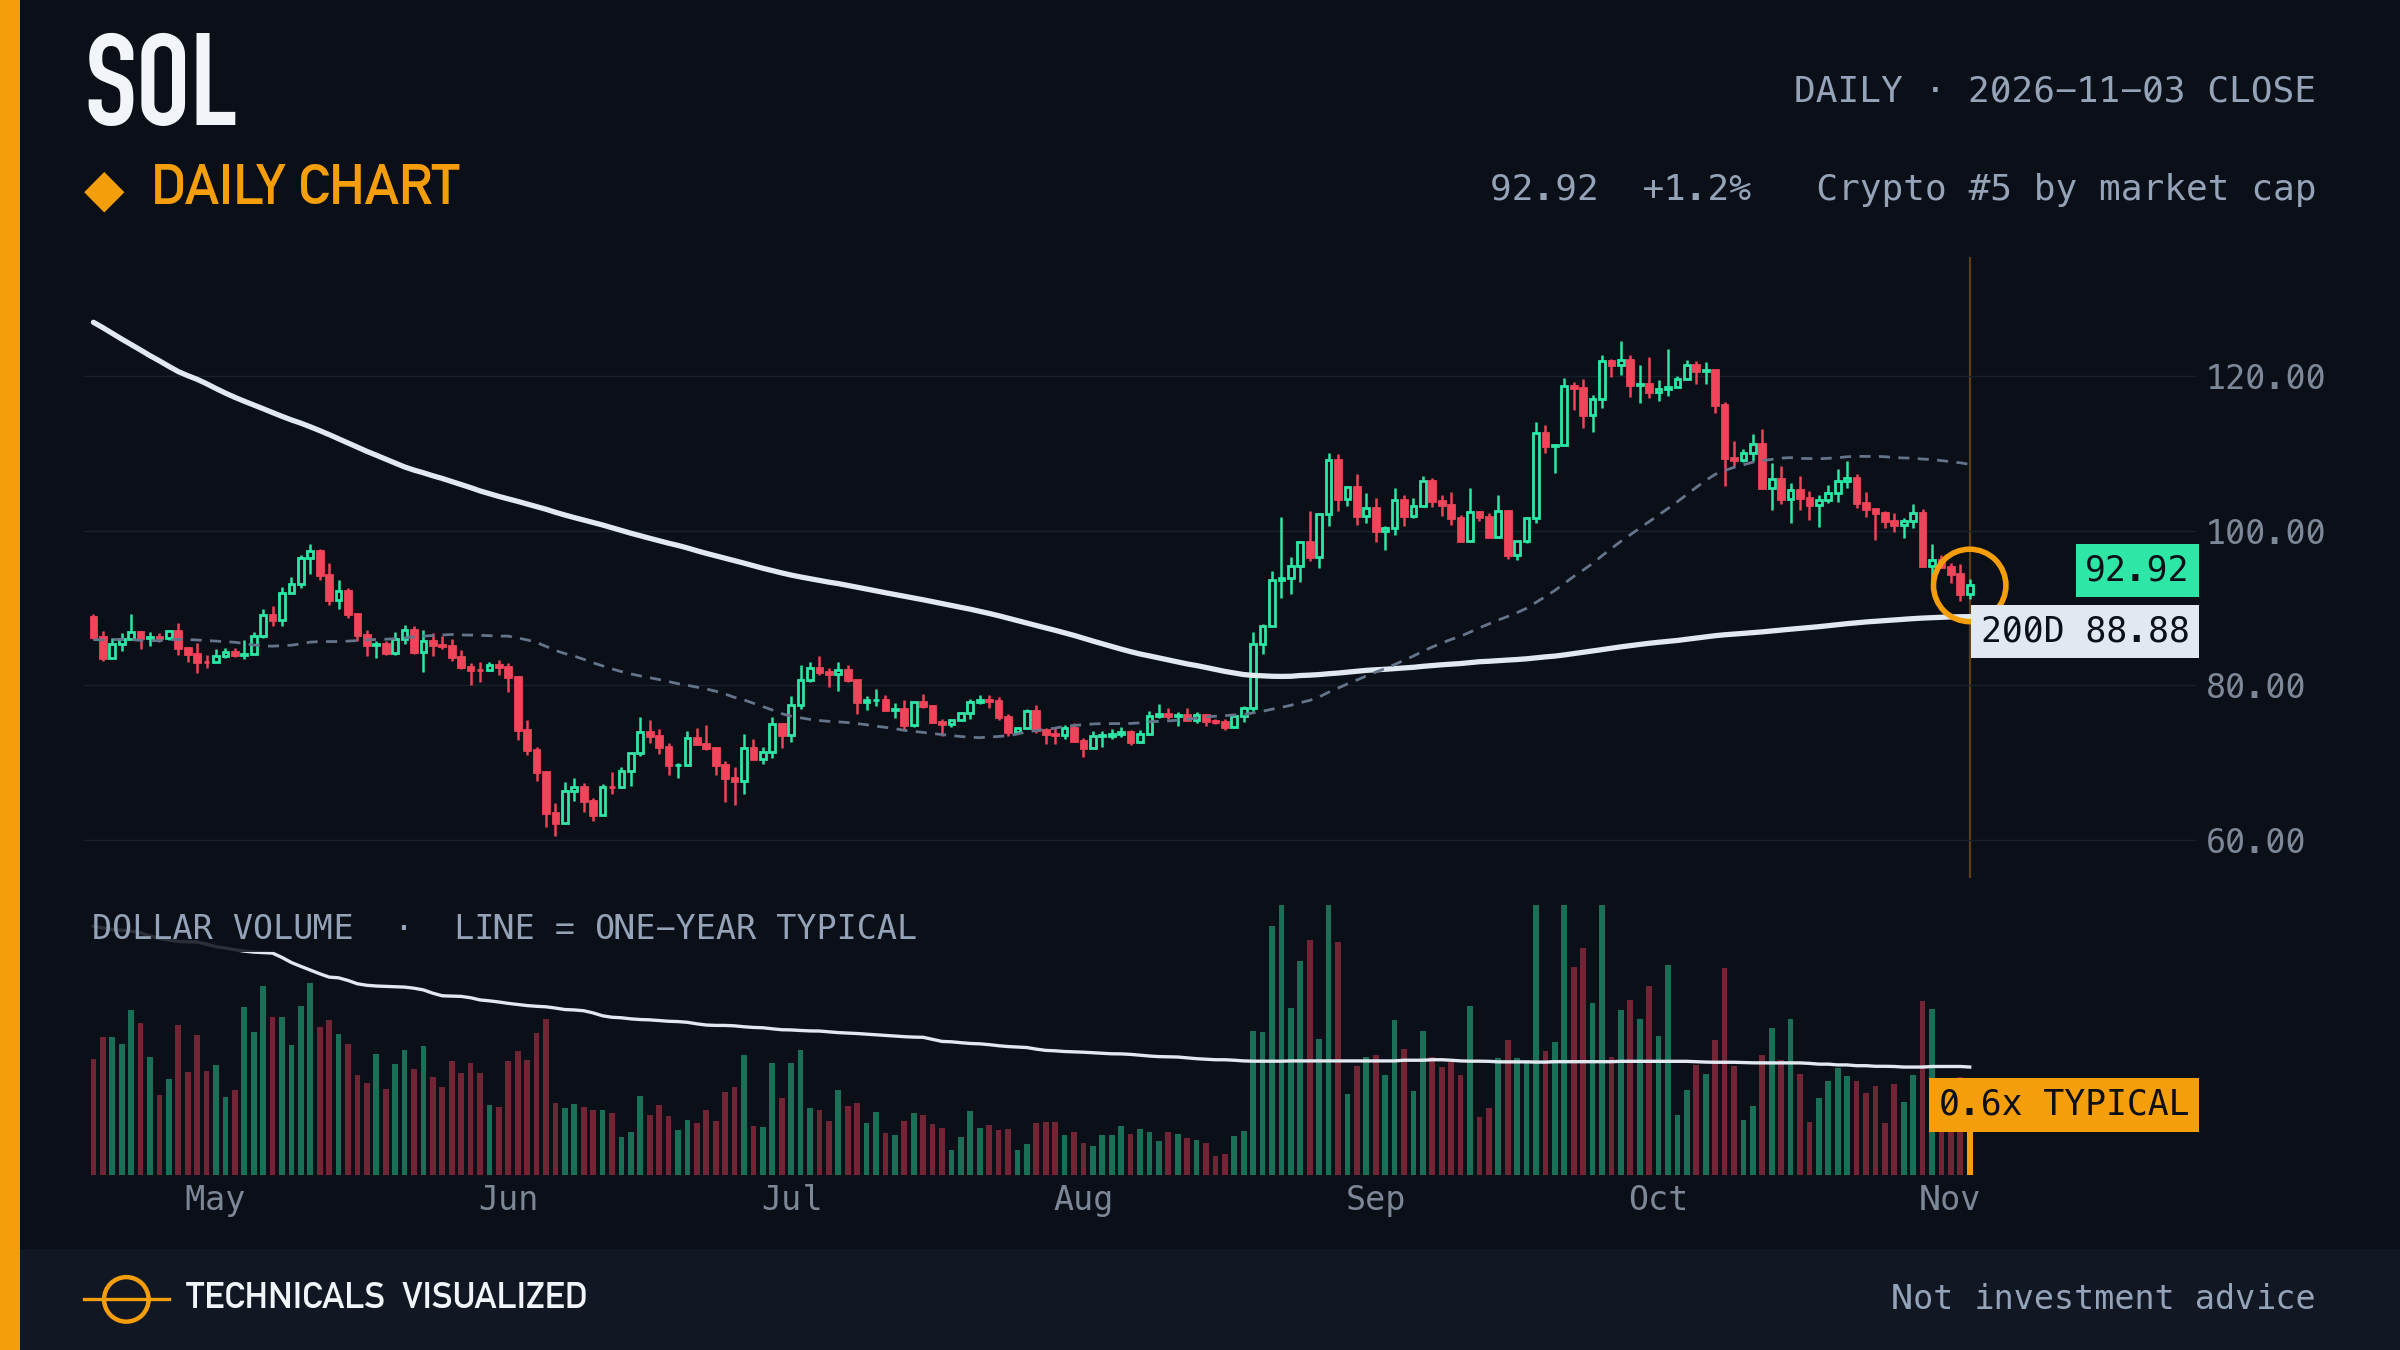
Solana closed at $92.92, +1.2% on the day, 4.5% above its 200-day average.
Shown in every edition, whether or not it printed a reading. The amber ring marks this close.
|
Today's readings |
|
04 · THORChain (RUNE) · Volume surge
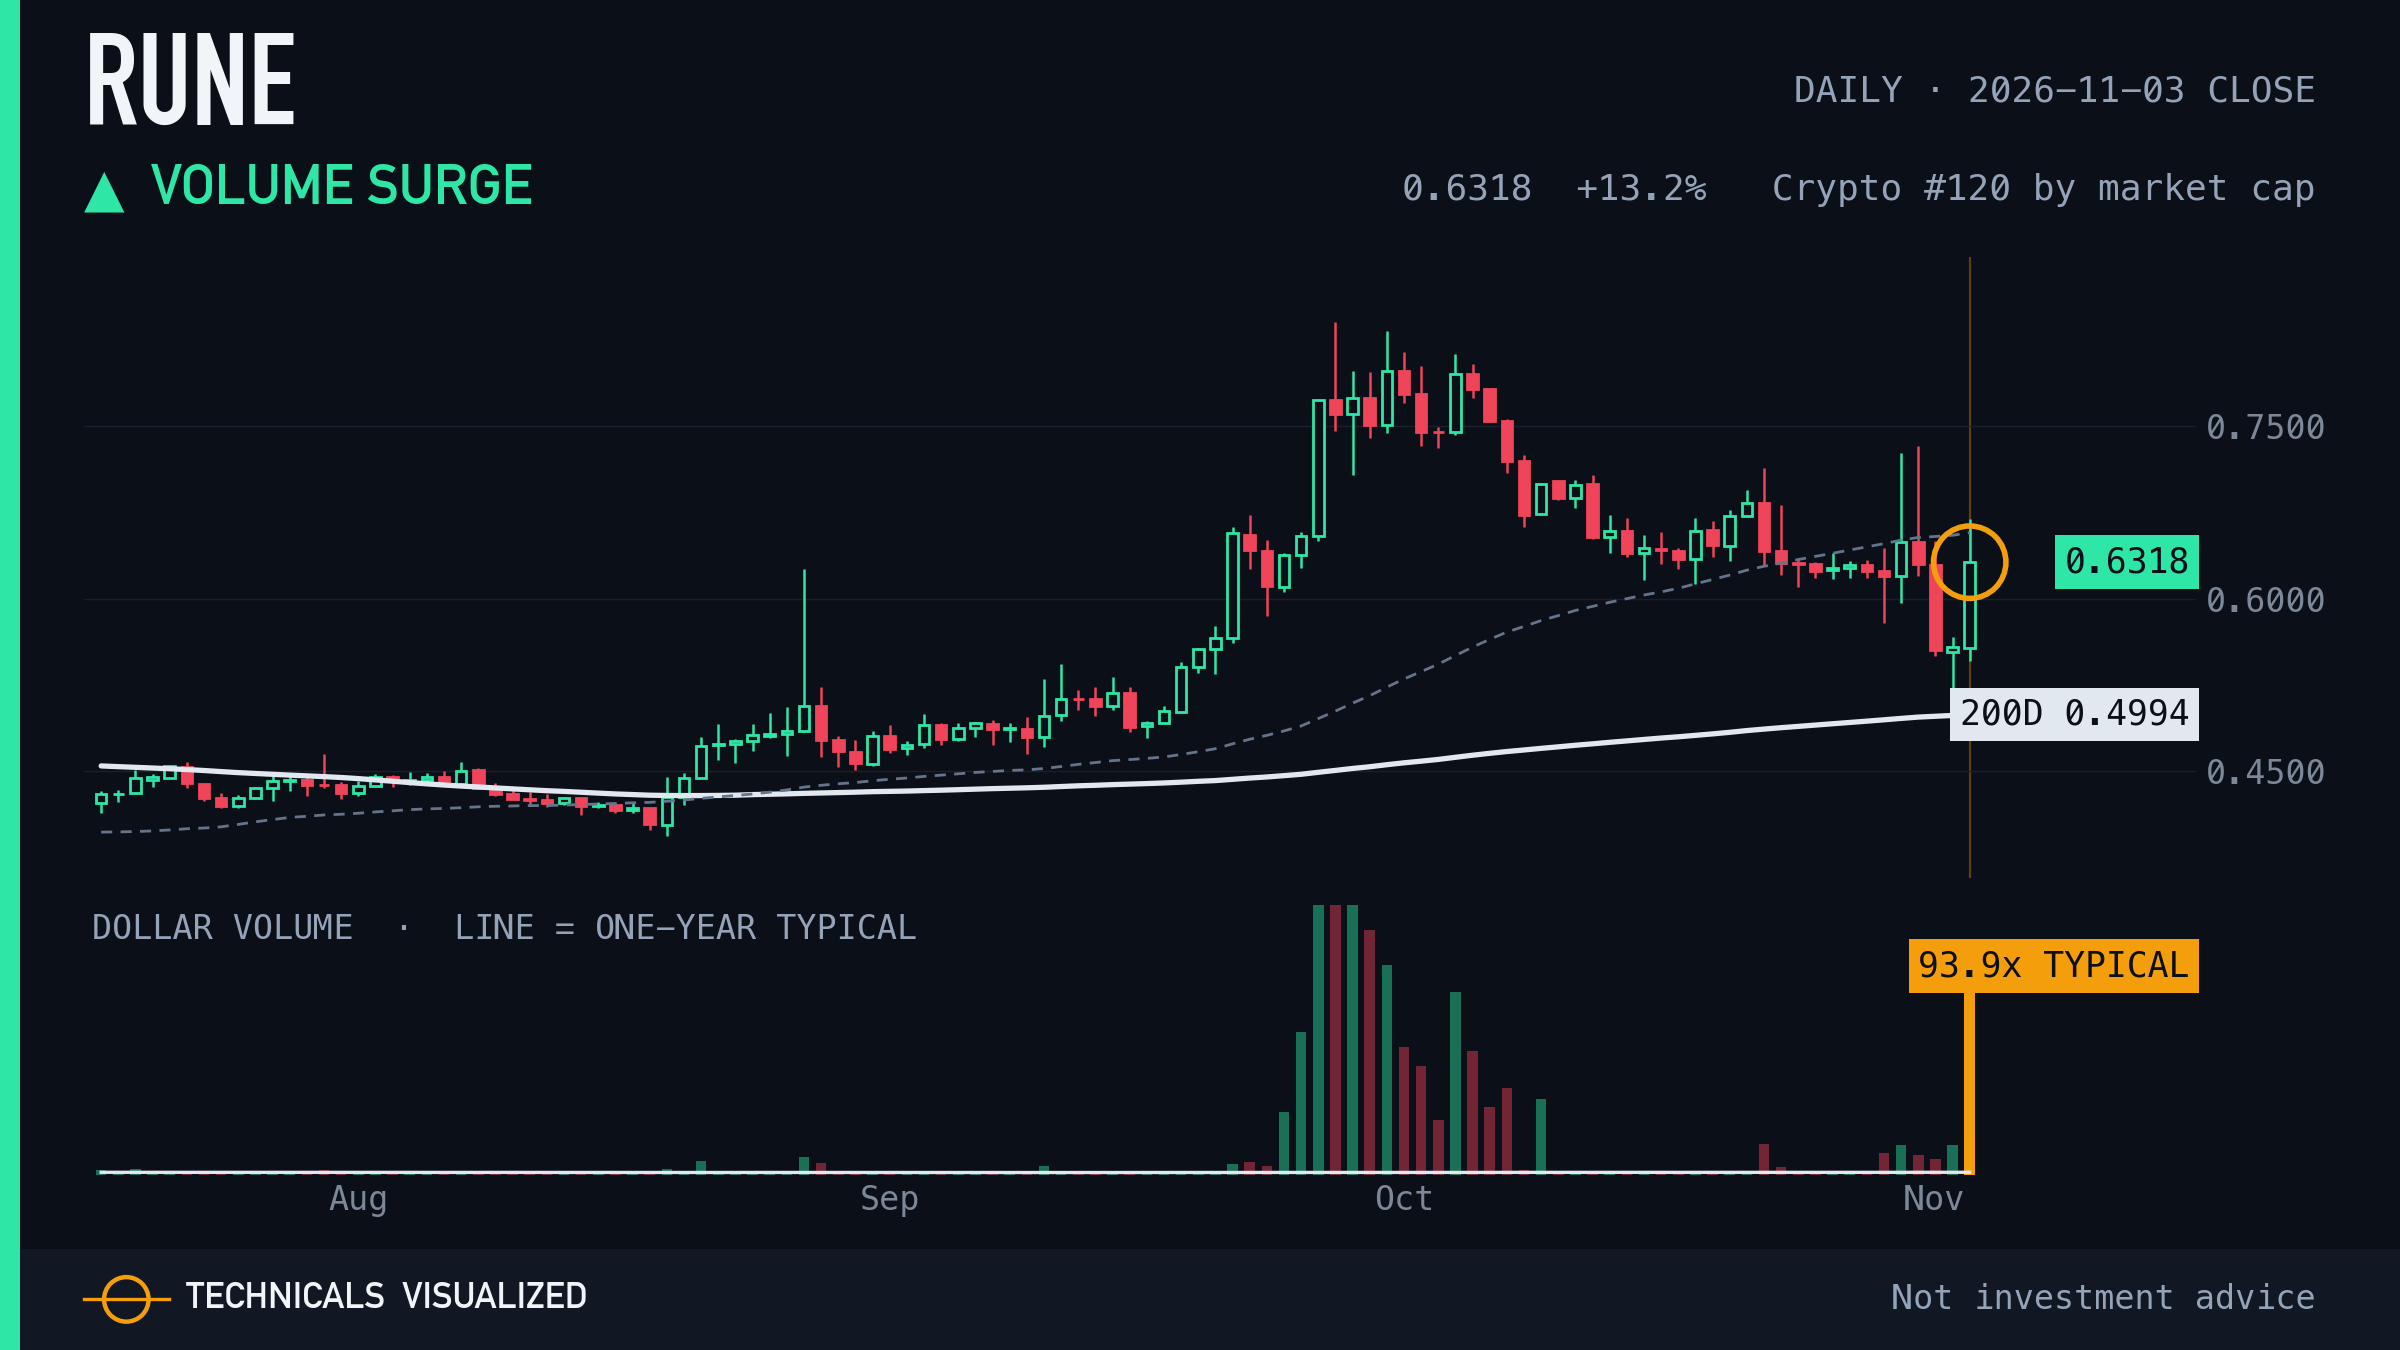
THORChain traded 93.9x its typical dollar volume on a +13.2% move.
One session, measured against this chart's own usual move. It describes the day, not the next one.
|
|
05 · Monero (XMR) · Range breakout
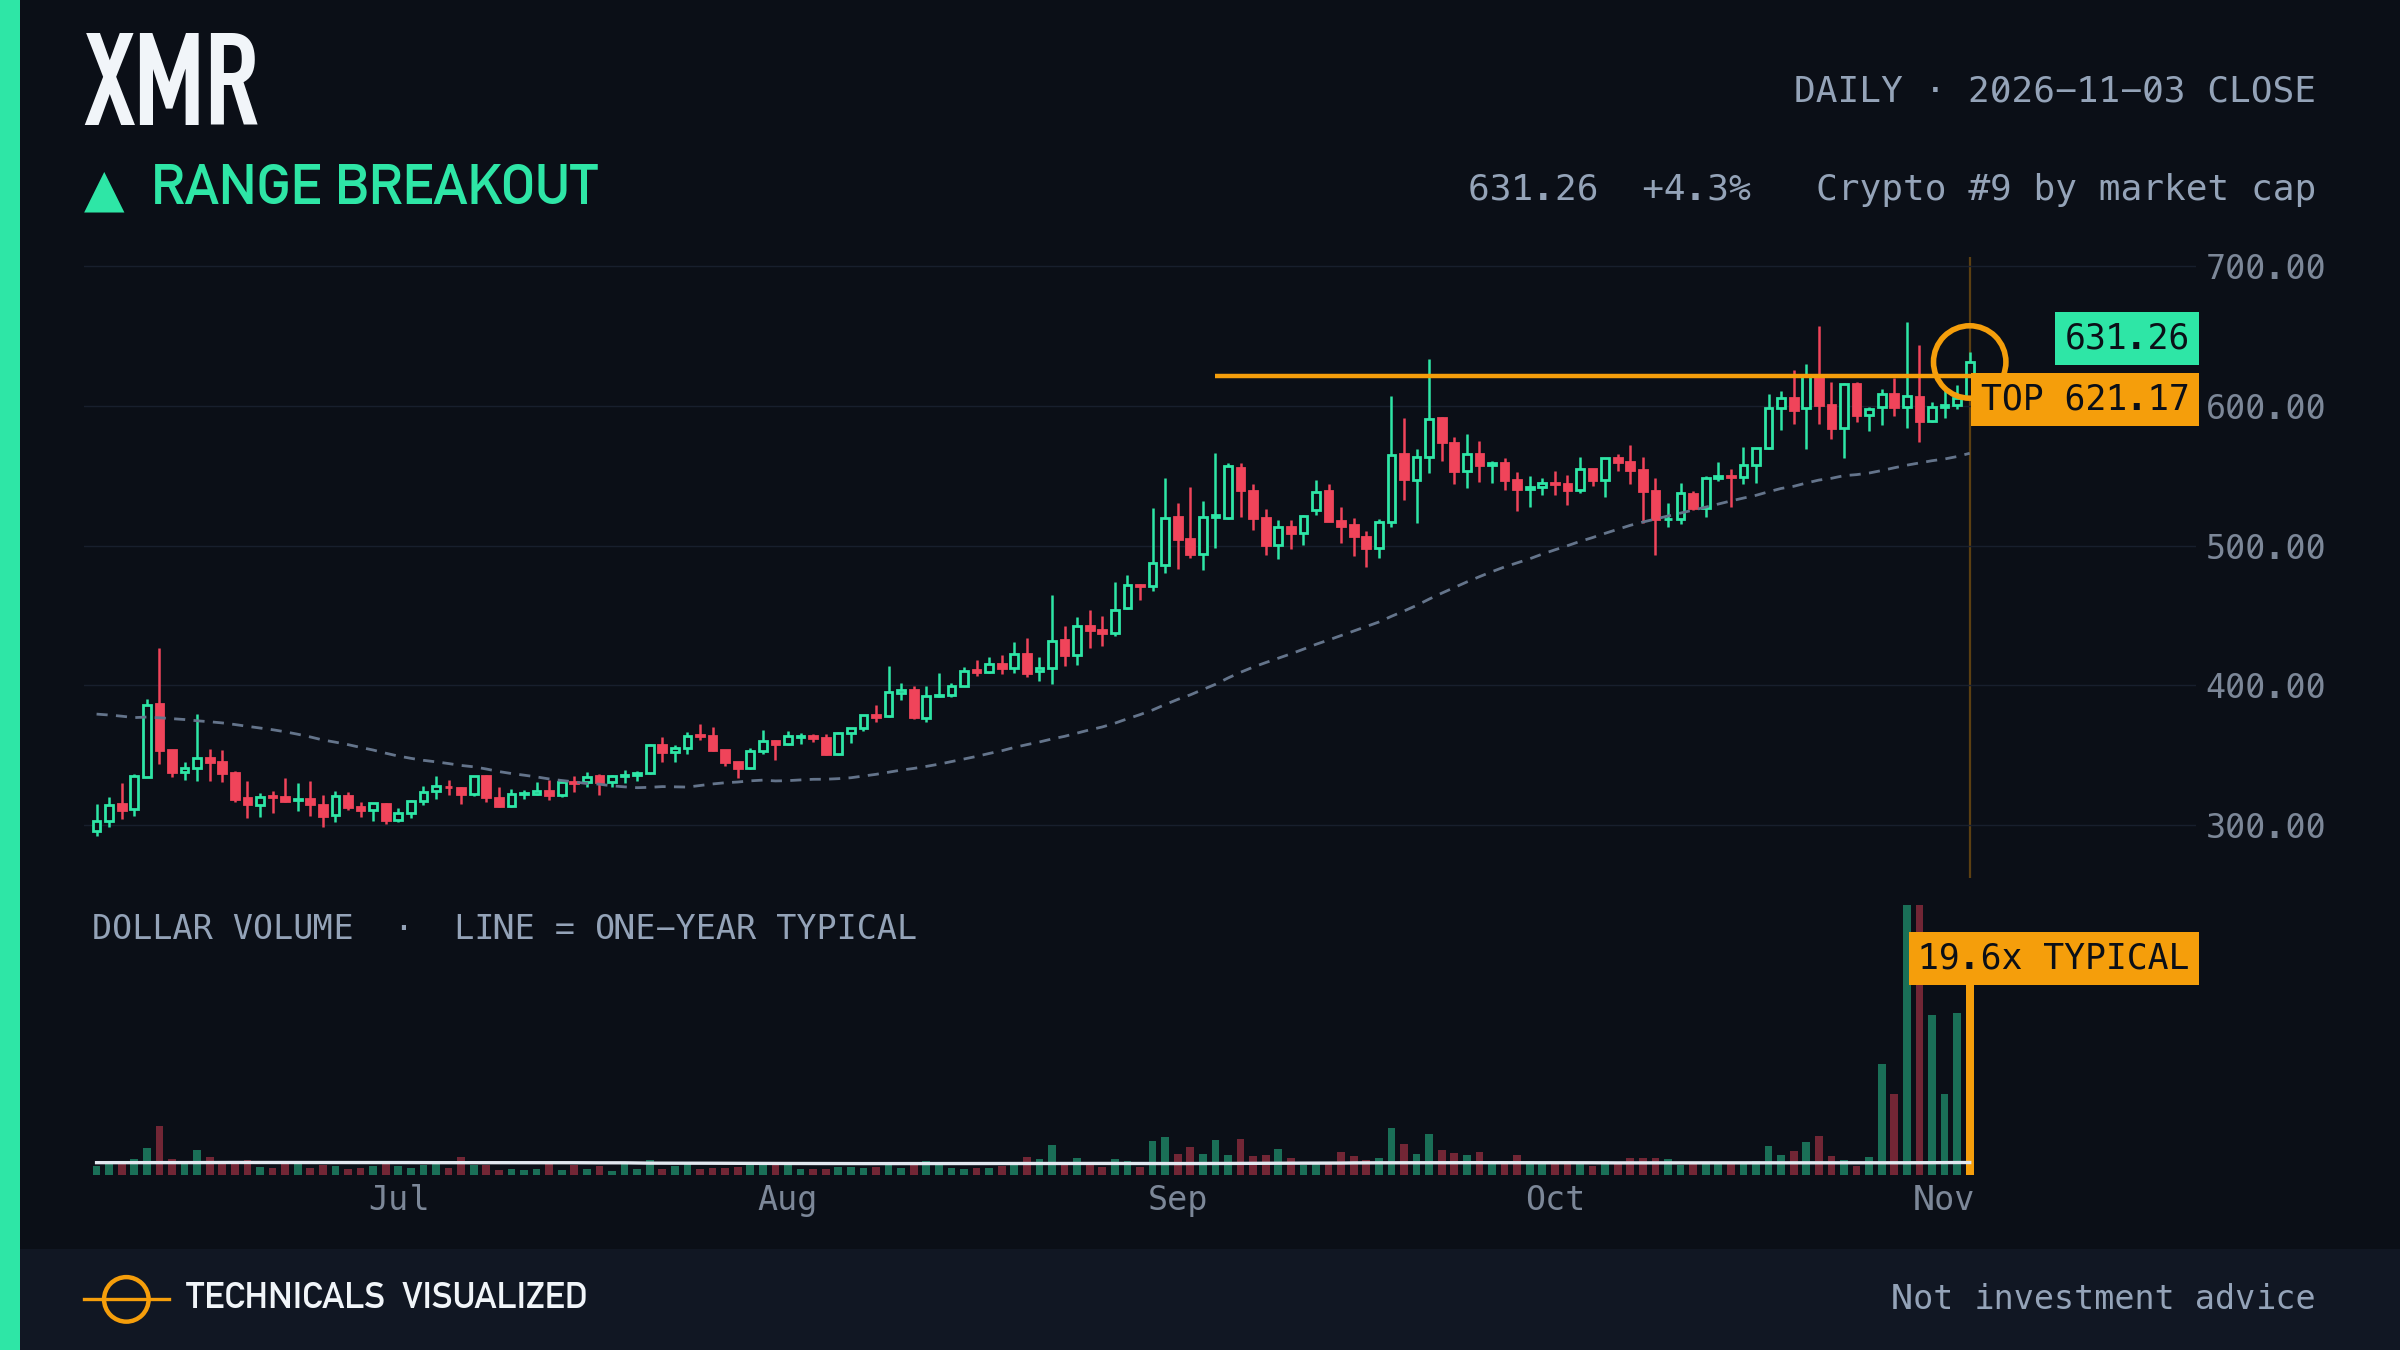
Monero closed above a 60-session range (24.7% tall, top tested 6 times).
The range top is $621.17. A close back inside the range undoes the break.
|
|
06 · Cosmos Hub (ATOM) · Relative strength: one-year low
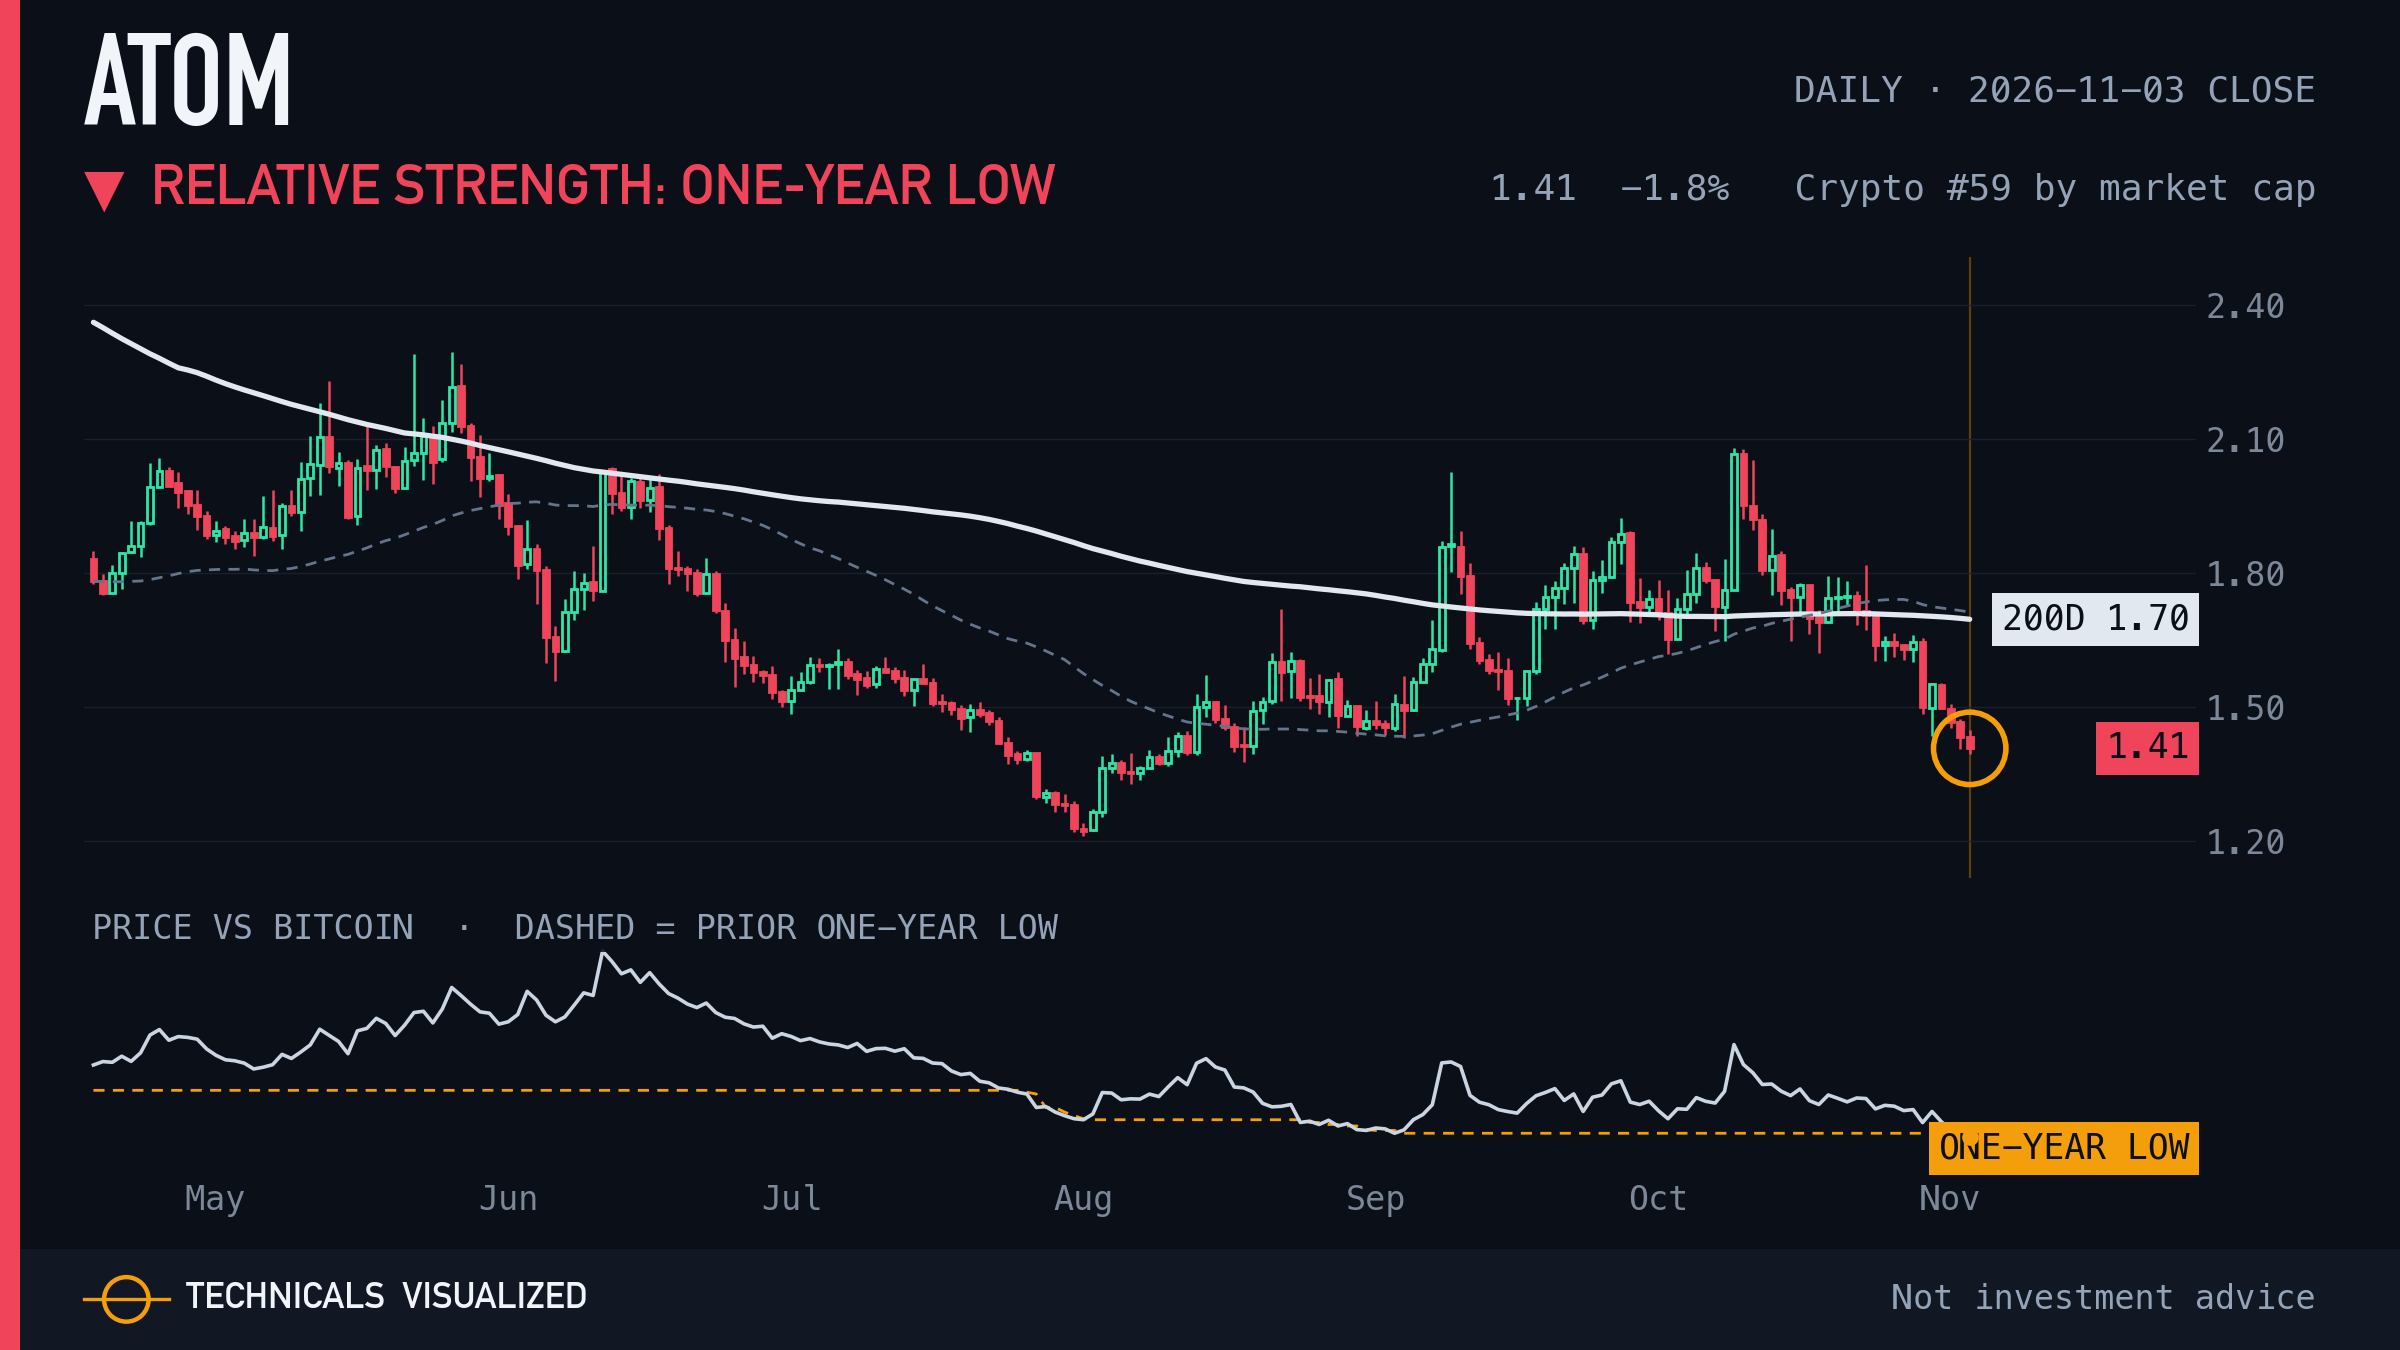
Cosmos Hub price relative to the benchmark made its first one-year low in 60+ sessions.
Measured against Bitcoin.
|
|
07 · Stellar (XLM) · Exhaustion count (daily)
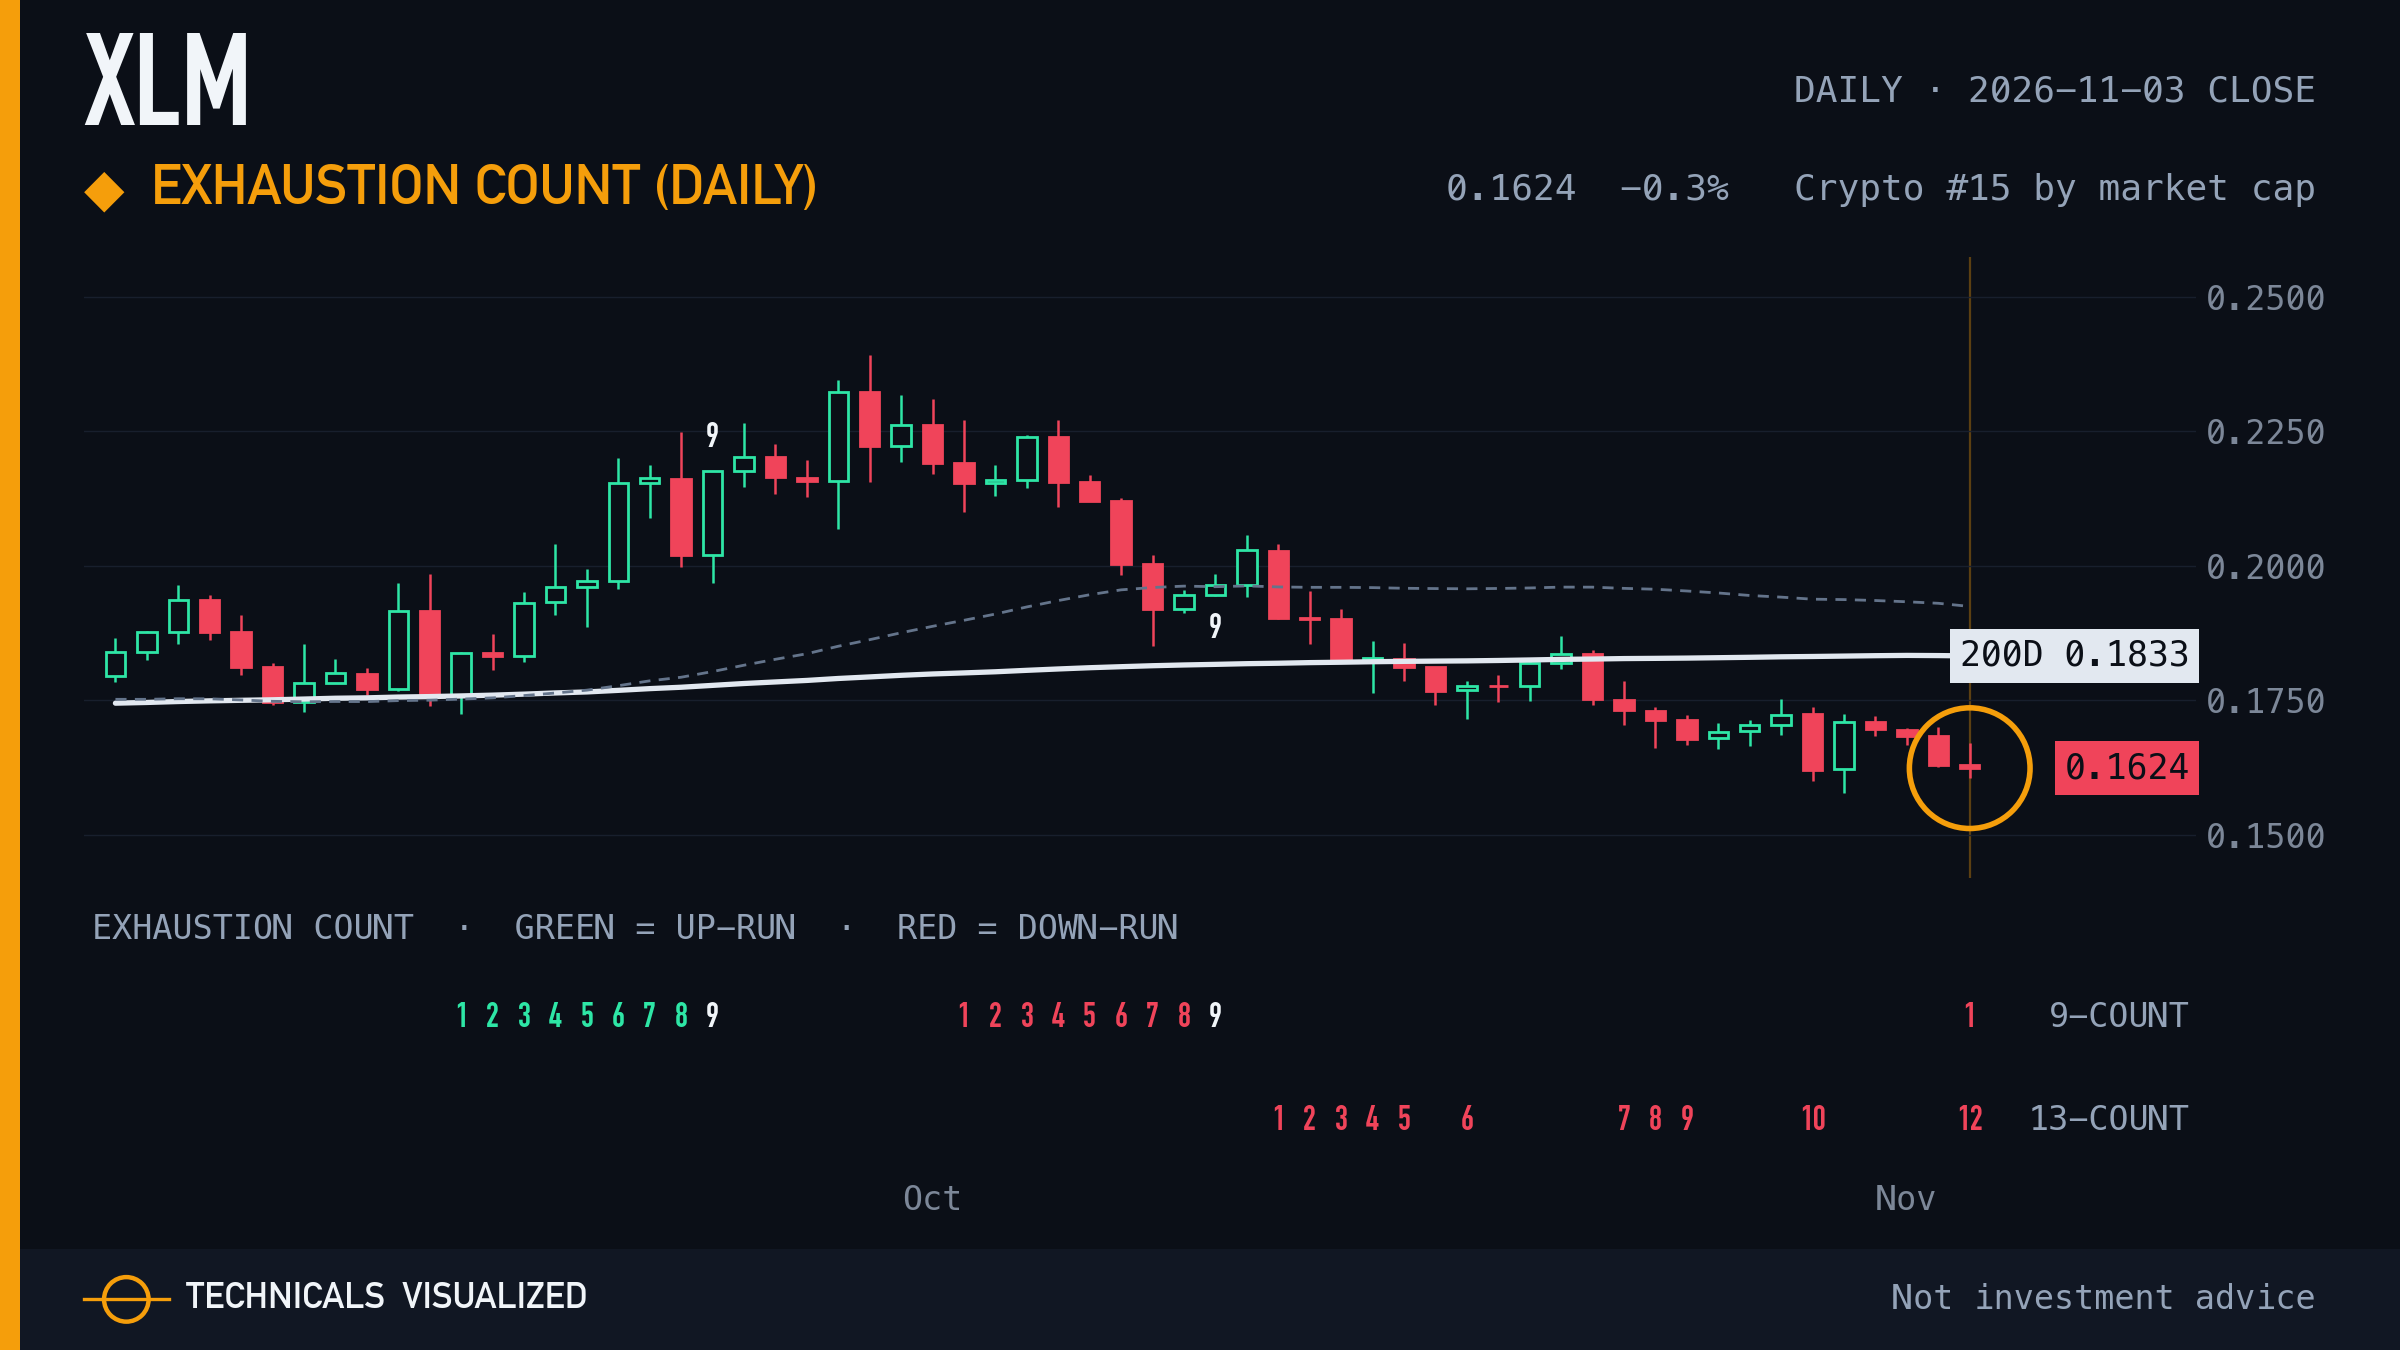
Stellar daily exhaustion count: count at 12 of 13 (downside count).
One bar short of a completed count. A count marks a stretched move, not a turn signal.
|
|
08 · JUST (JST) · Exhaustion count (daily)
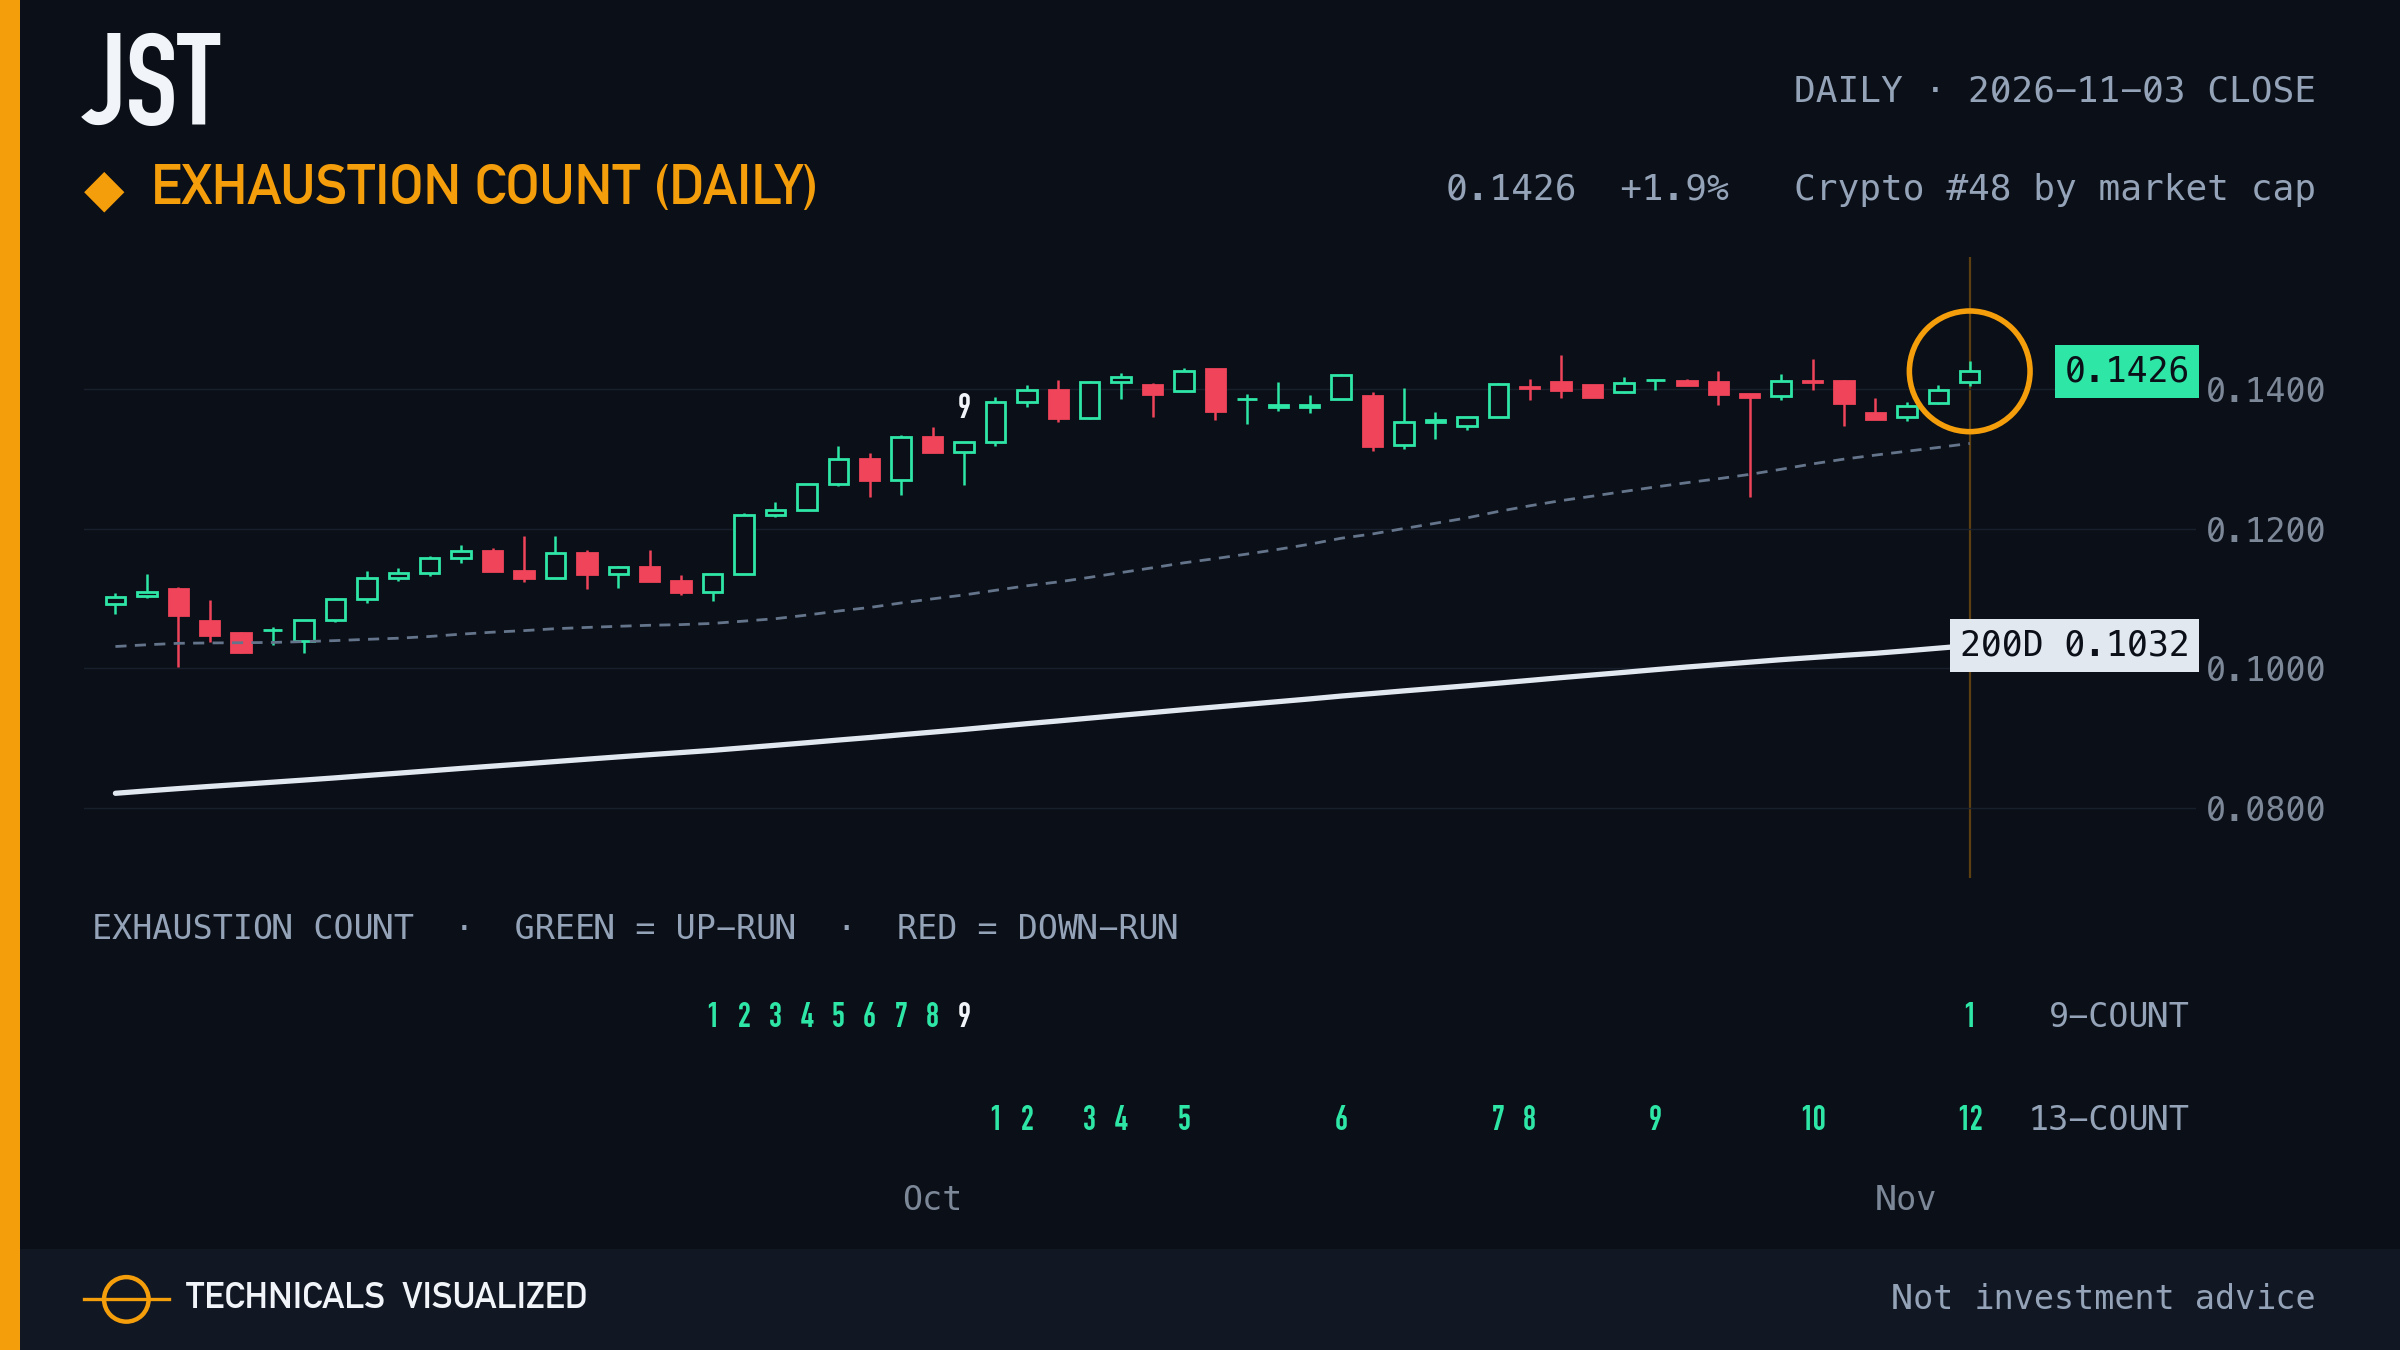
JUST daily exhaustion count: count at 12 of 13 (upside count).
One bar short of a completed count. A count marks a stretched move, not a turn signal.
|
 TECHNICALS VISUALIZED