IndicesThe same five every day: US large caps, the Nasdaq 100, small caps, long Treasuries and crude oil. |
|
01 · SPDR S&P 500 ETF (SPY) · Daily chart
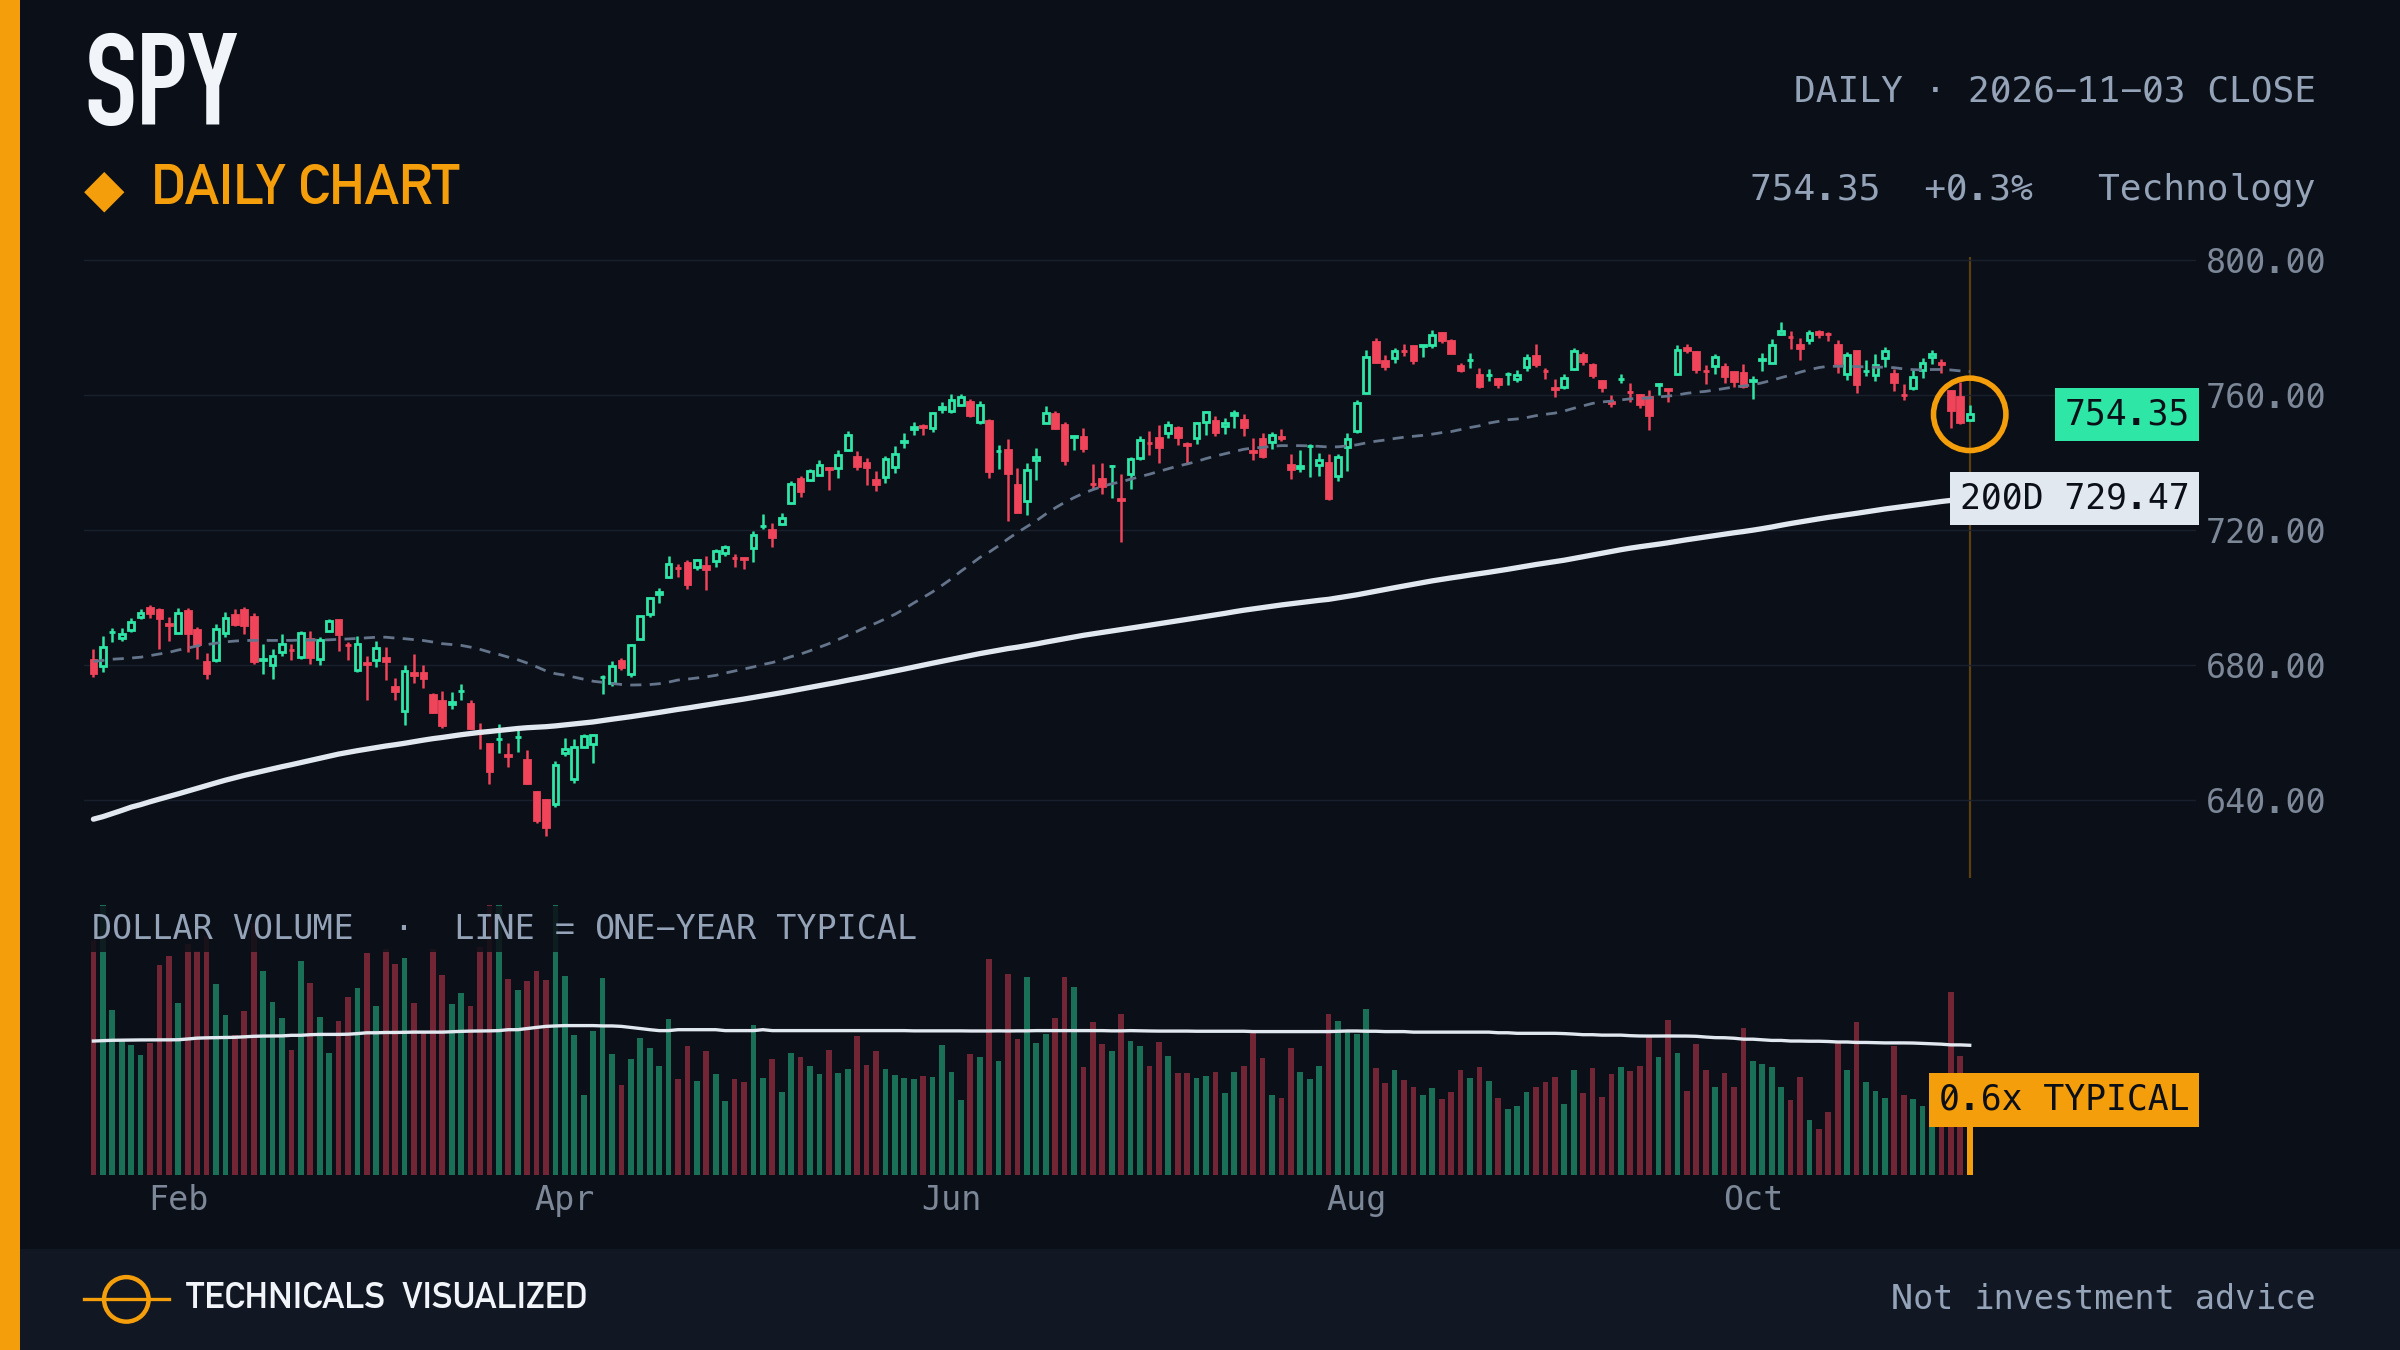
SPDR S&P 500 ETF closed at $754.35, +0.3% on the day, 3.4% above its 200-day average.
Shown in every edition, whether or not it printed a reading. The amber ring marks this close.
|
|
02 · Invesco QQQ Trust (QQQ) · Daily chart
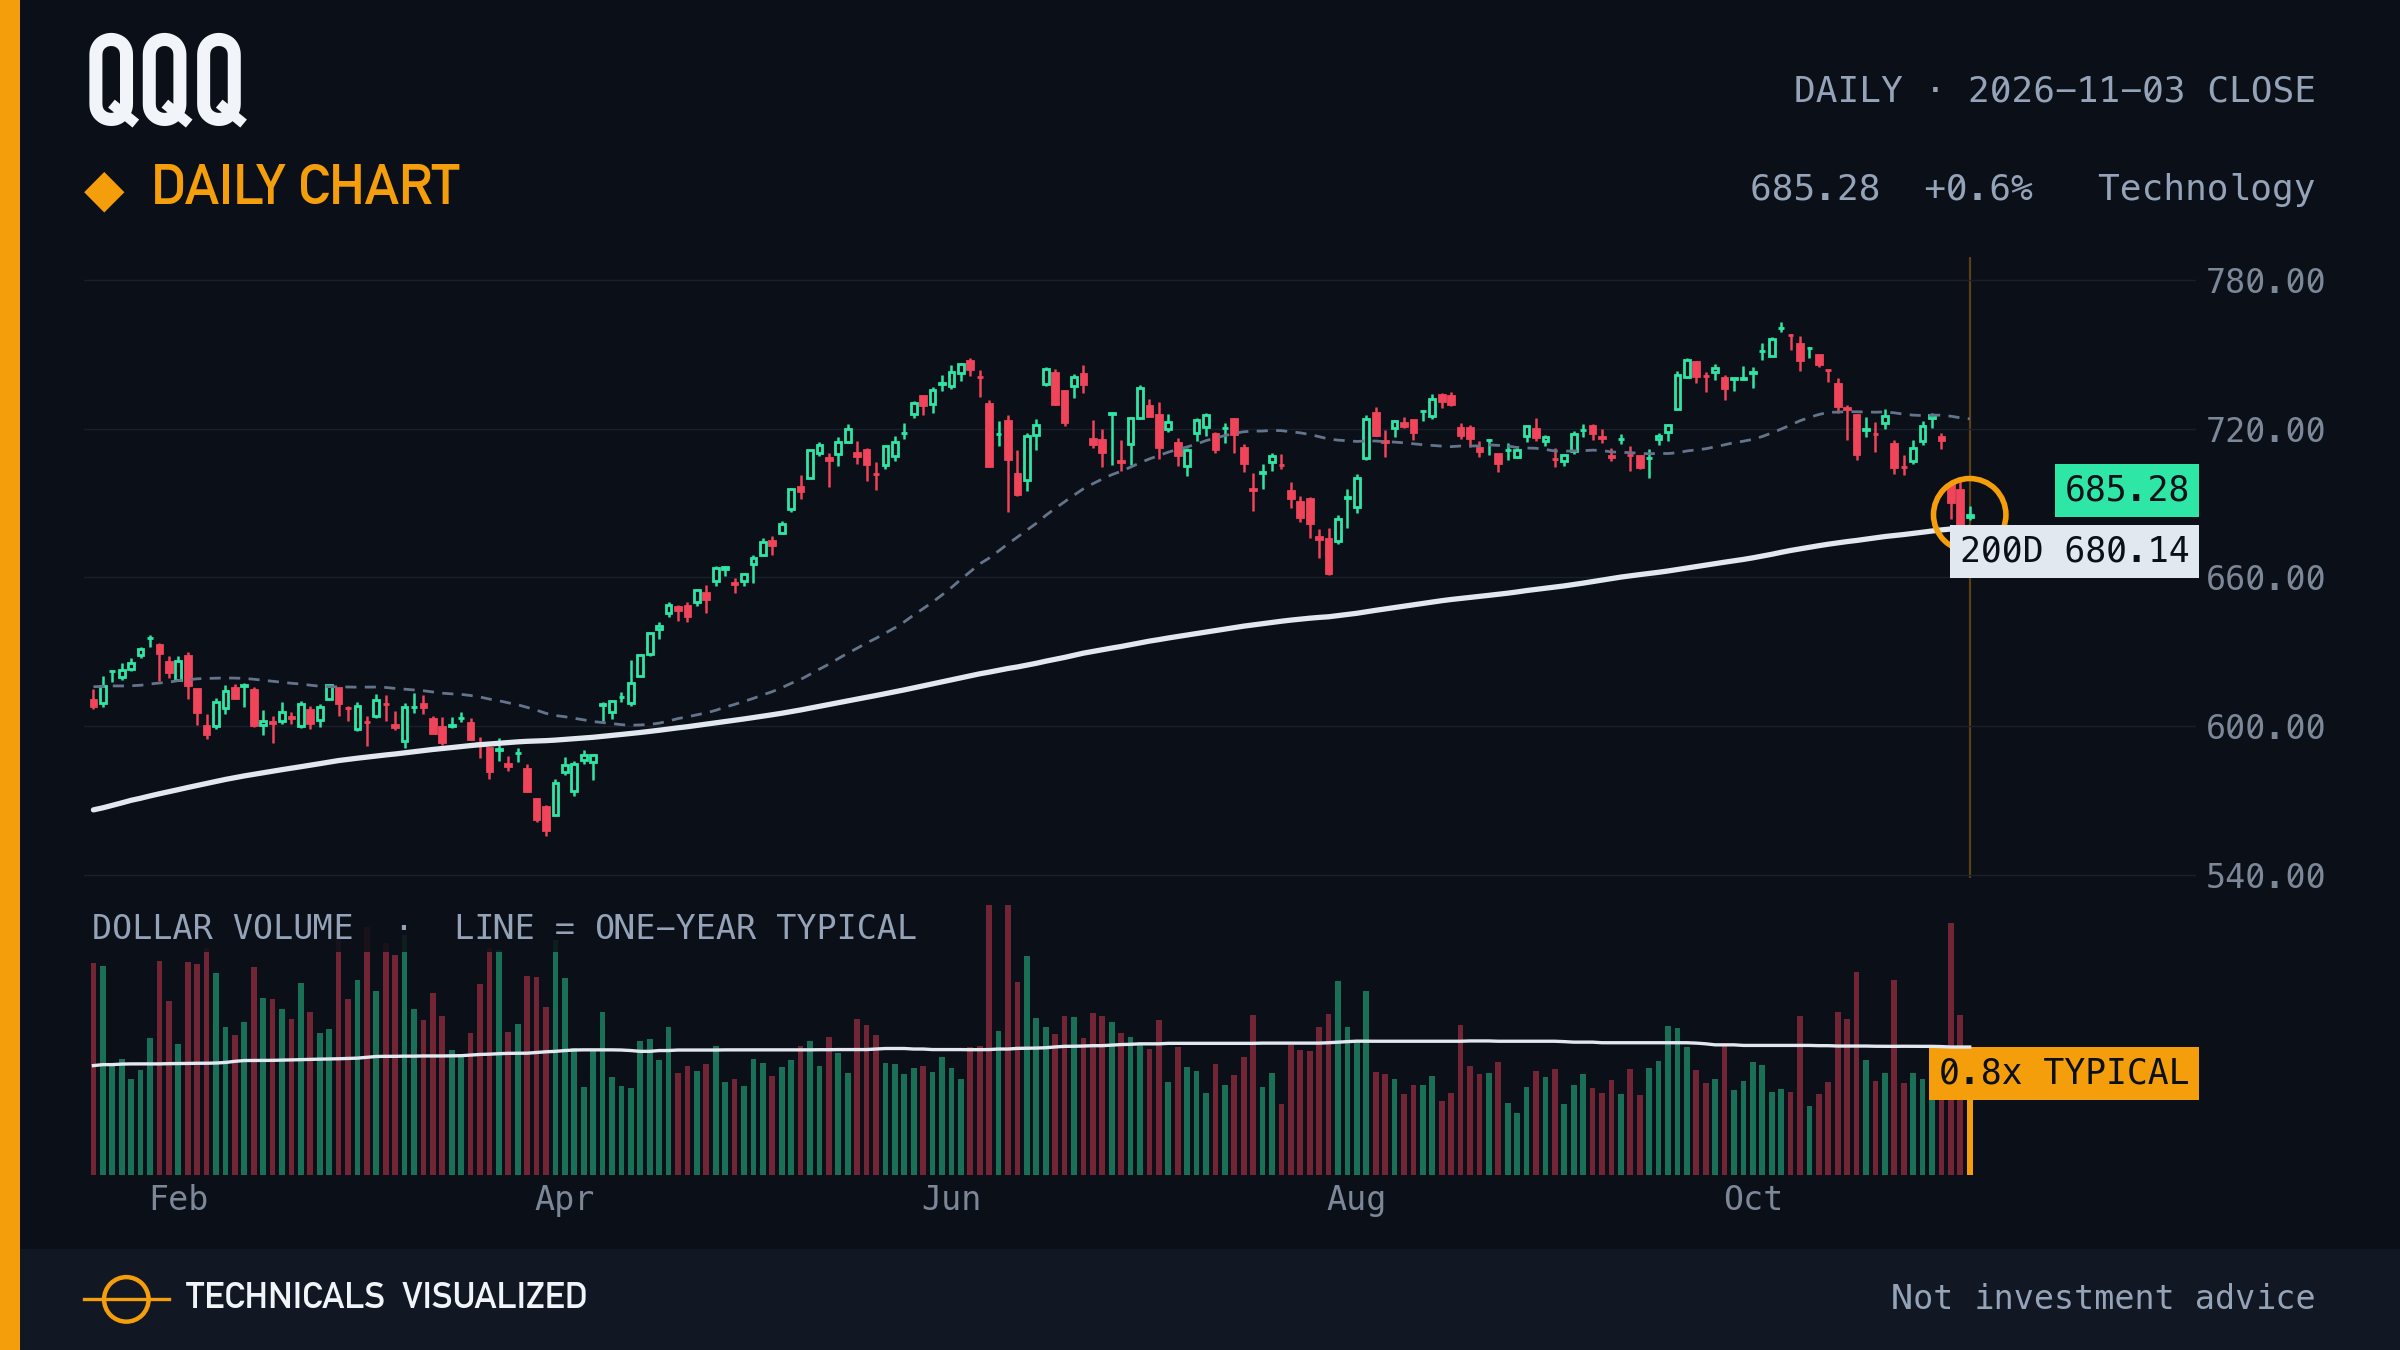
Invesco QQQ Trust closed at $685.28, +0.6% on the day, 0.8% above its 200-day average.
Shown in every edition, whether or not it printed a reading. The amber ring marks this close.
|
|
03 · iShares Russell 2000 ETF (IWM) · Daily chart
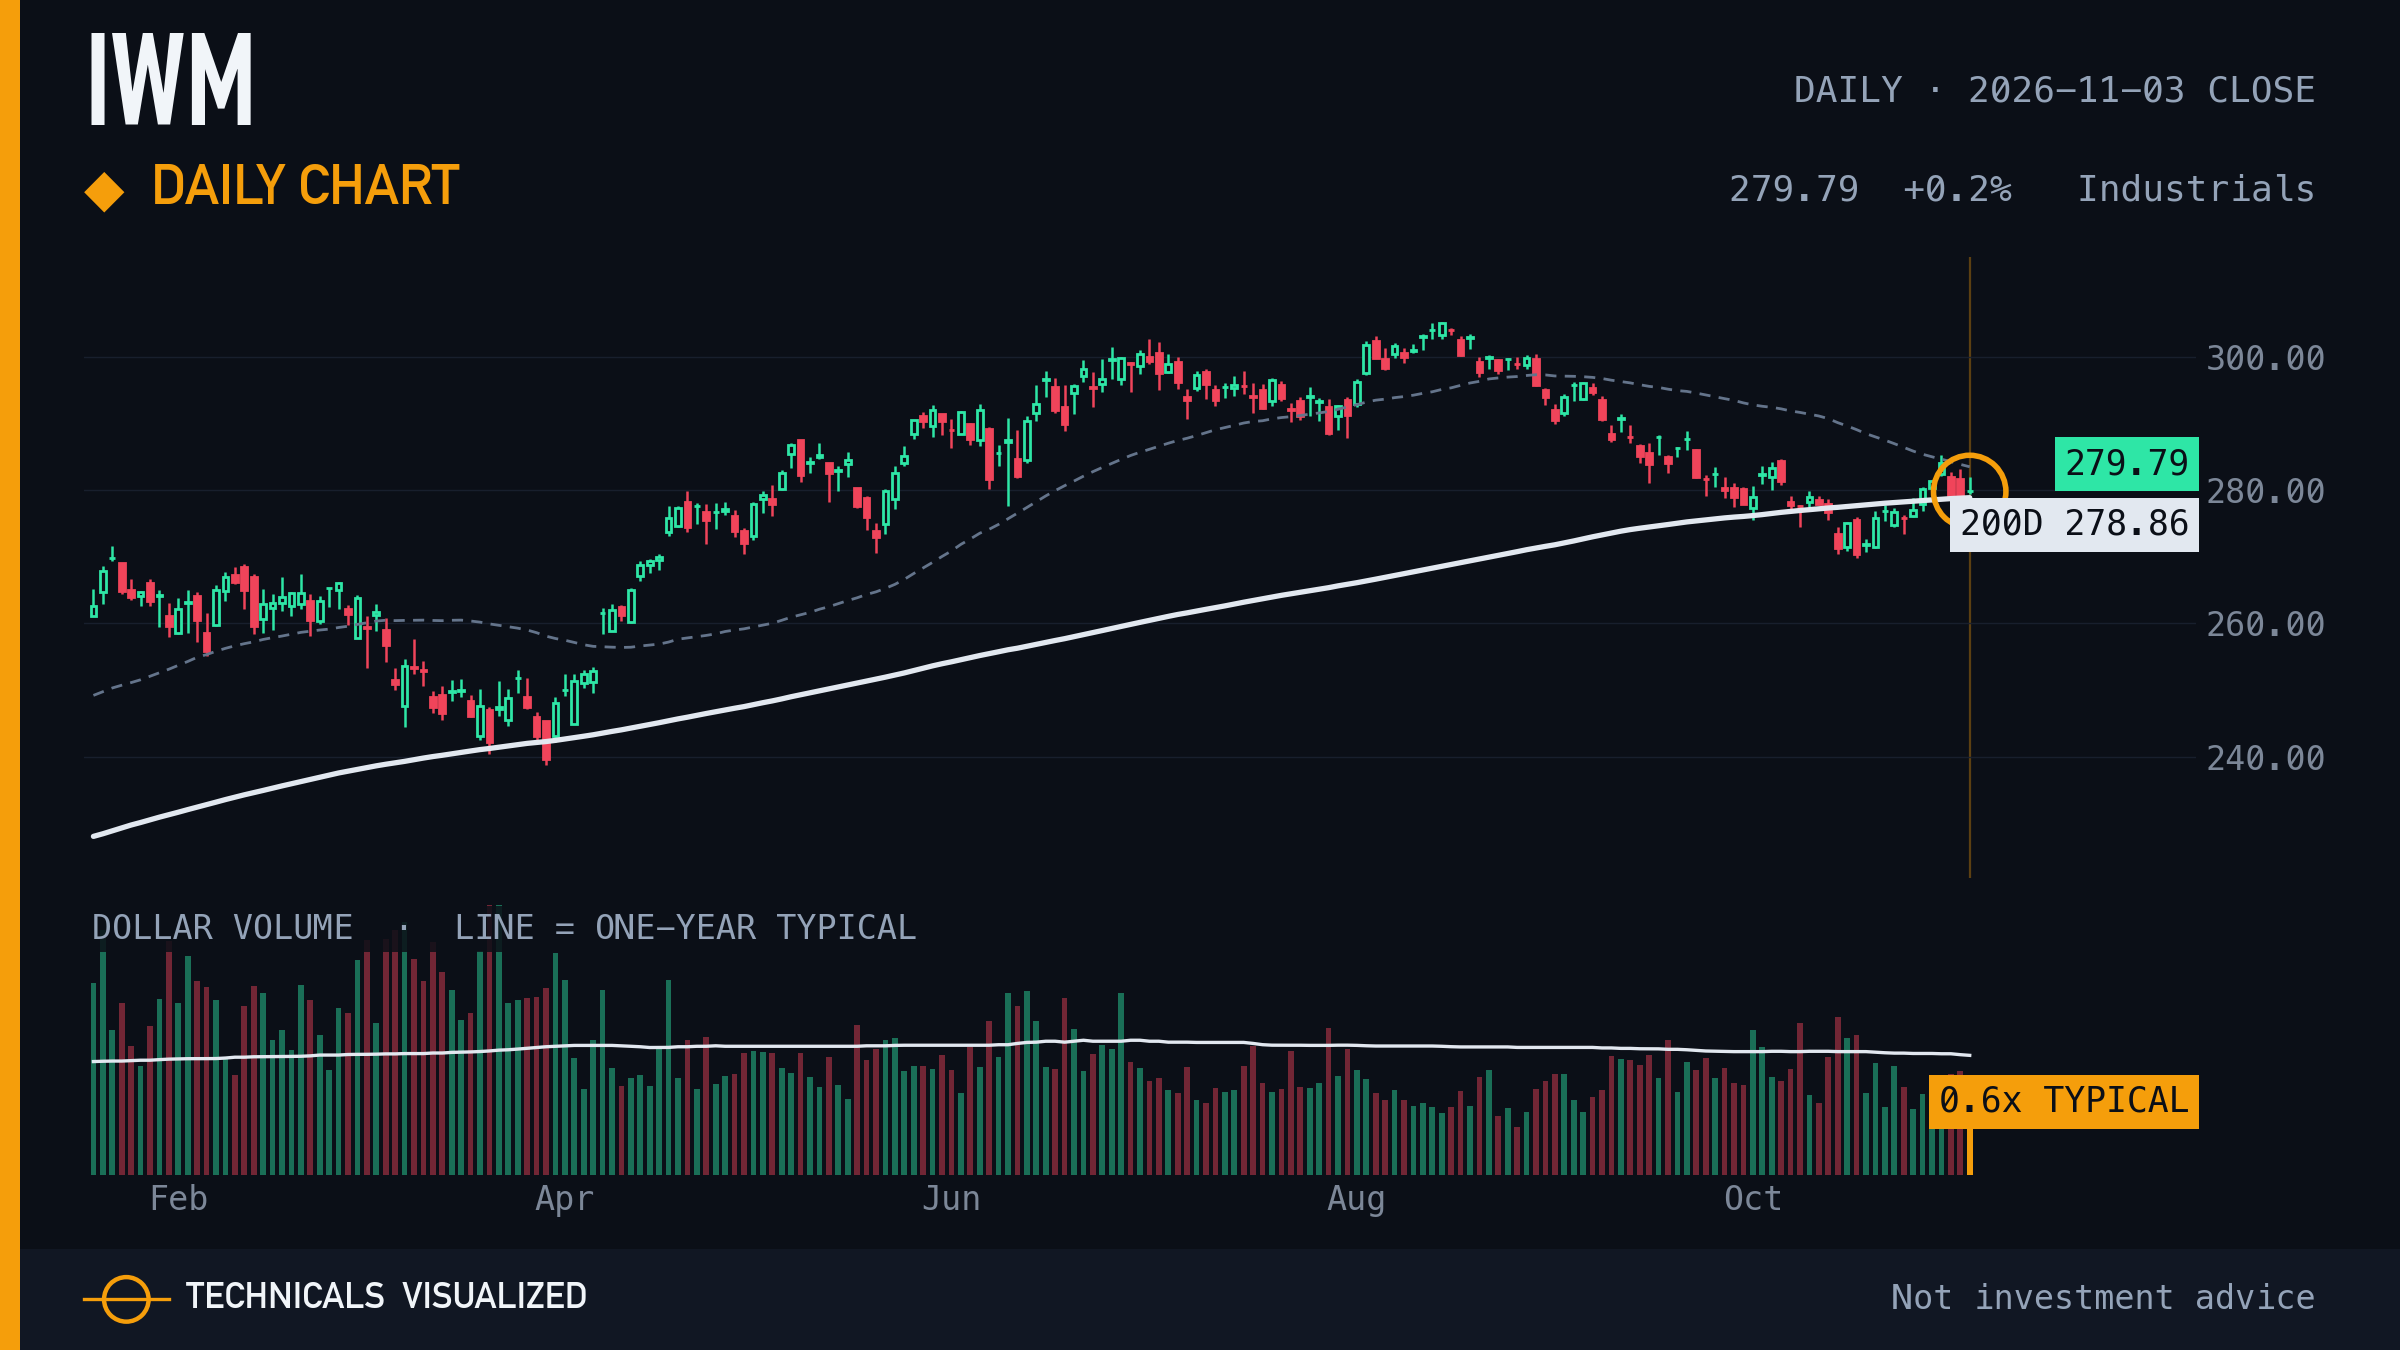
iShares Russell 2000 ETF closed at $279.79, +0.2% on the day, 0.3% above its 200-day average.
Shown in every edition, whether or not it printed a reading. The amber ring marks this close.
|
|
04 · iShares 20+ Year Treasury Bond ETF (TLT) · Daily chart
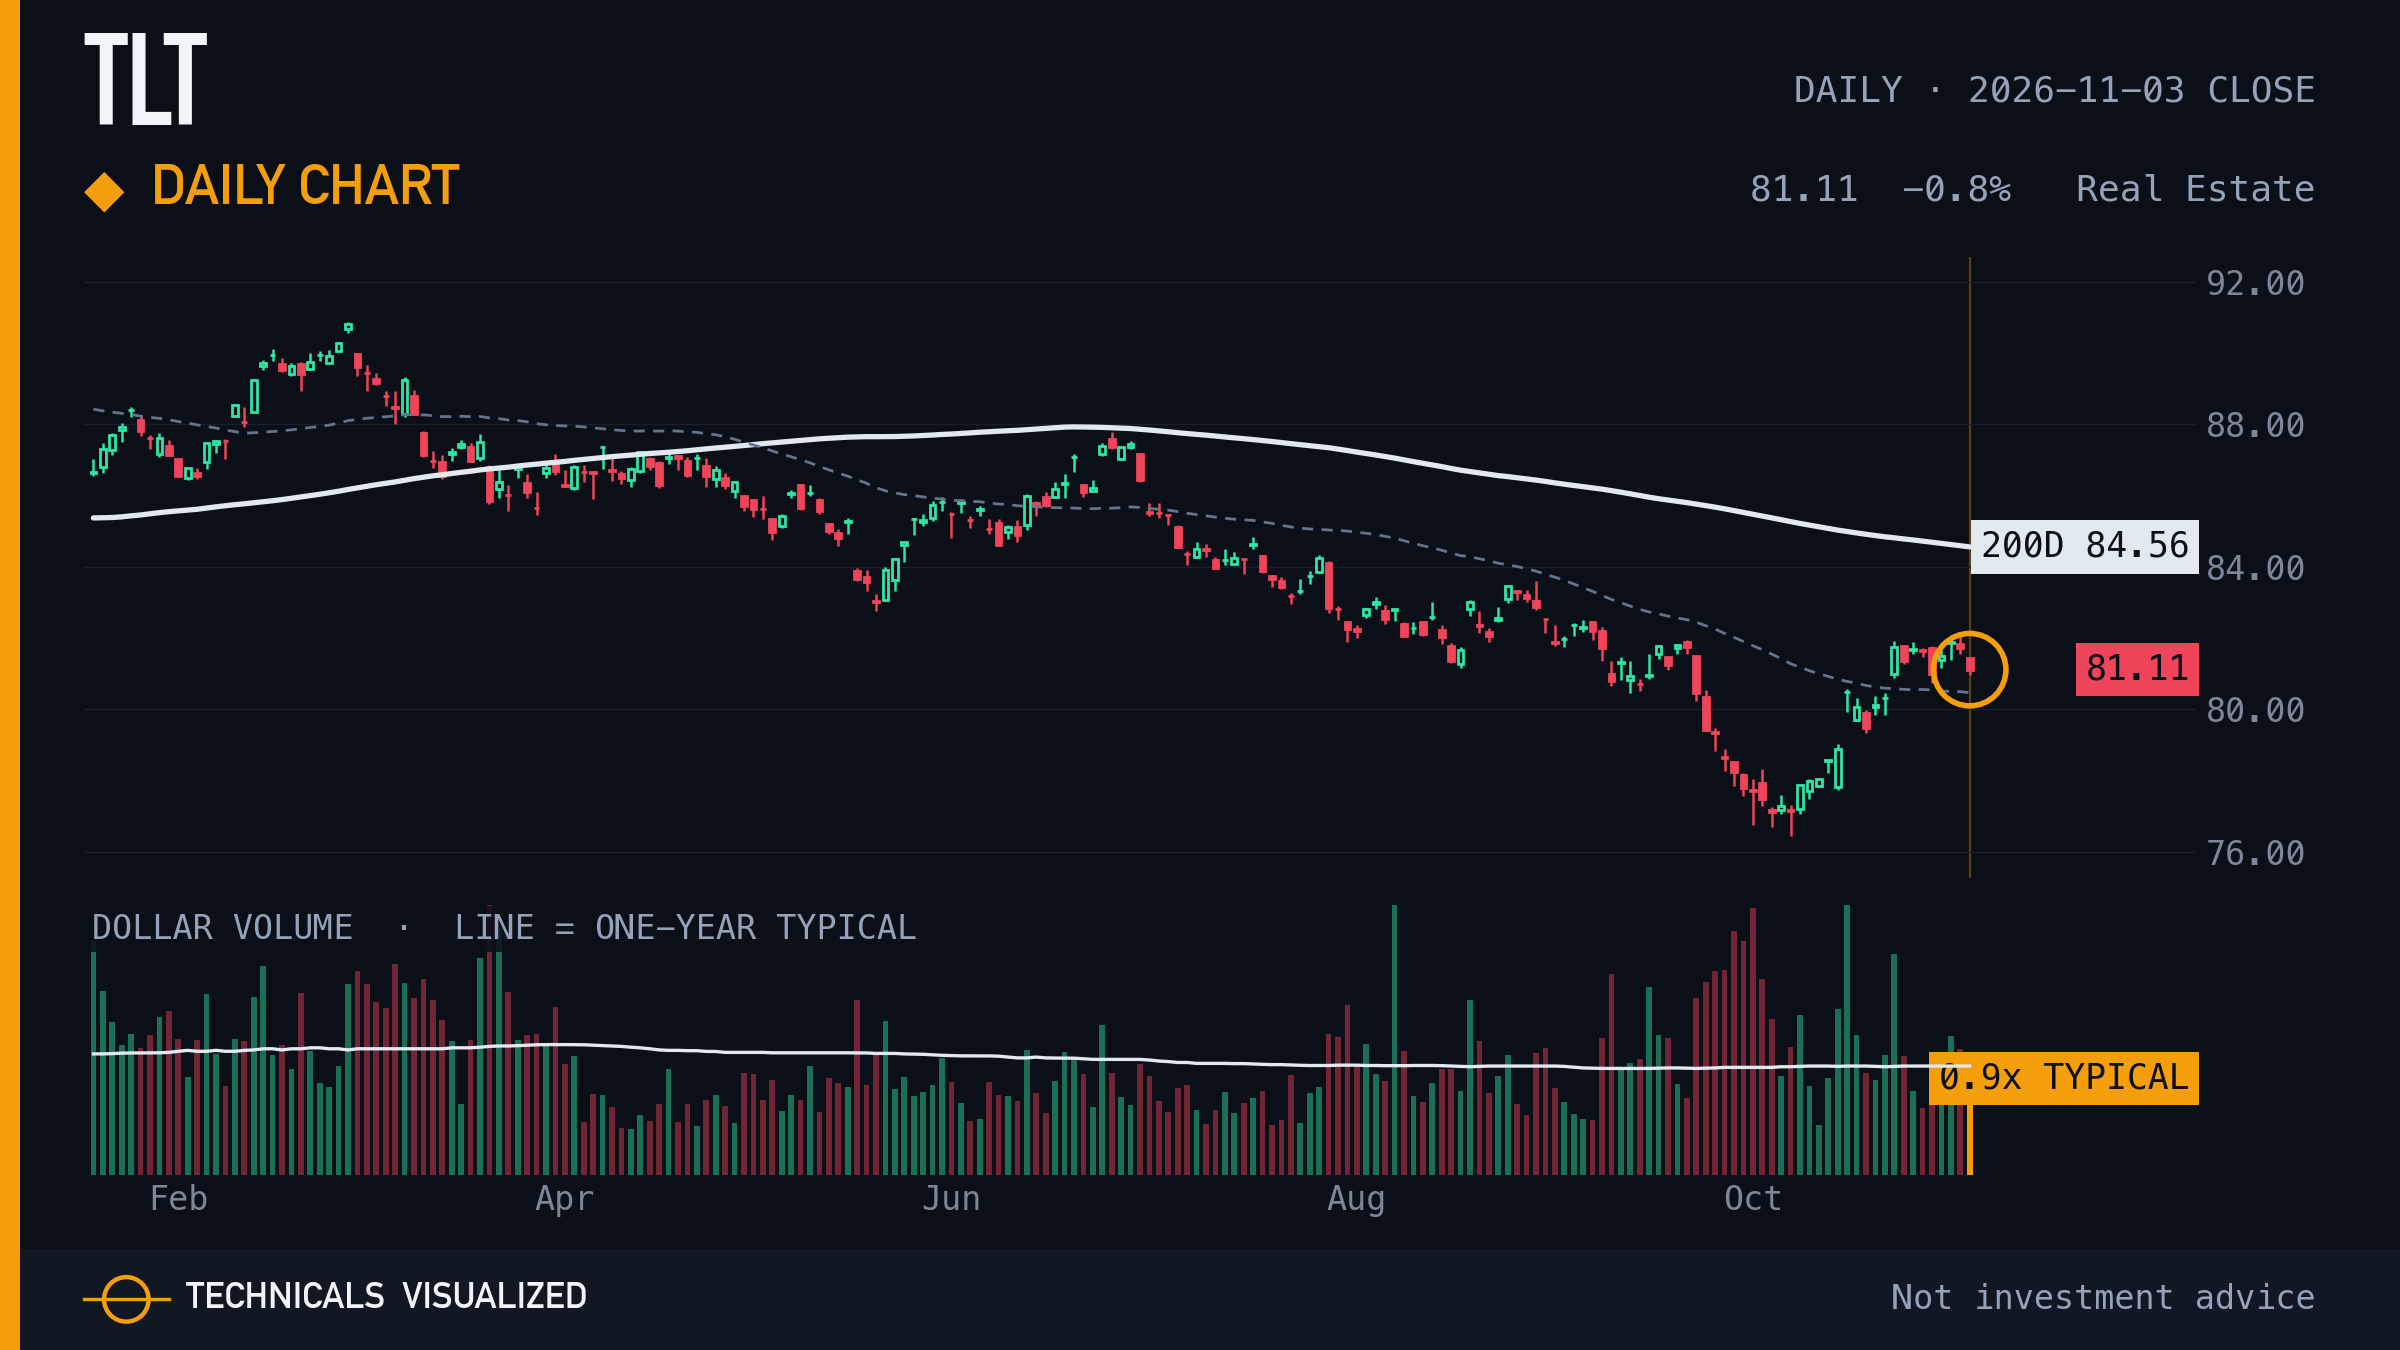
iShares 20+ Year Treasury Bond ETF closed at $81.11, -0.8% on the day, 4.1% below its 200-day average.
Shown in every edition, whether or not it printed a reading. The amber ring marks this close.
|
|
05 · United States Oil Fund (USO) · Daily chart
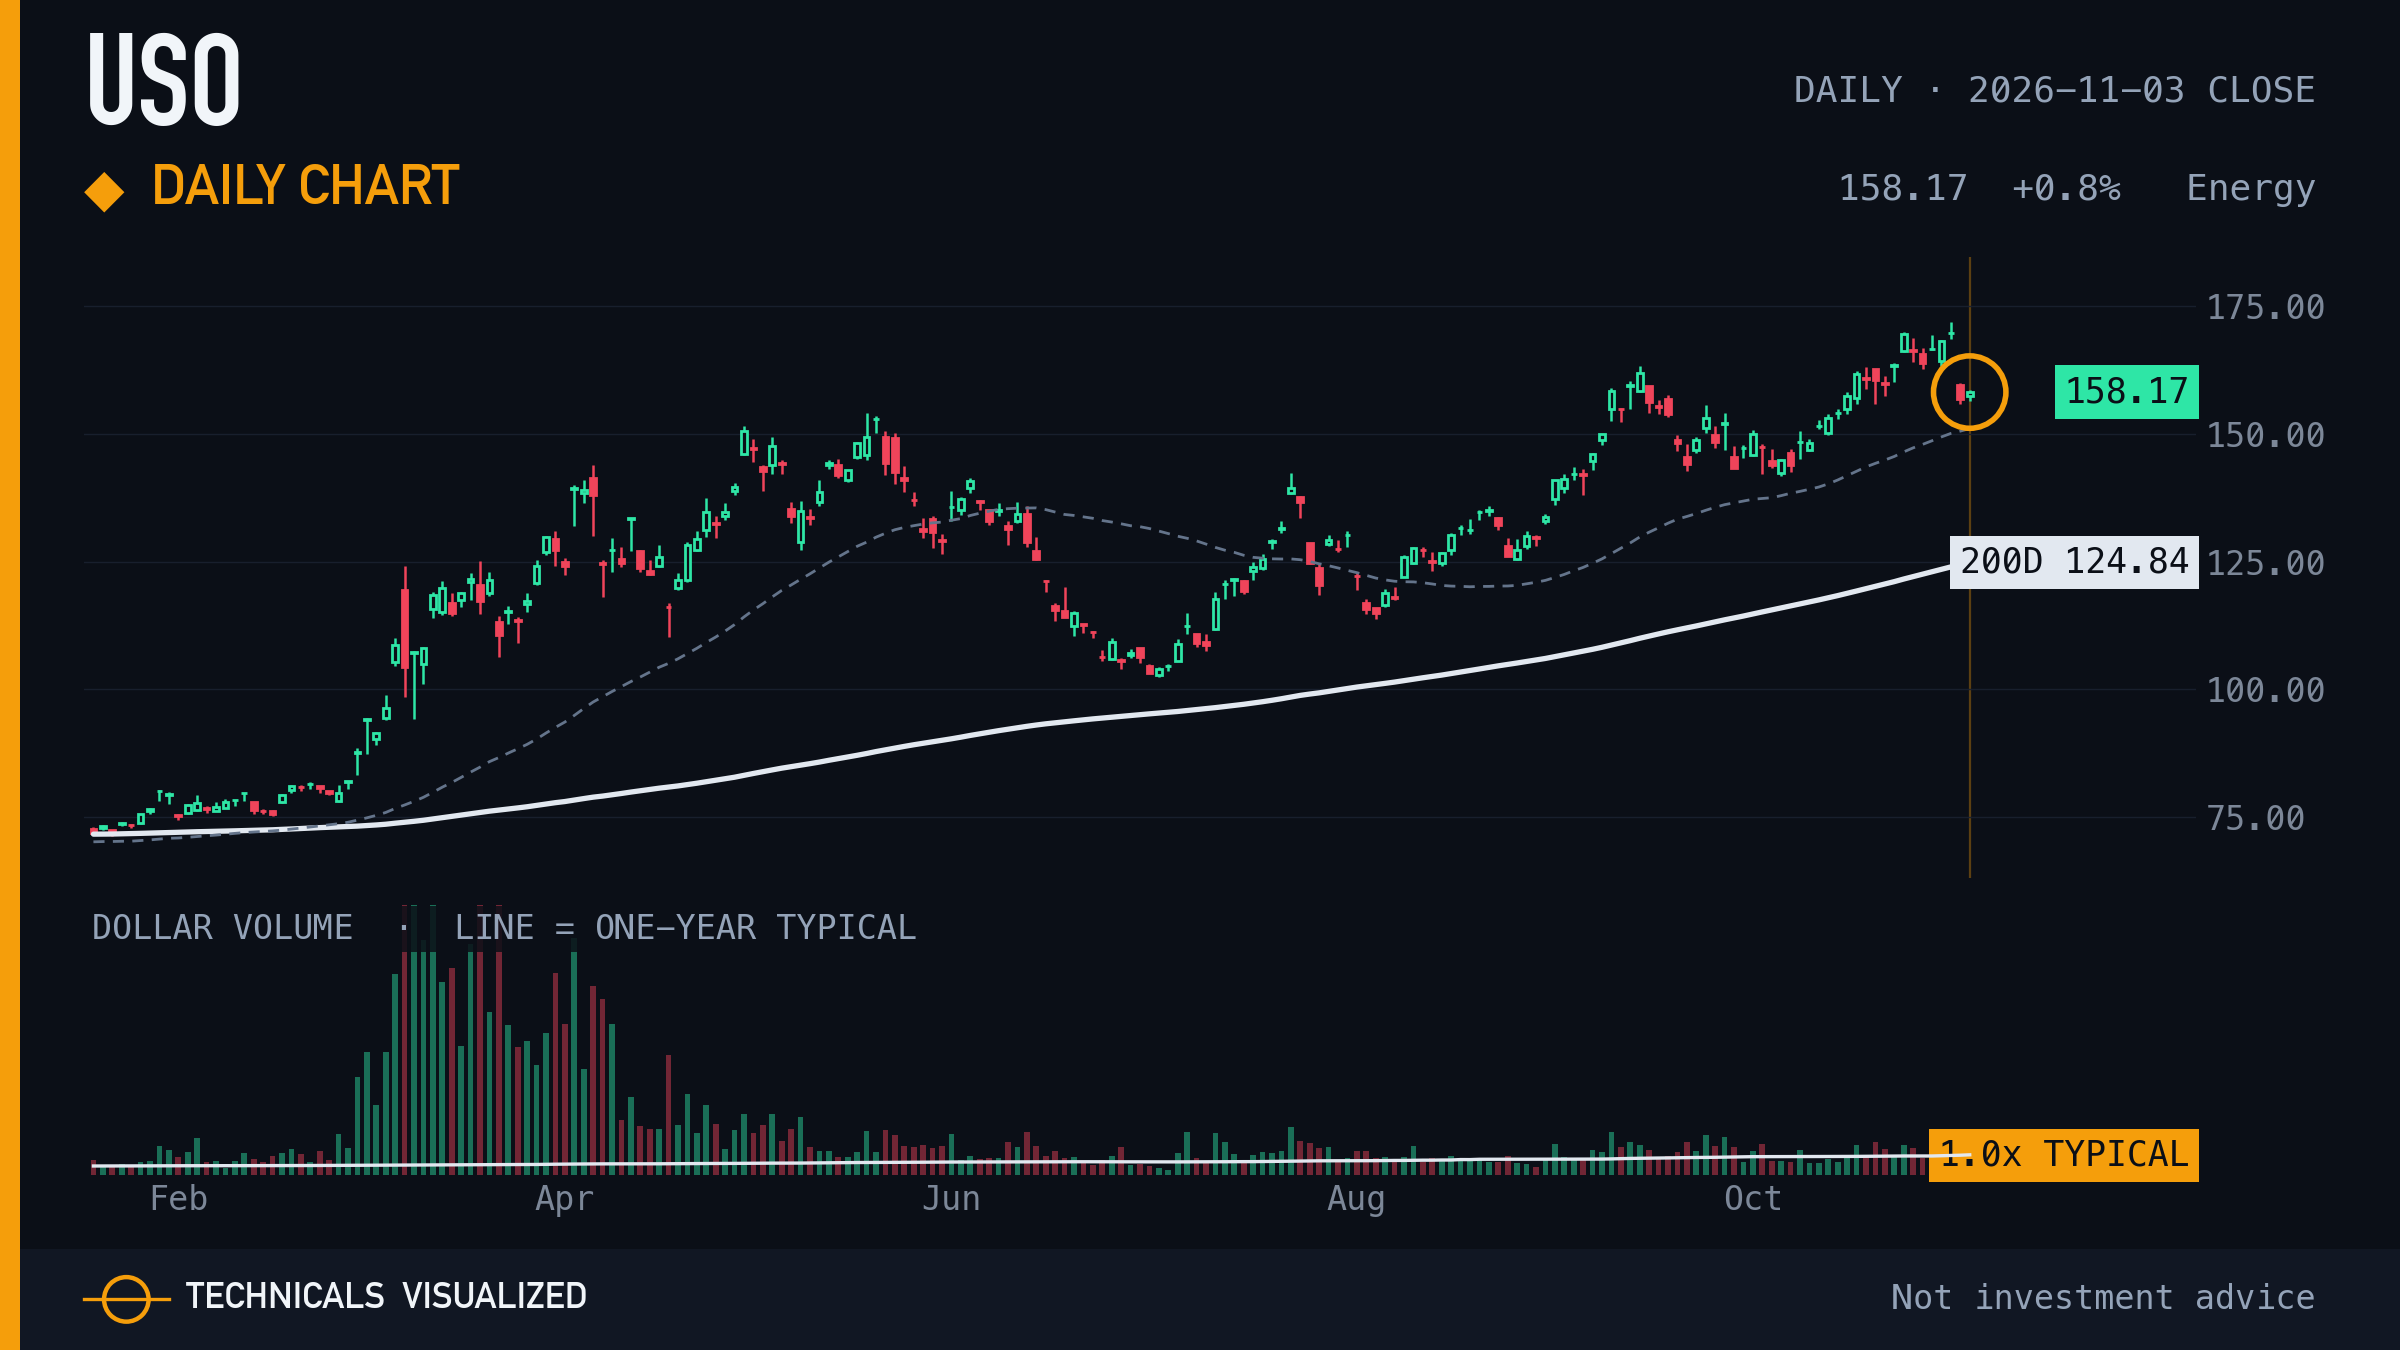
United States Oil Fund closed at $158.17, +0.8% on the day, 26.7% above its 200-day average.
Shown in every edition, whether or not it printed a reading. The amber ring marks this close.
|
Today's readings |
|
06 · Kimberly-Clark (KMB) · Volume surge
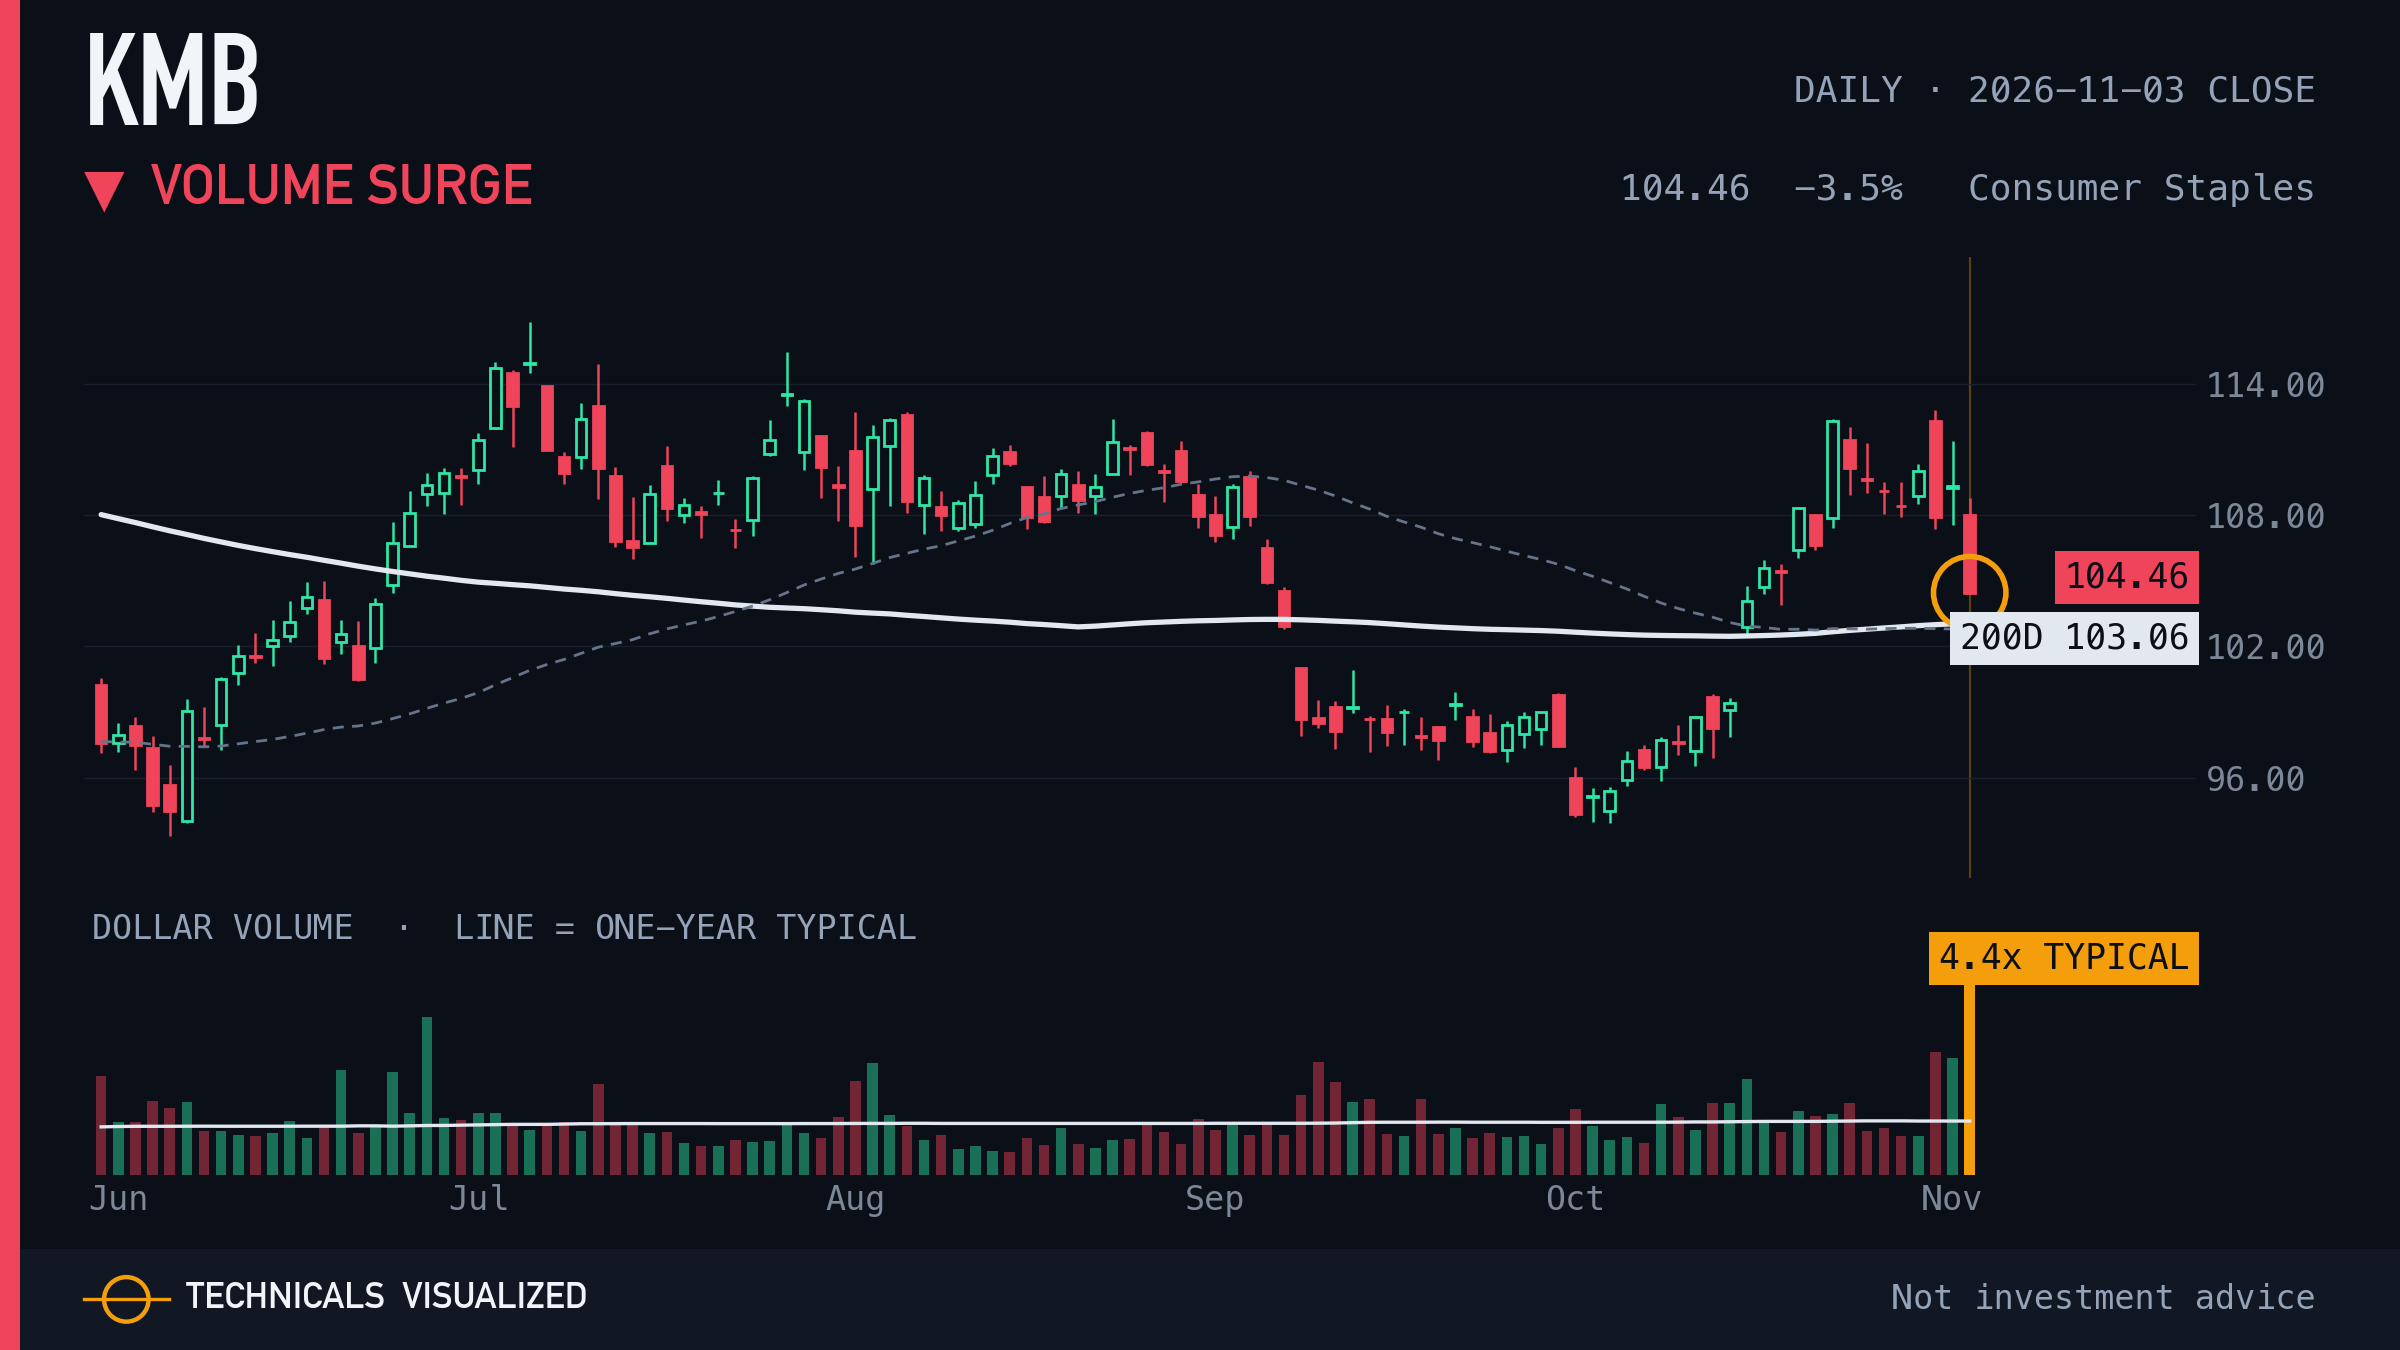
Kimberly-Clark traded 4.4x its typical dollar volume on a -3.5% move.
One session, measured against this chart's own usual move. It describes the day, not the next one.
|
|
07 · Archer-Daniels-Midland (ADM) · Outsized session
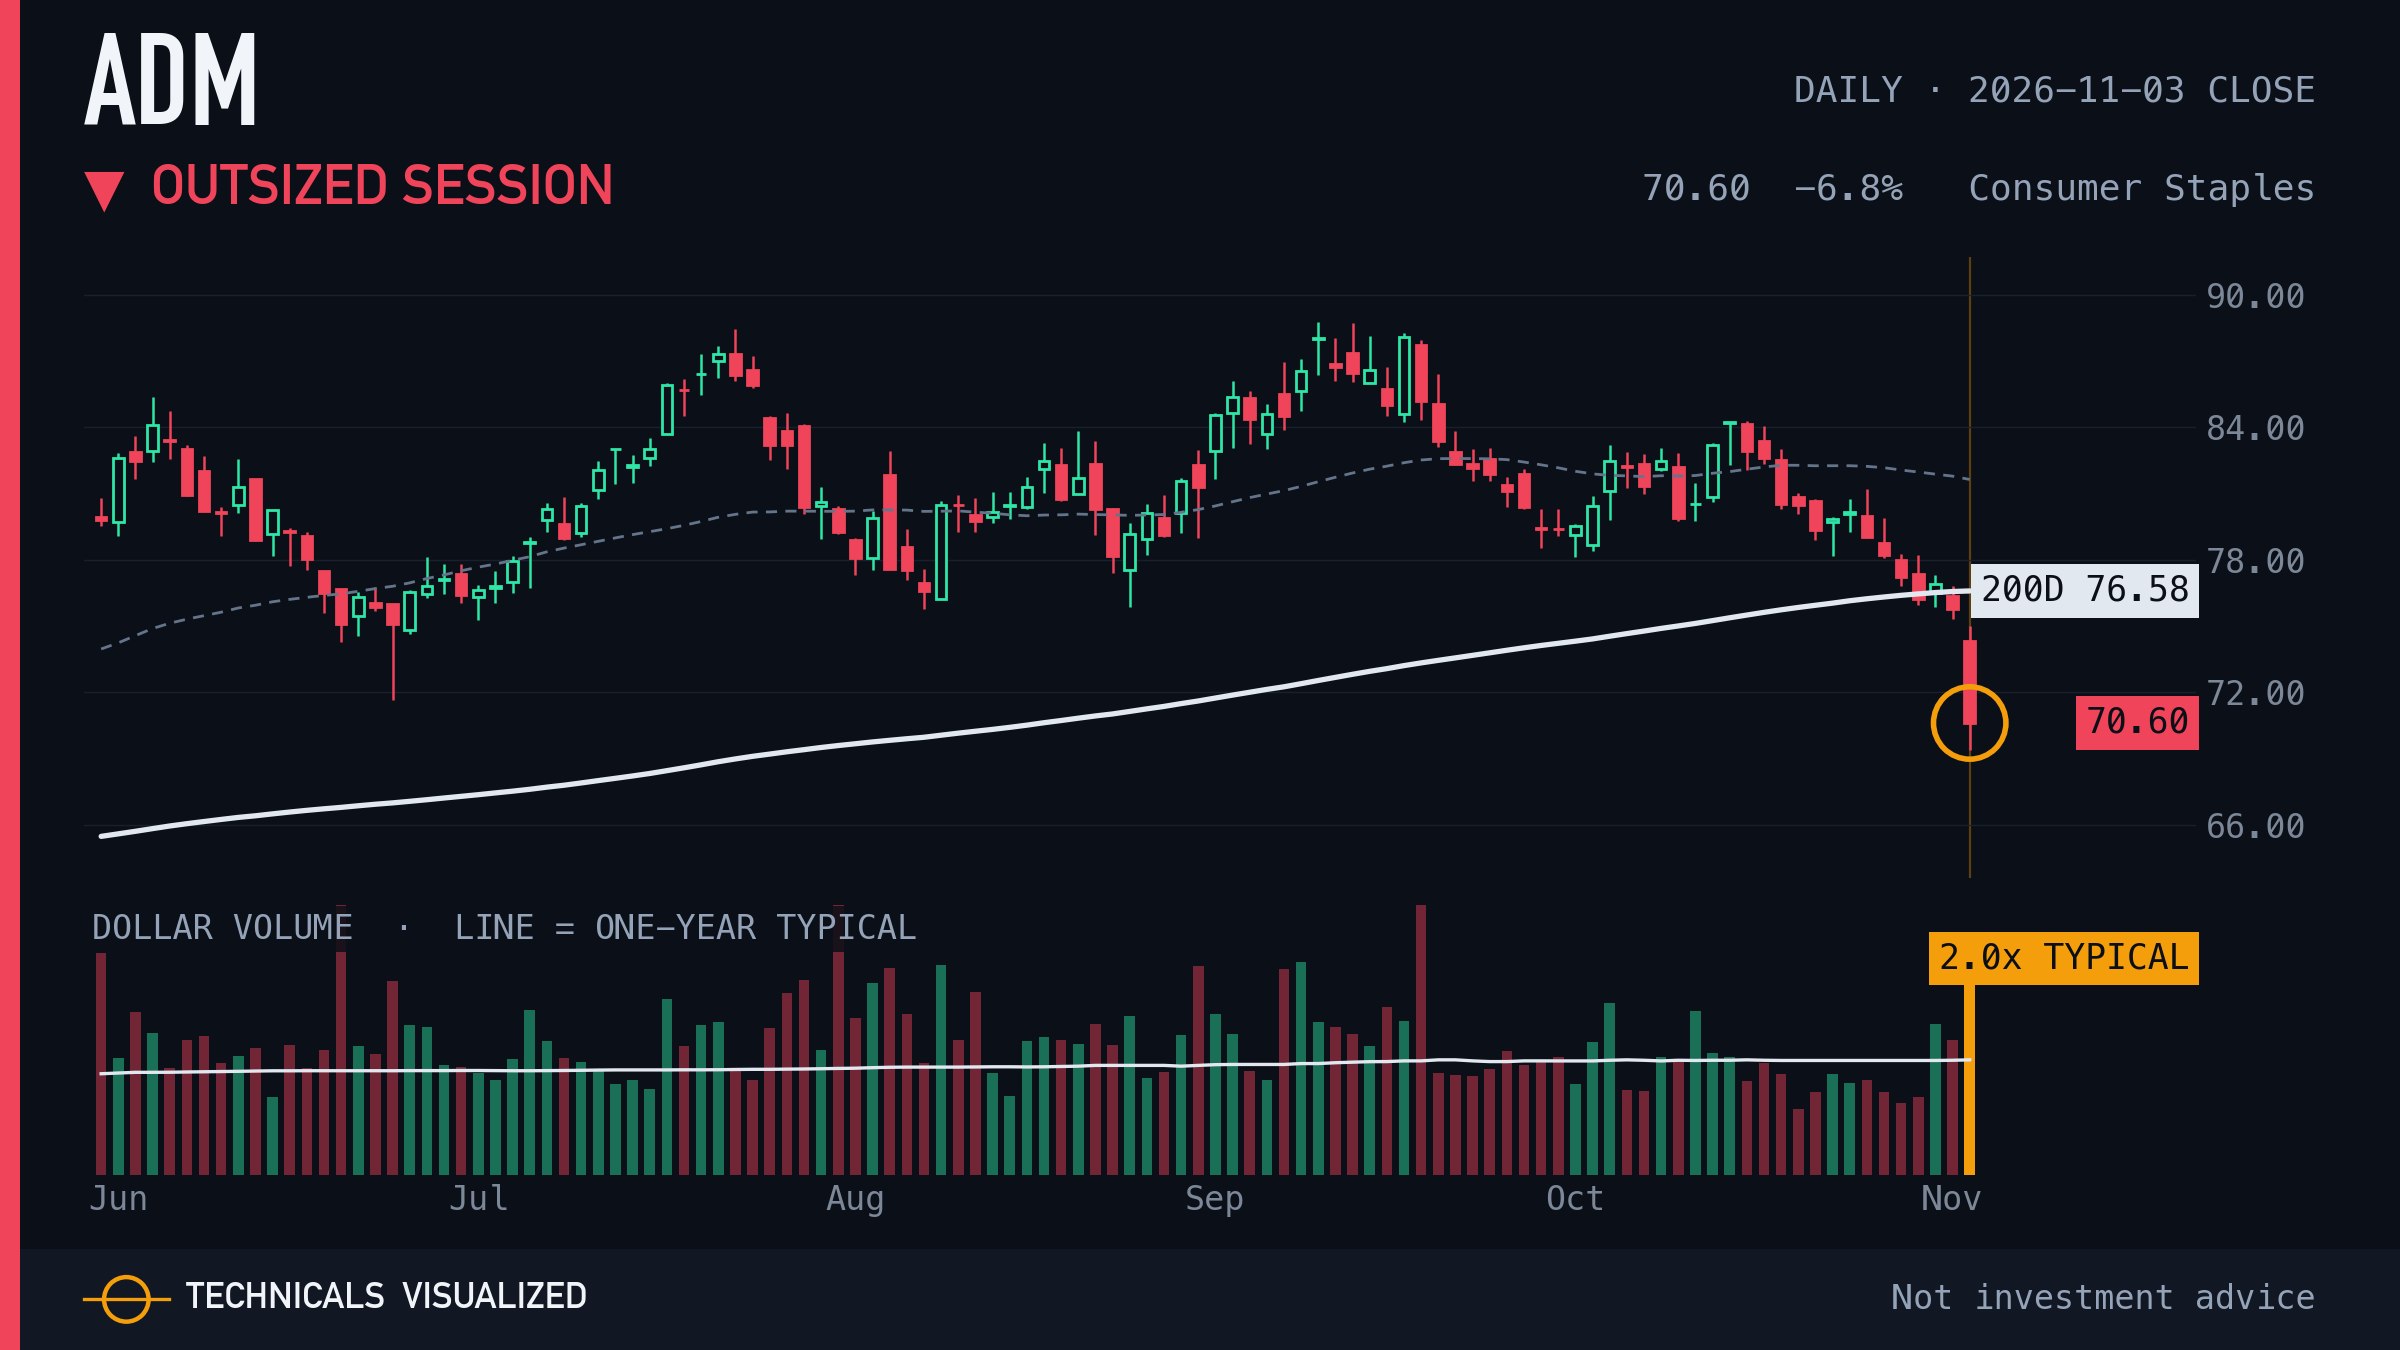
Archer-Daniels-Midland moved -6.8% in one session, 4.1 times its usual daily move.
One session, measured against this chart's own usual move. It describes the day, not the next one.
|
|
08 · Zebra Technologies (ZBRA) · Outsized session
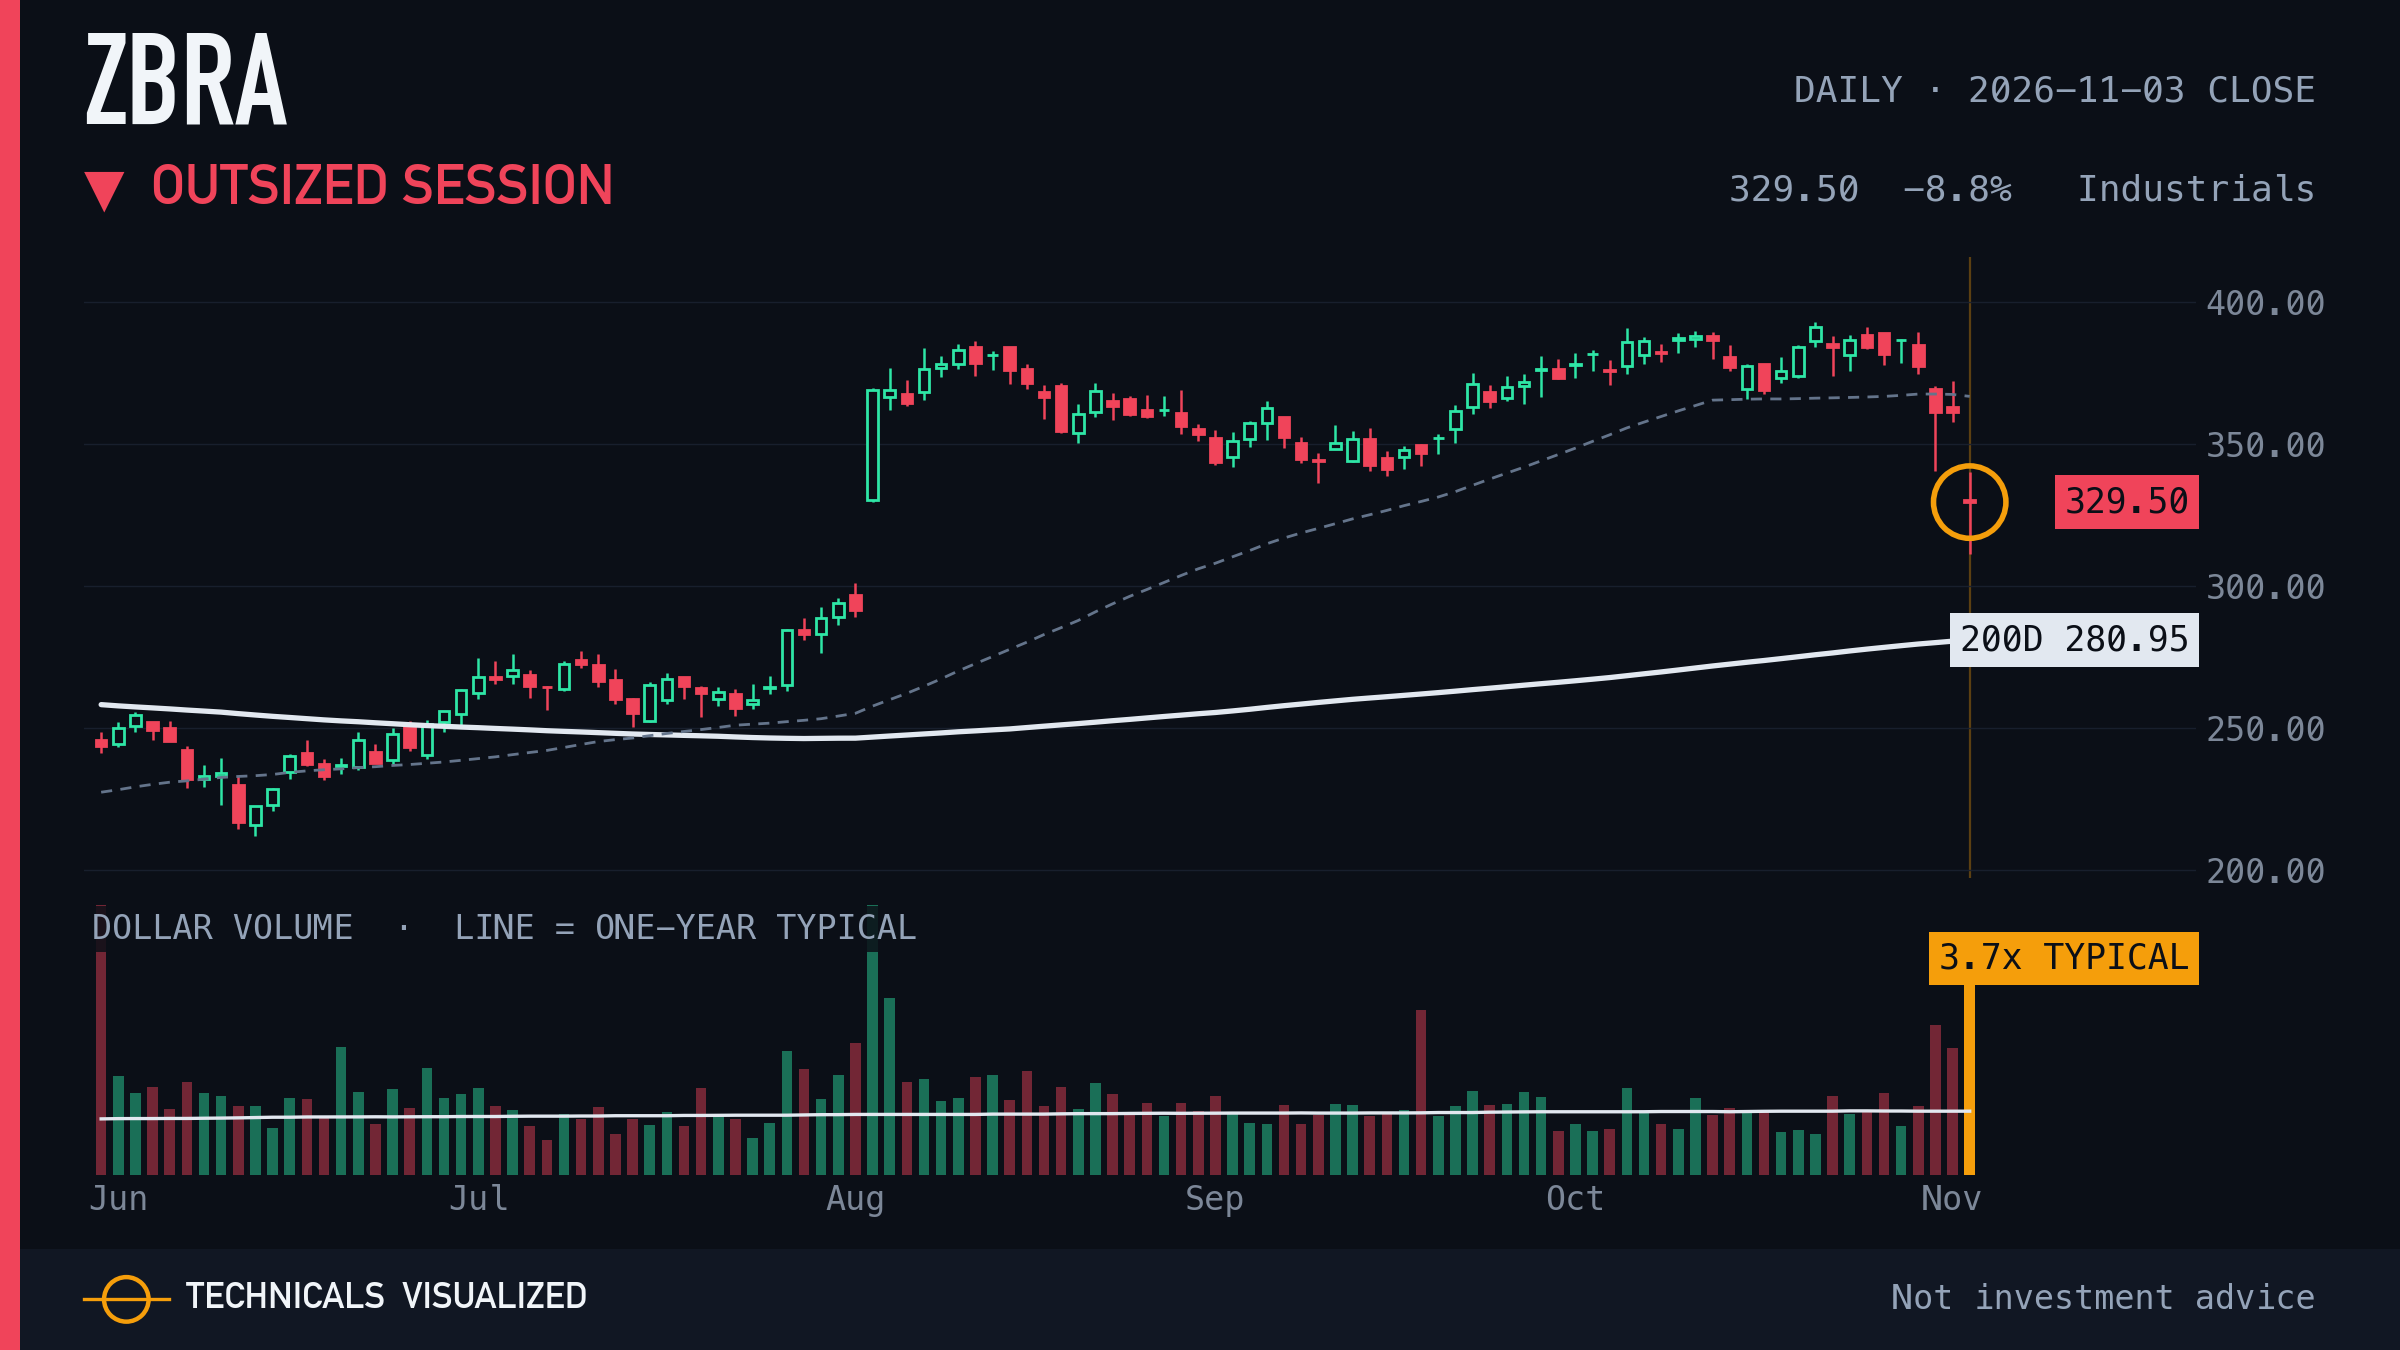
Zebra Technologies moved -8.8% in one session, 5.6 times its usual daily move.
One session, measured against this chart's own usual move. It describes the day, not the next one.
|
|
09 · Henry Schein (HSIC) · Volume surge
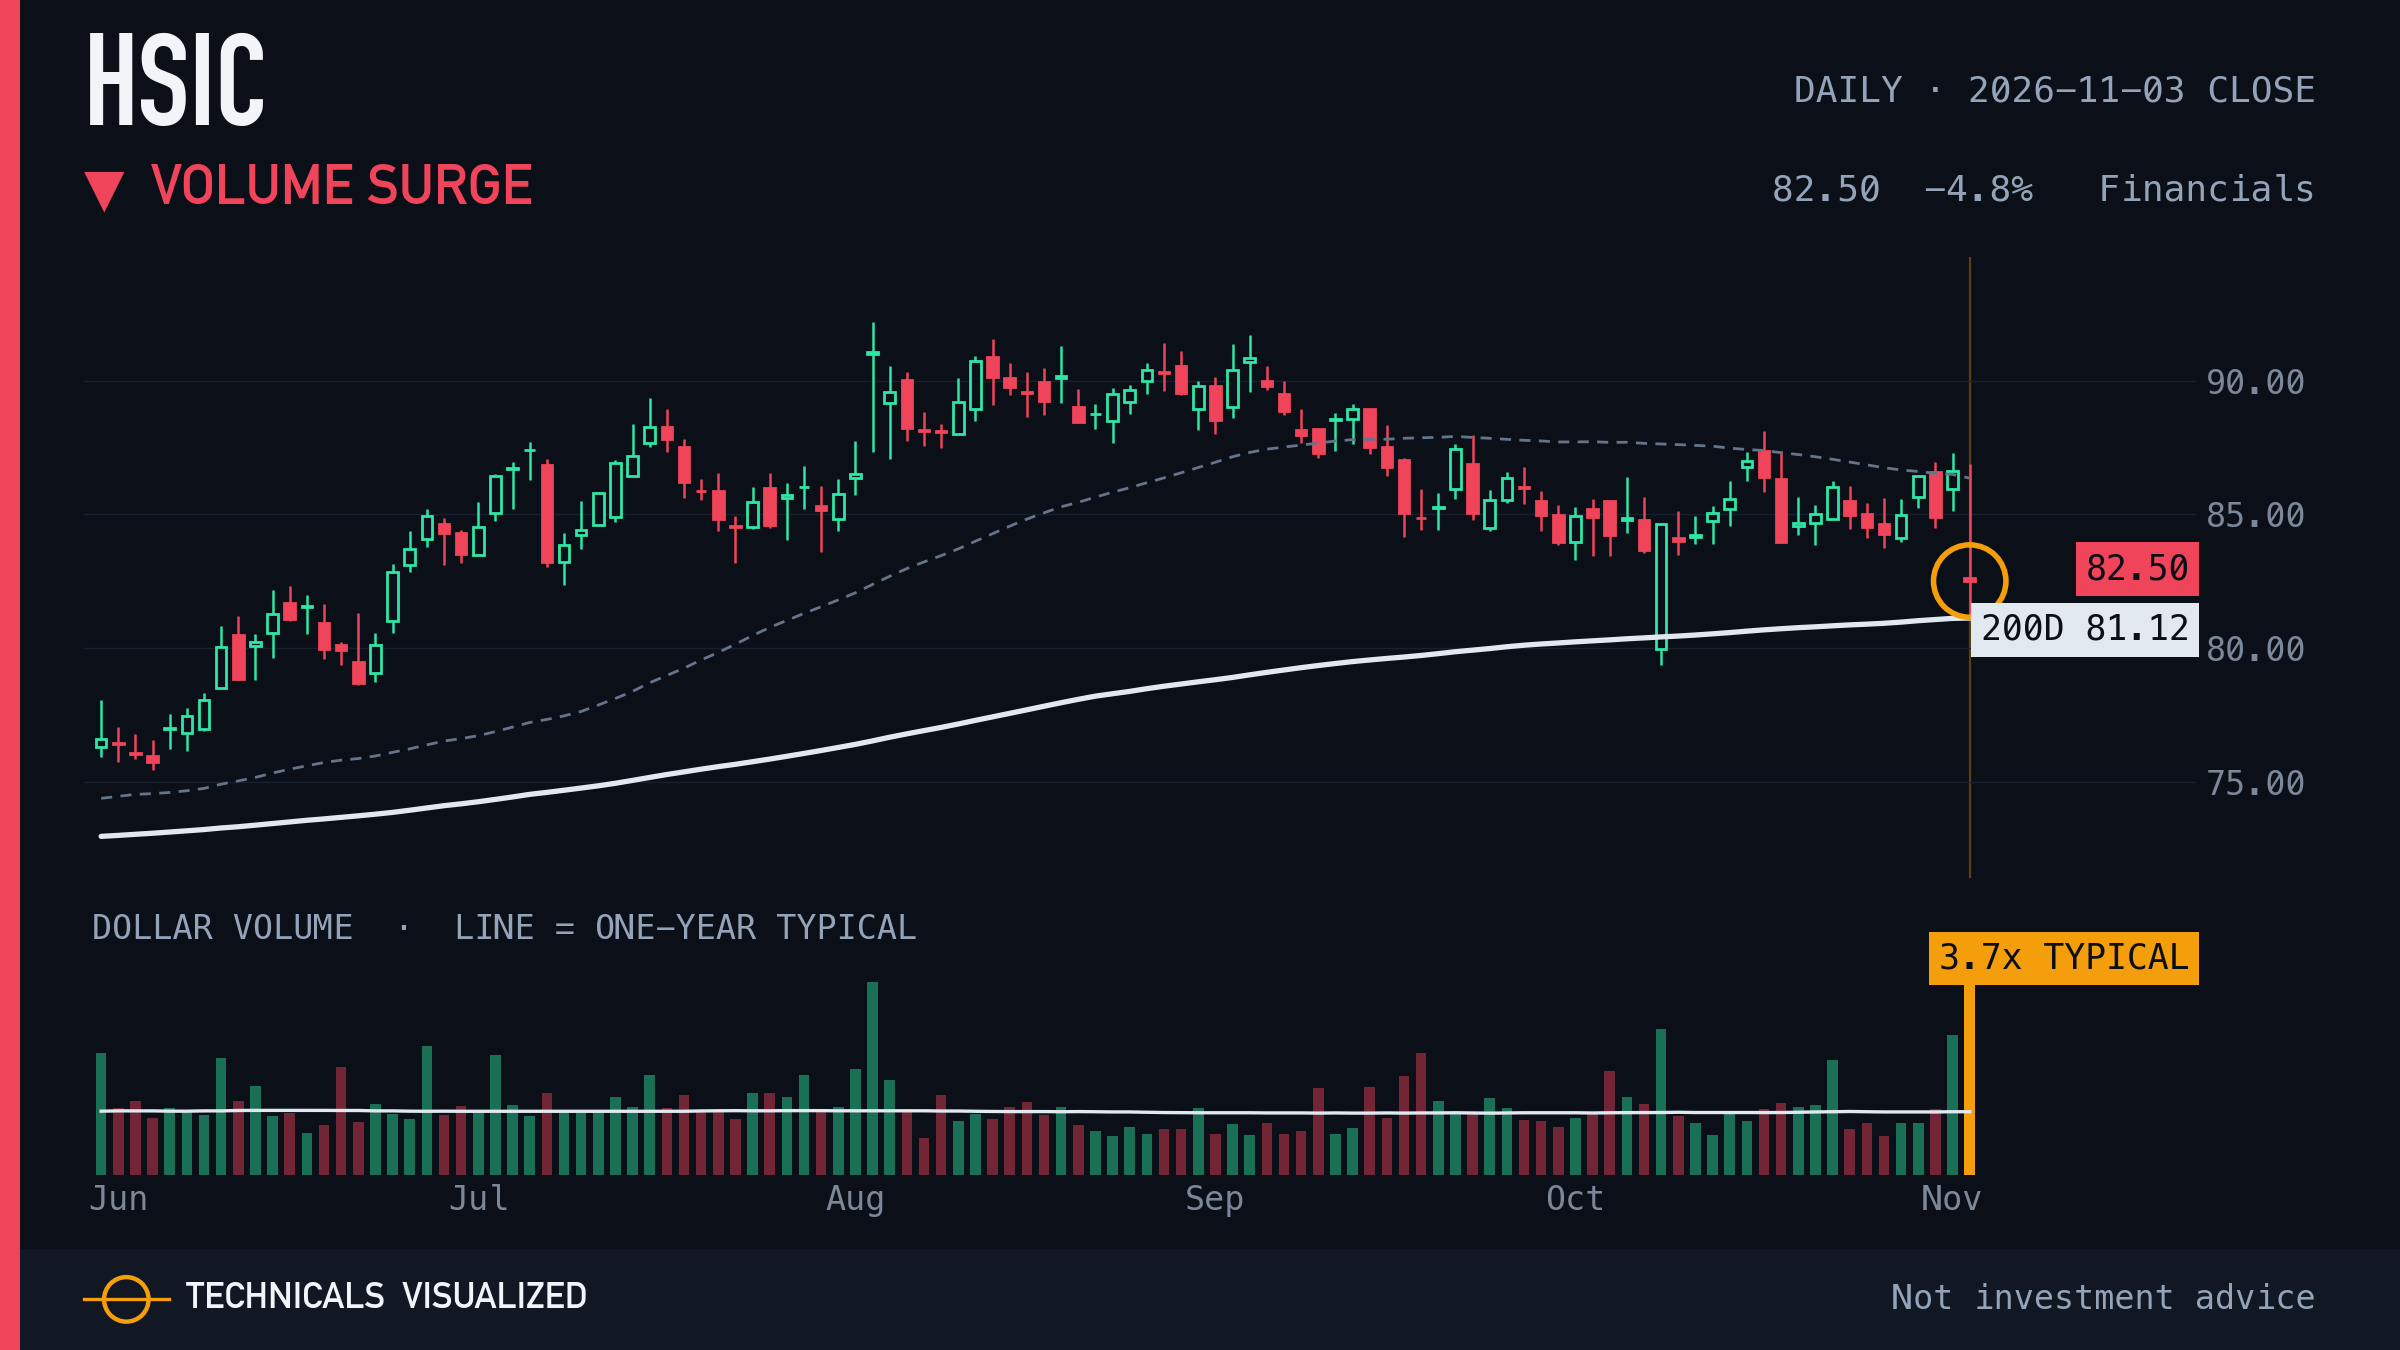
Henry Schein traded 3.7x its typical dollar volume on a -4.8% move.
One session, measured against this chart's own usual move. It describes the day, not the next one.
|
|
10 · Gartner (IT) · Outsized session
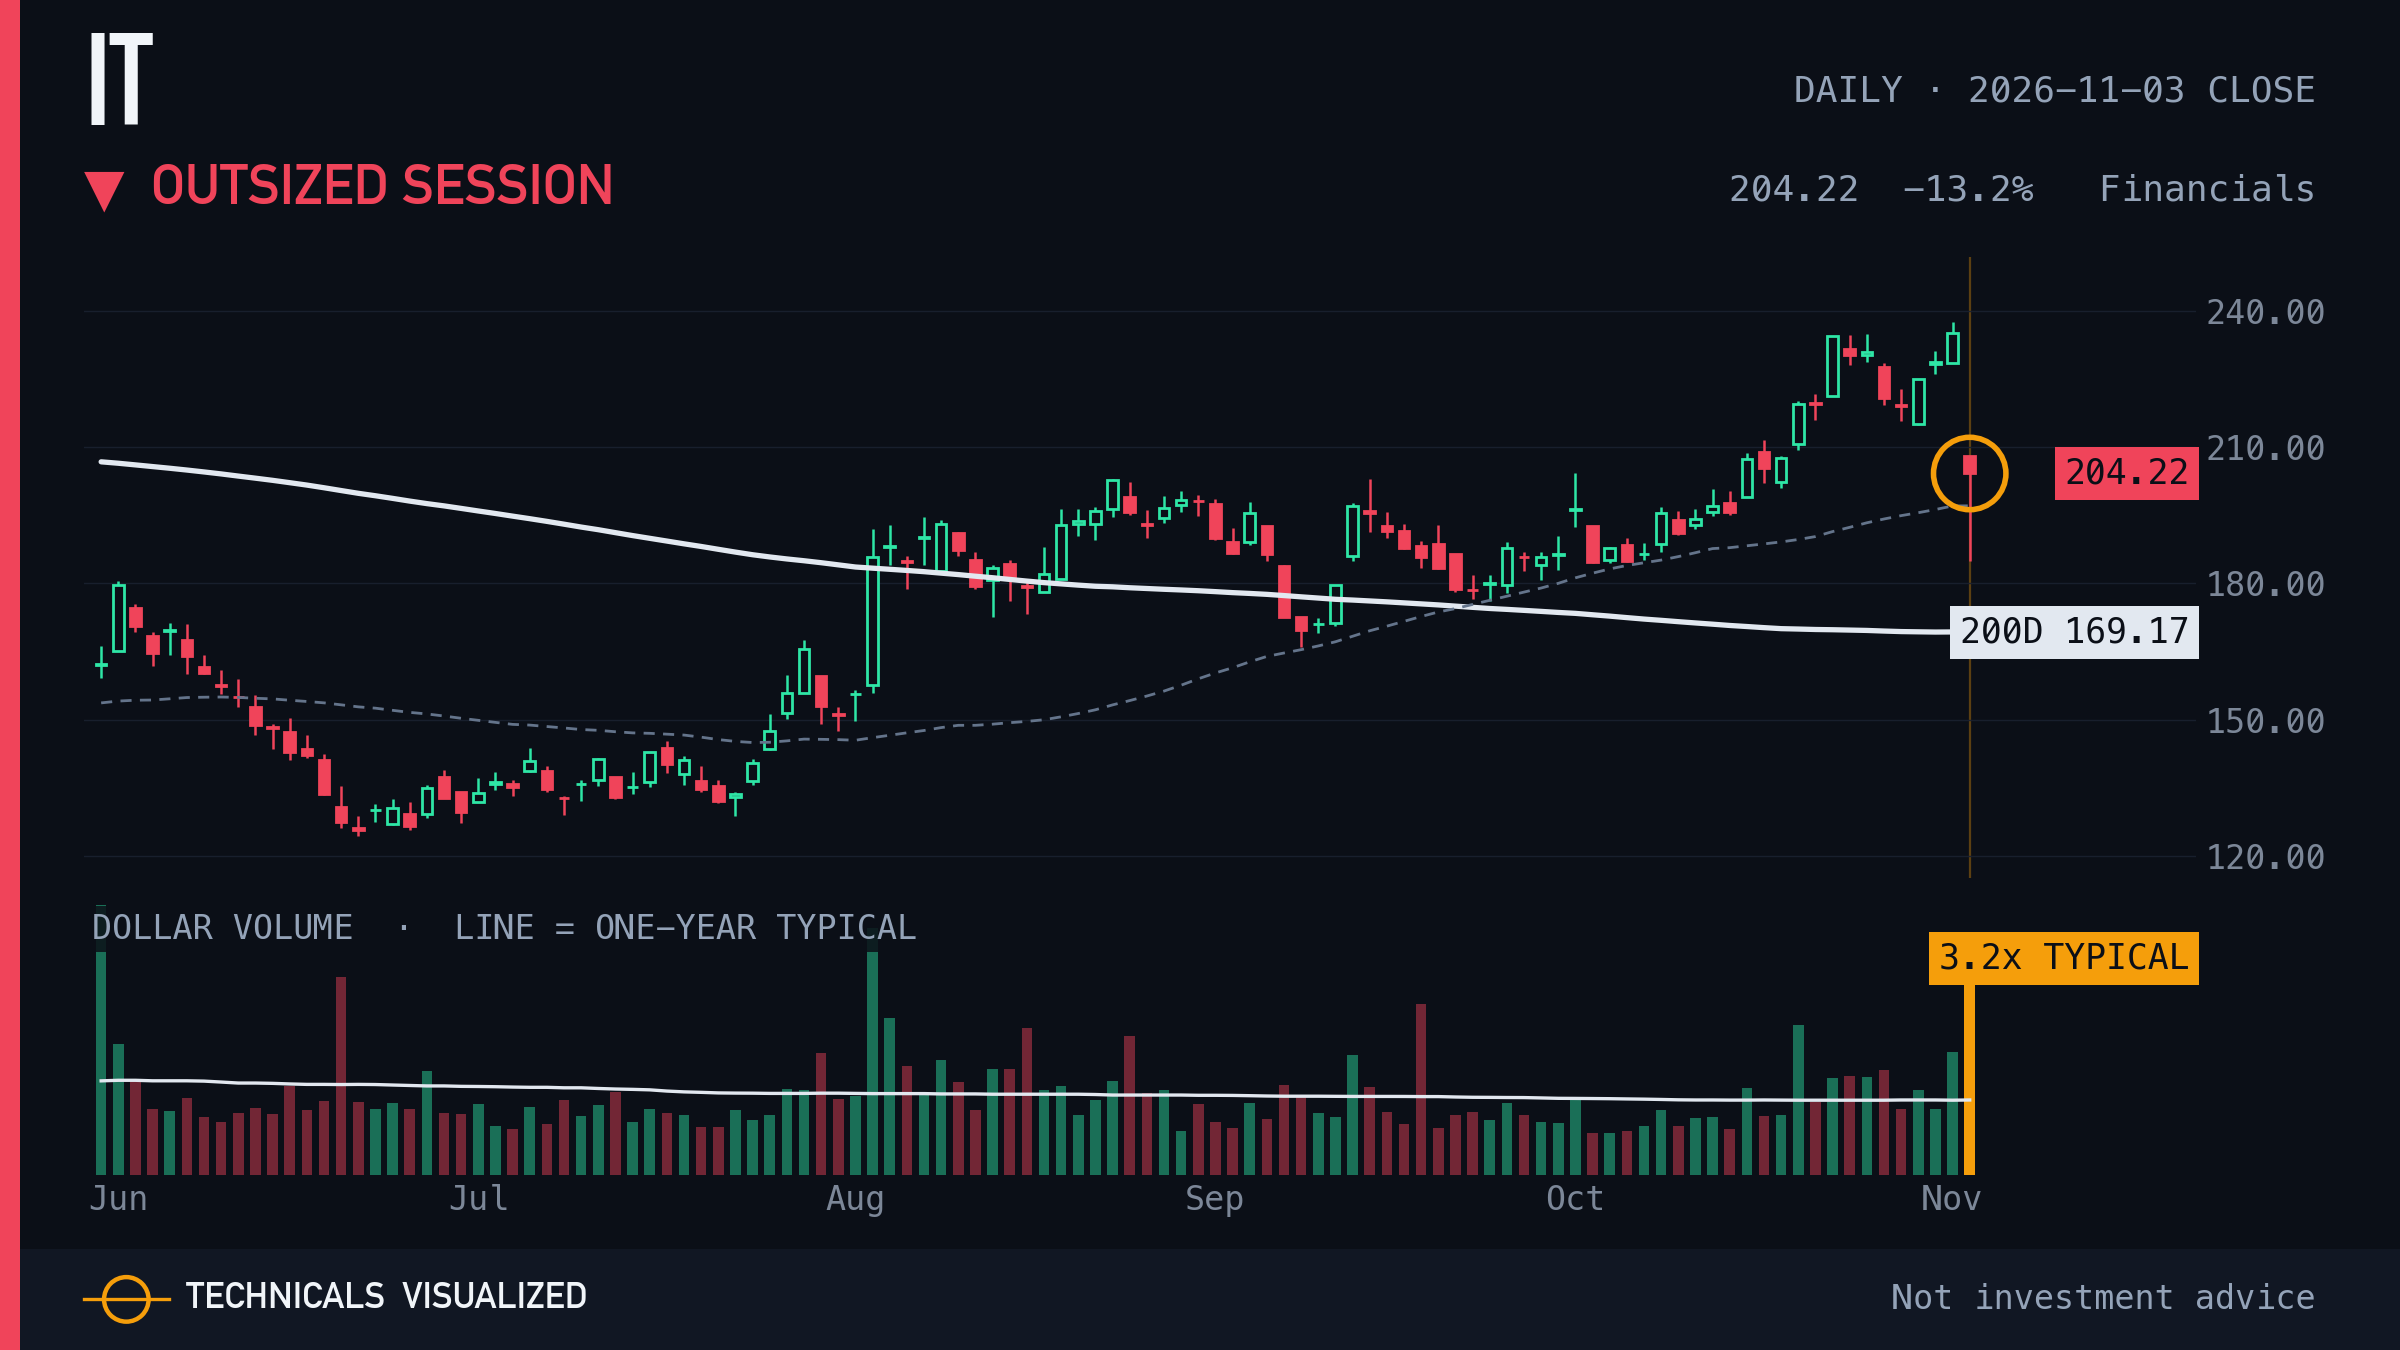
Gartner moved -13.2% in one session, 4.4 times its usual daily move.
One session, measured against this chart's own usual move. It describes the day, not the next one.
|
|
11 · Edwards Lifesciences (EW) · Range breakout
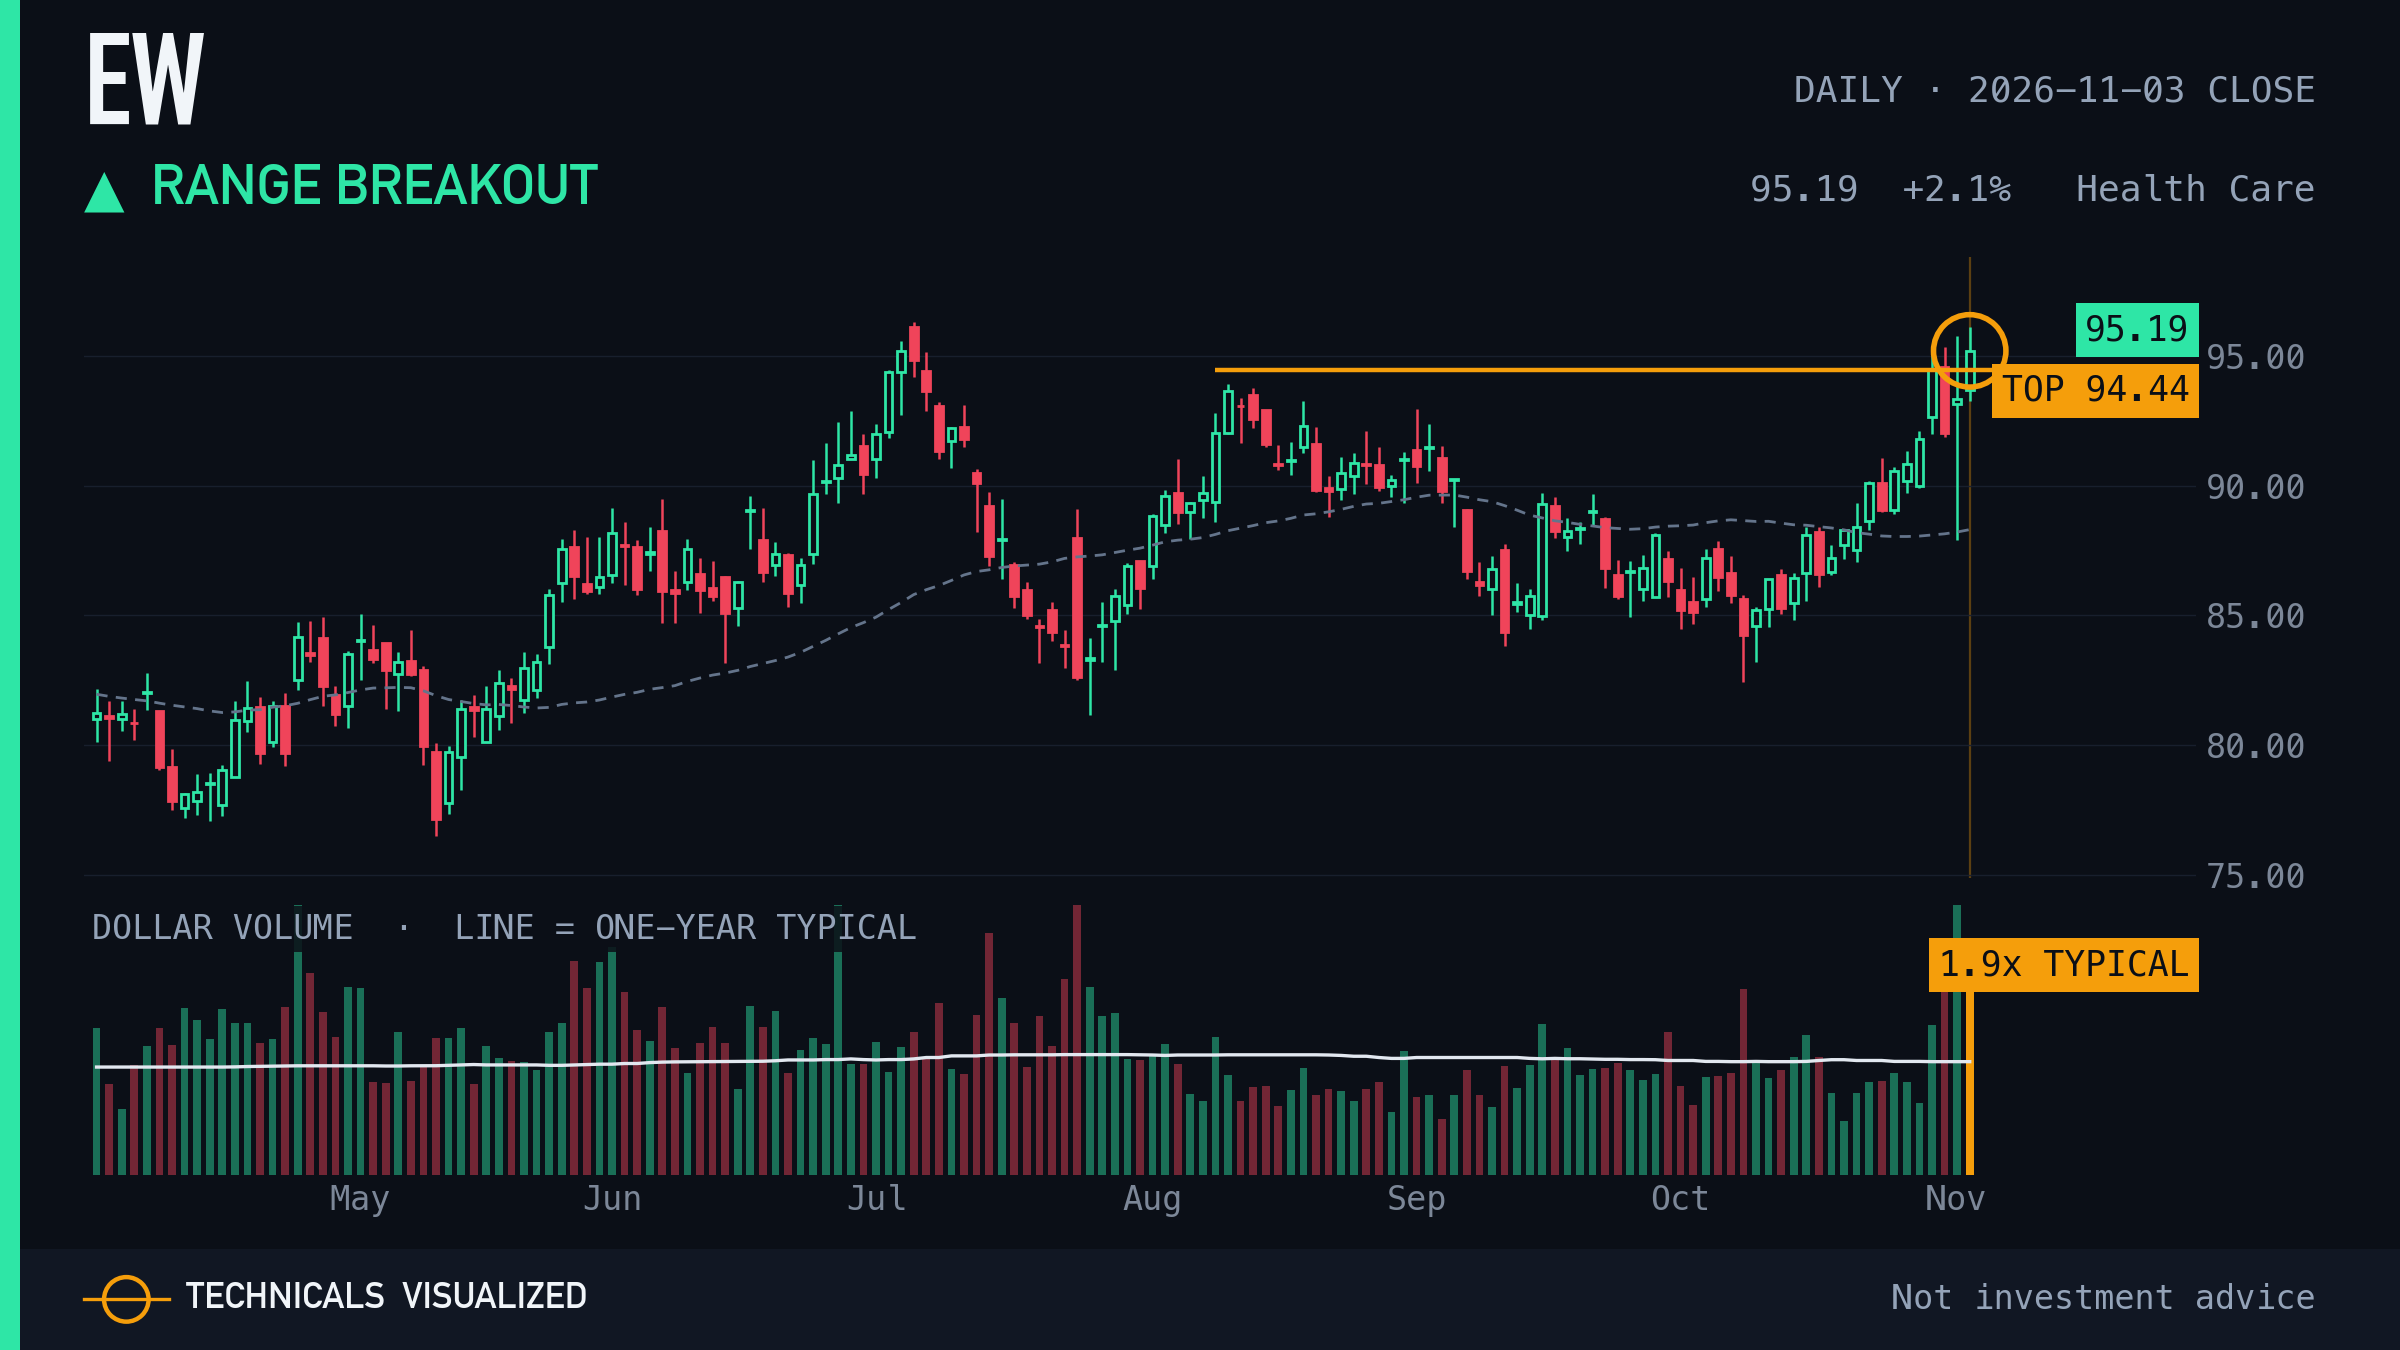
Edwards Lifesciences closed above a 60-session range (12.1% tall, top tested 4 times).
The range top is $94.44. A close back inside the range undoes the break.
|
|
12 · Trane Technologies (TT) · Exhaustion count (daily)
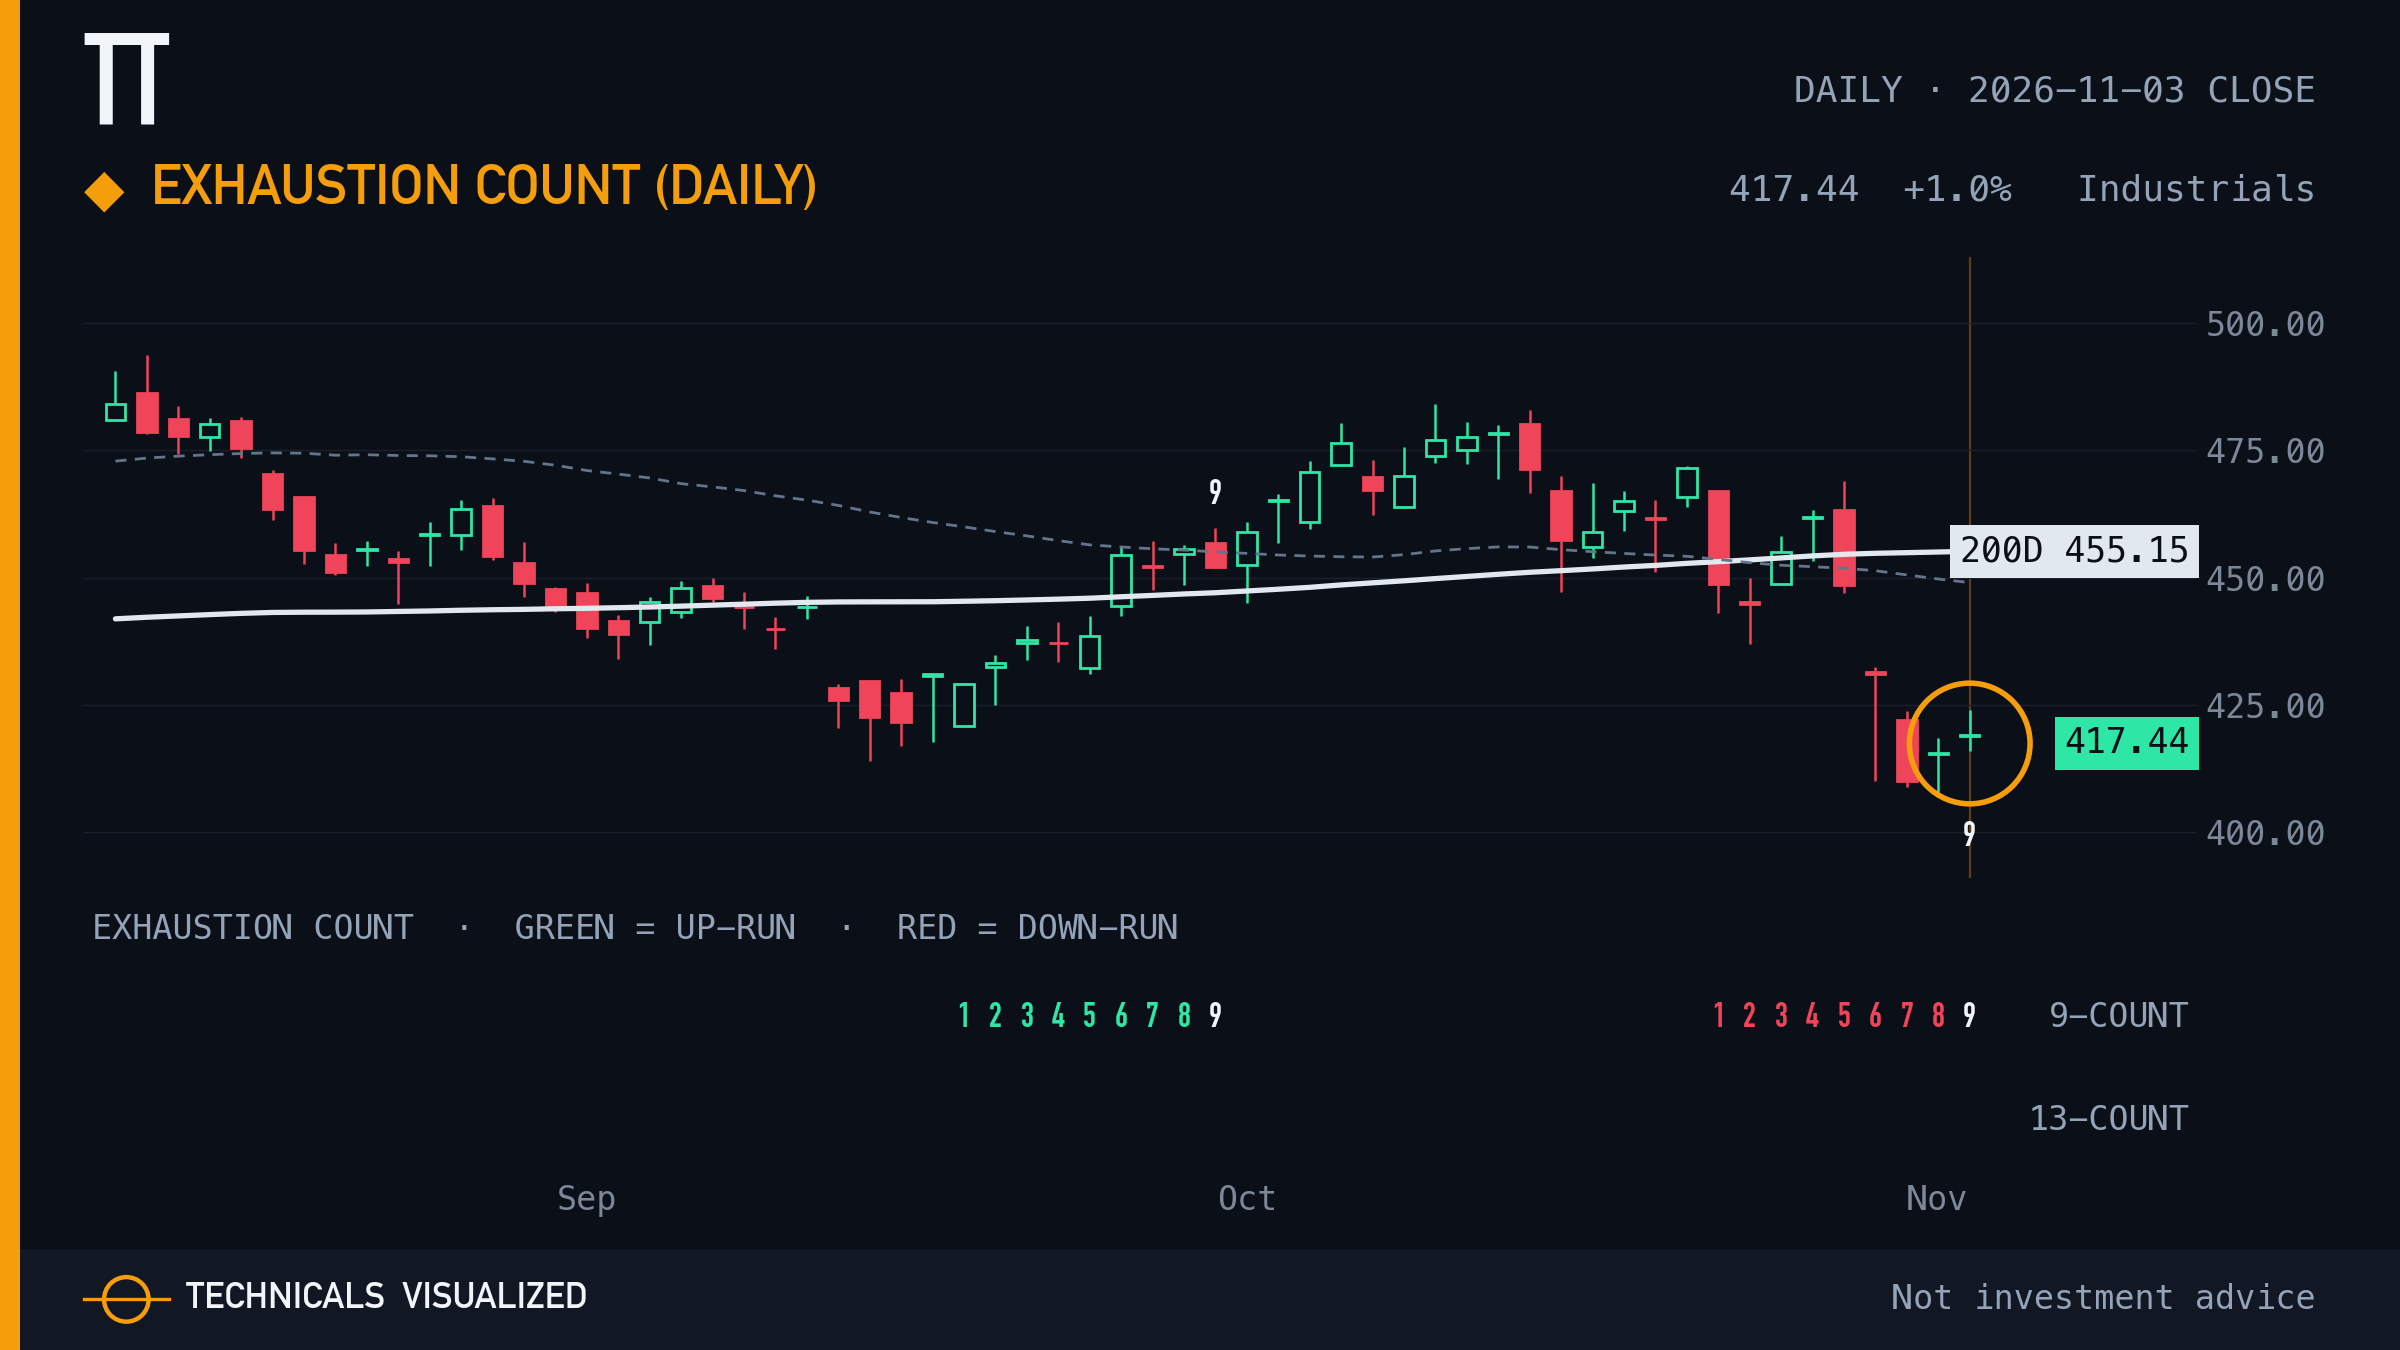
Trane Technologies daily exhaustion count: setup phase complete and qualified (downside count).
A completed setup marks a stretched run. It is a pause marker, not a turn signal.
|
|
13 · Bristol-Myers Squibb (BMY) · Exhaustion count (daily)
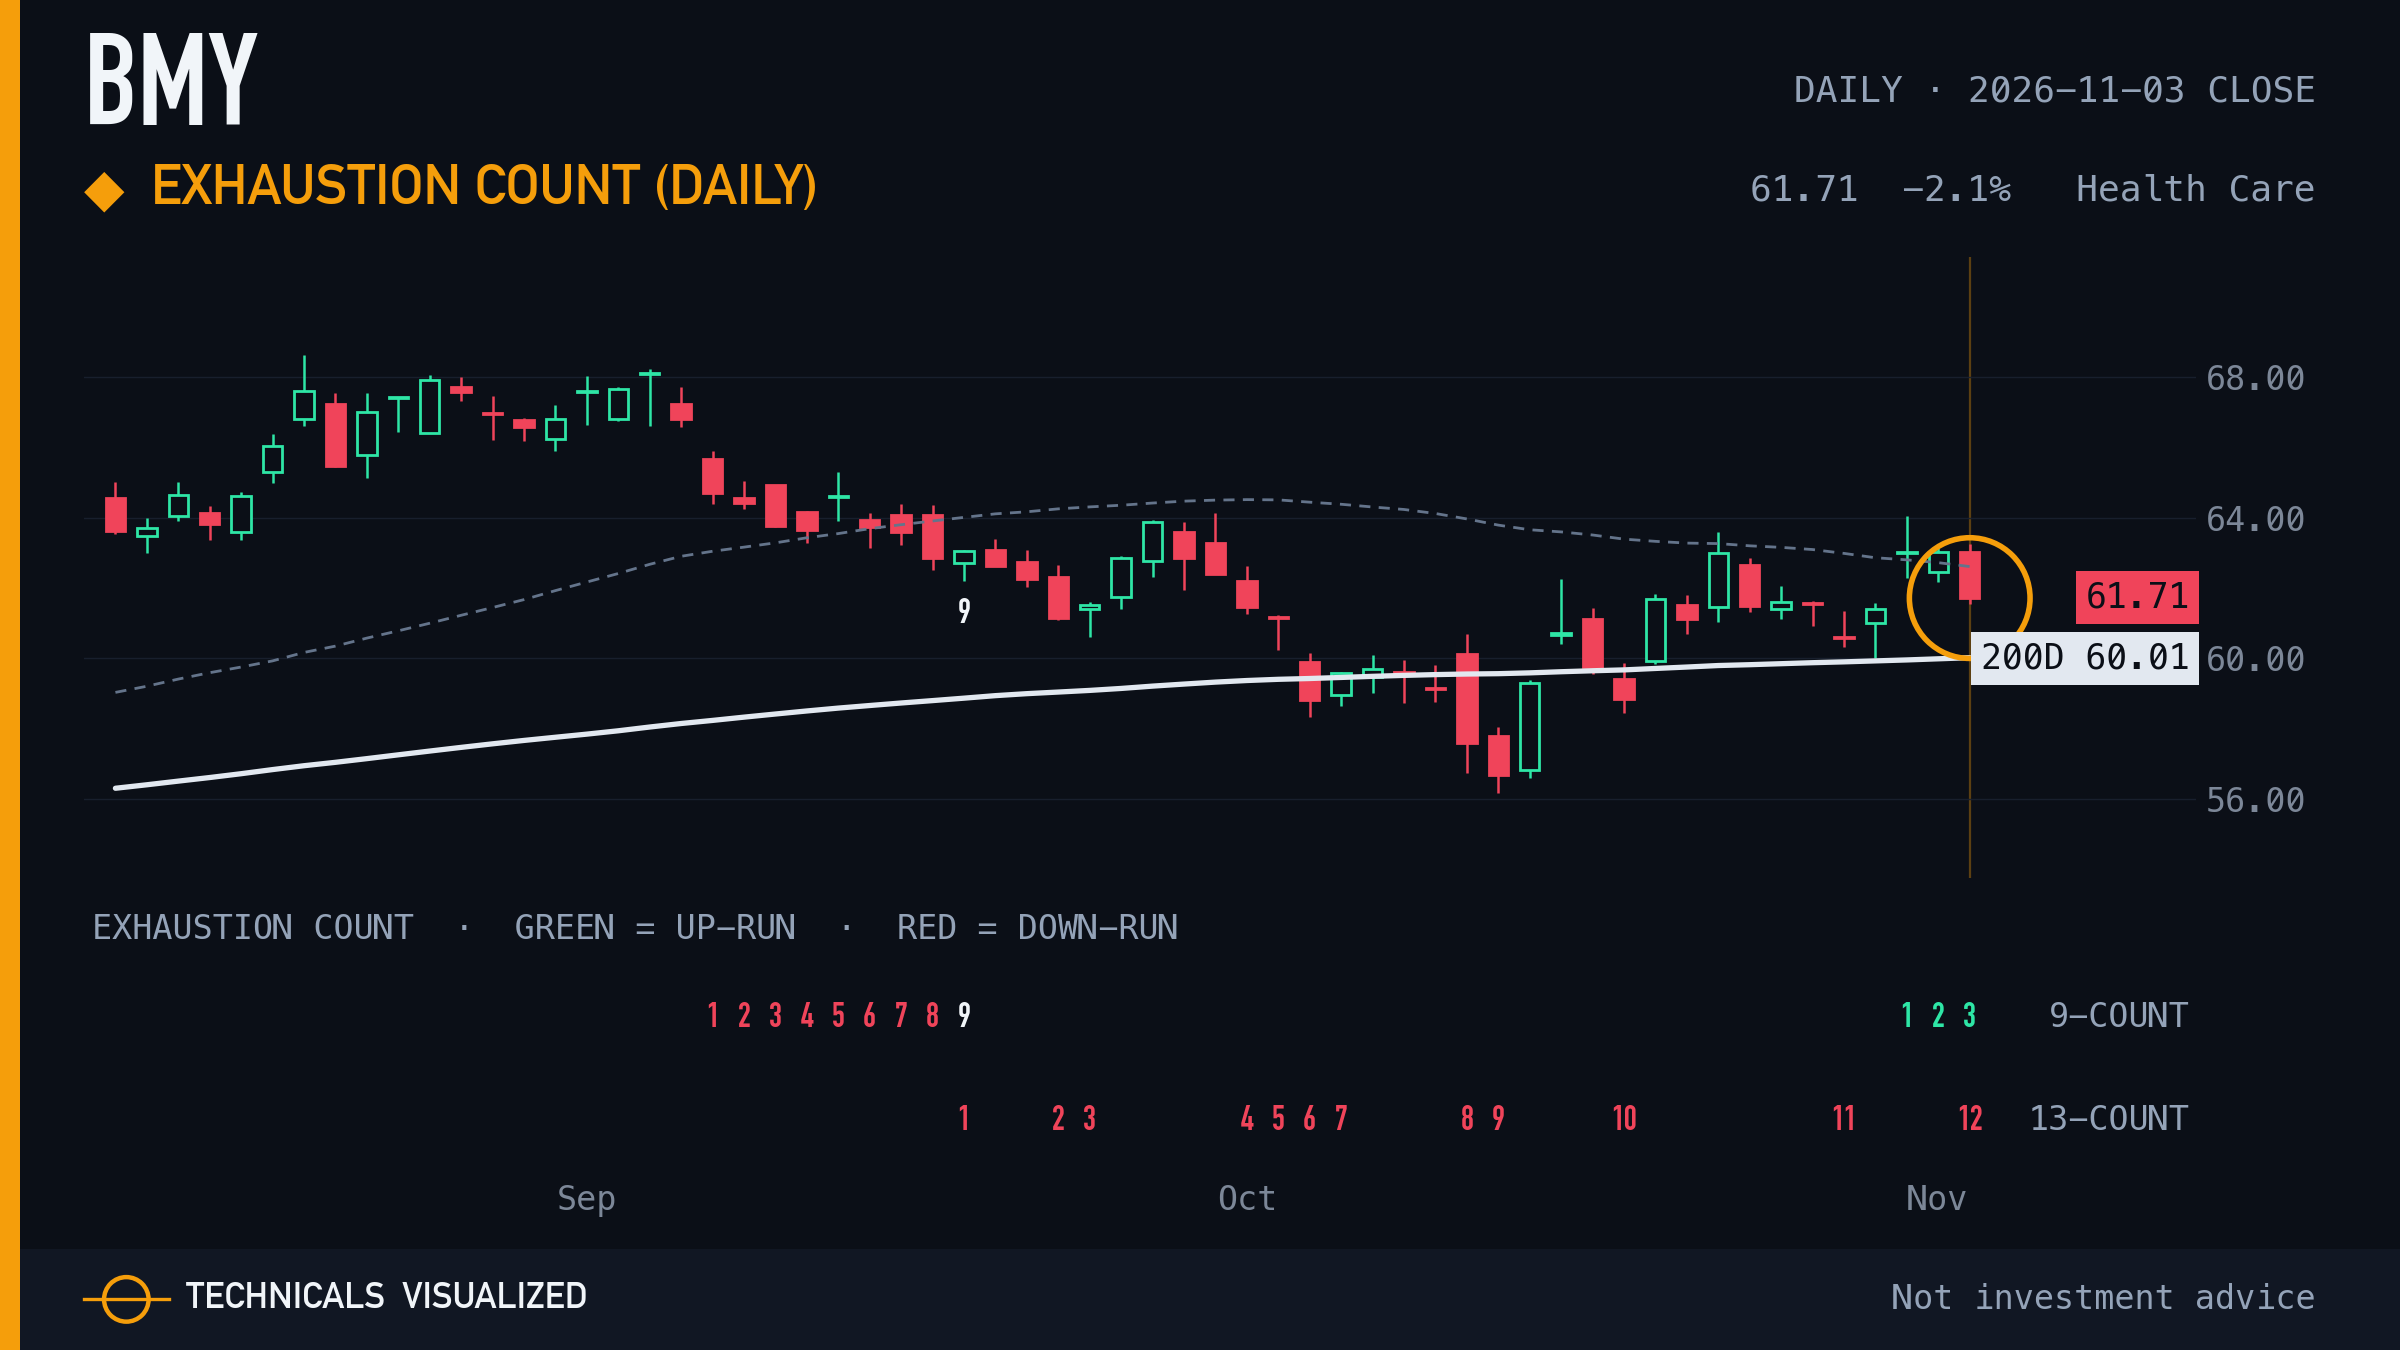
Bristol-Myers Squibb daily exhaustion count: count at 12 of 13 (downside count).
One bar short of a completed count. A count marks a stretched move, not a turn signal.
|
|
14 · DuPont de Nemours (DD) · Outsized session
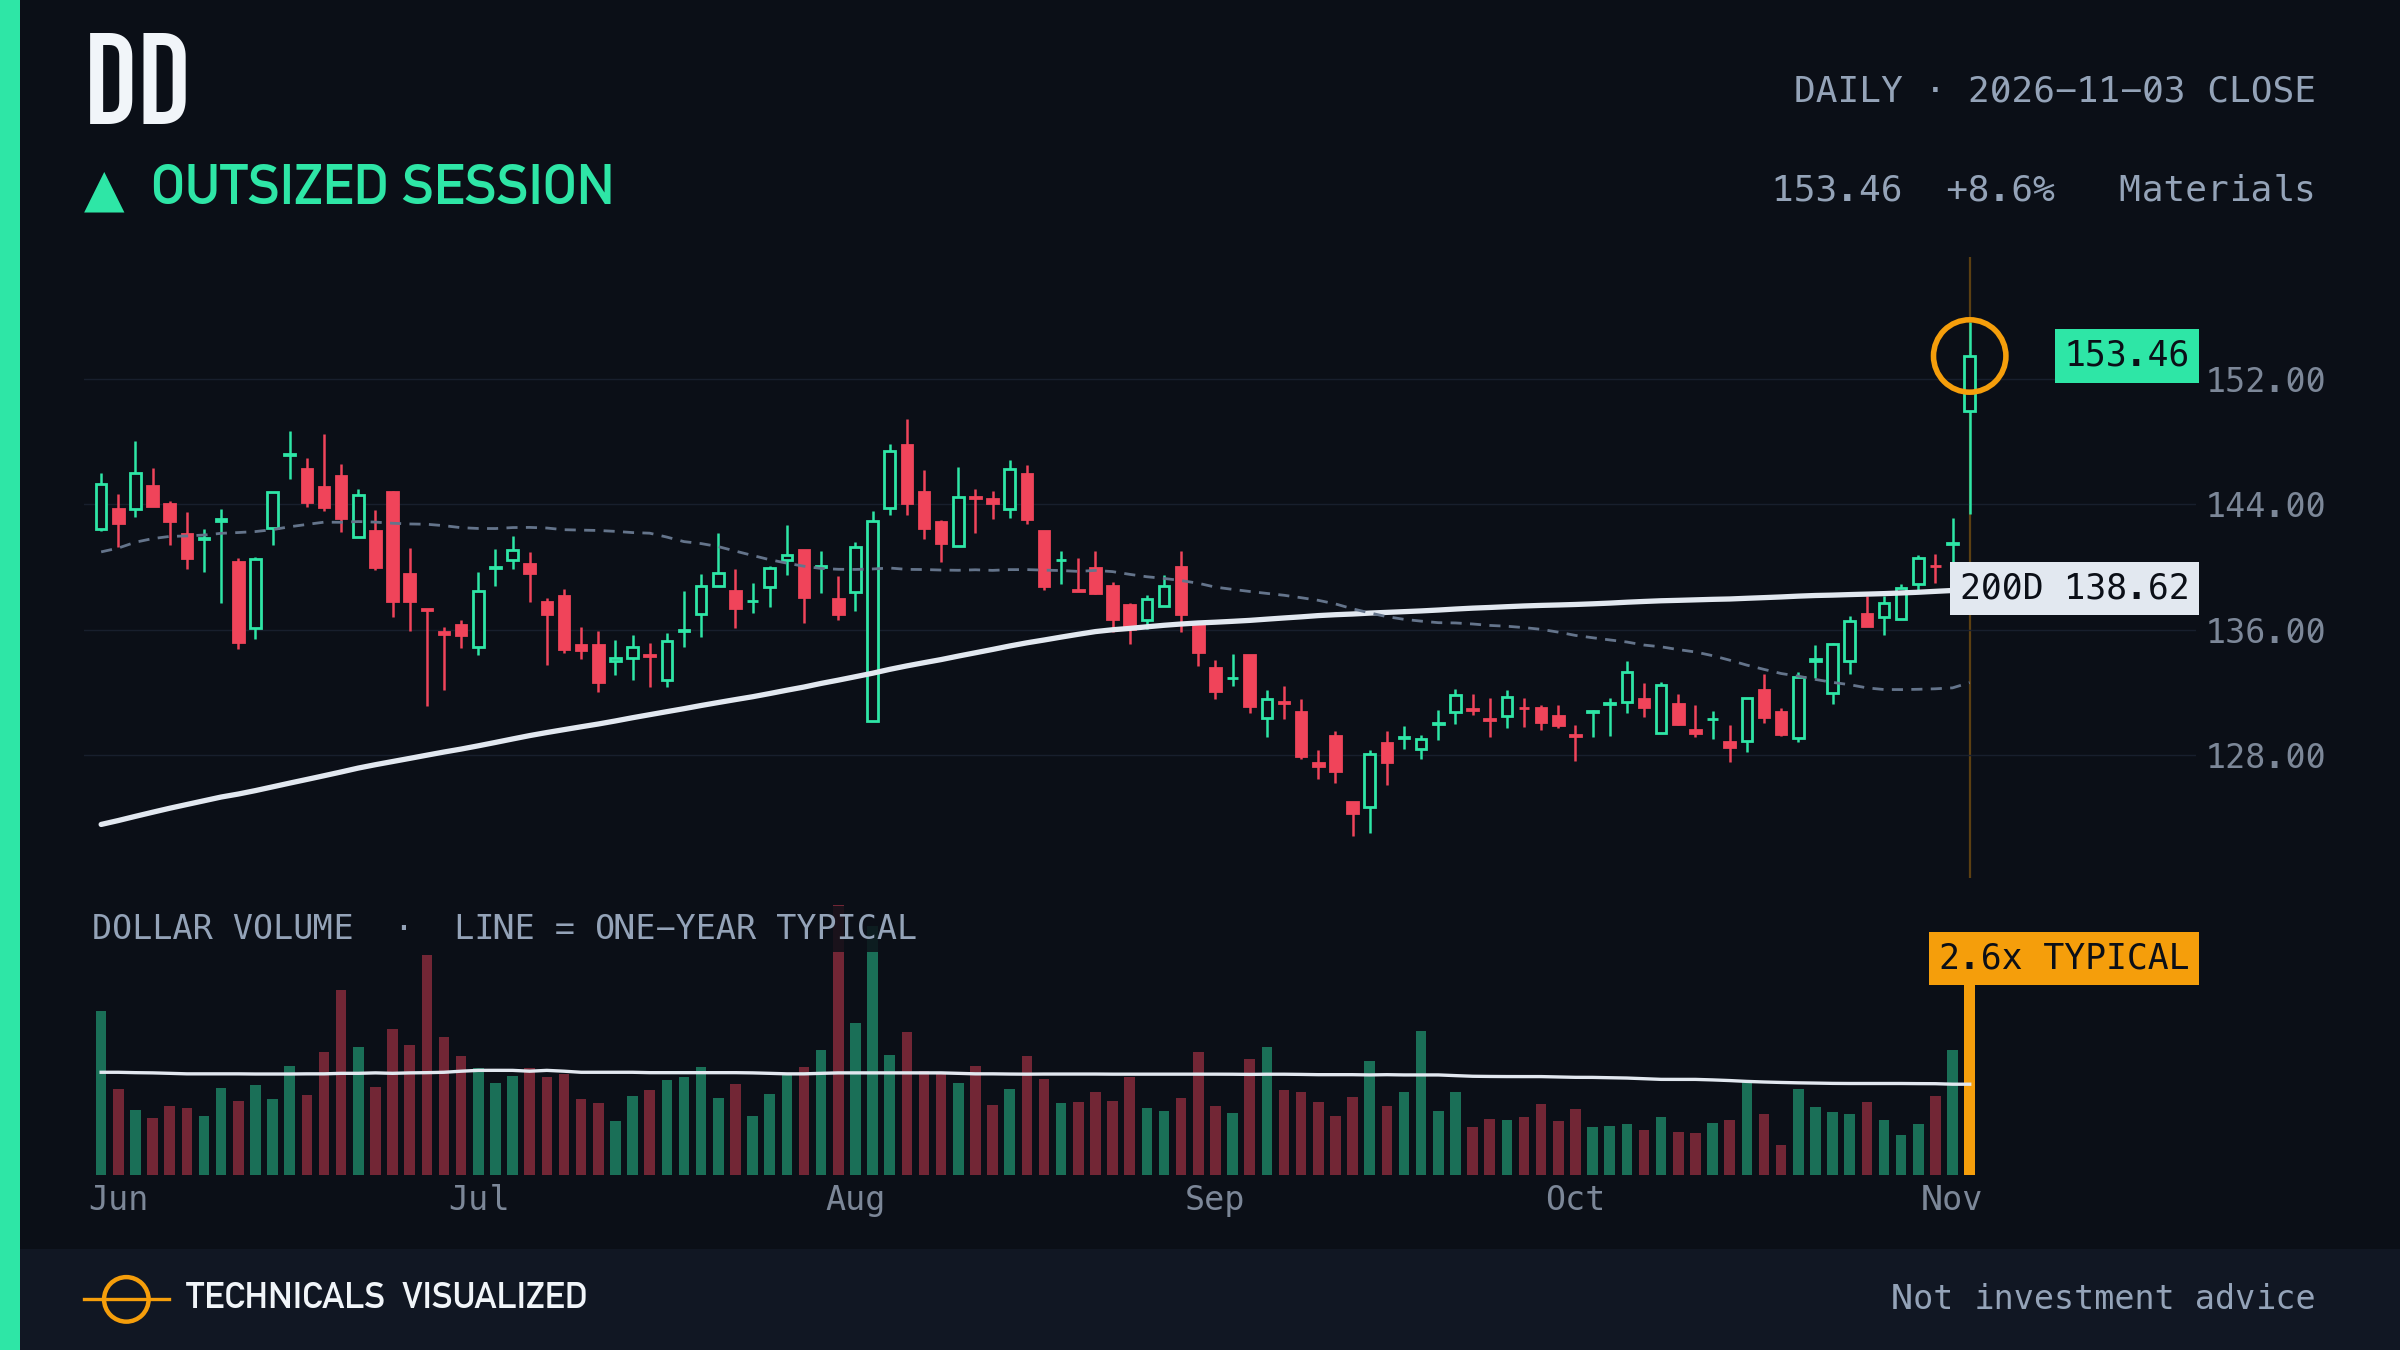
DuPont de Nemours moved +8.6% in one session, 6.4 times its usual daily move.
One session, measured against this chart's own usual move. It describes the day, not the next one.
|
|
15 · VeriSign (VRSN) · New 52-week high
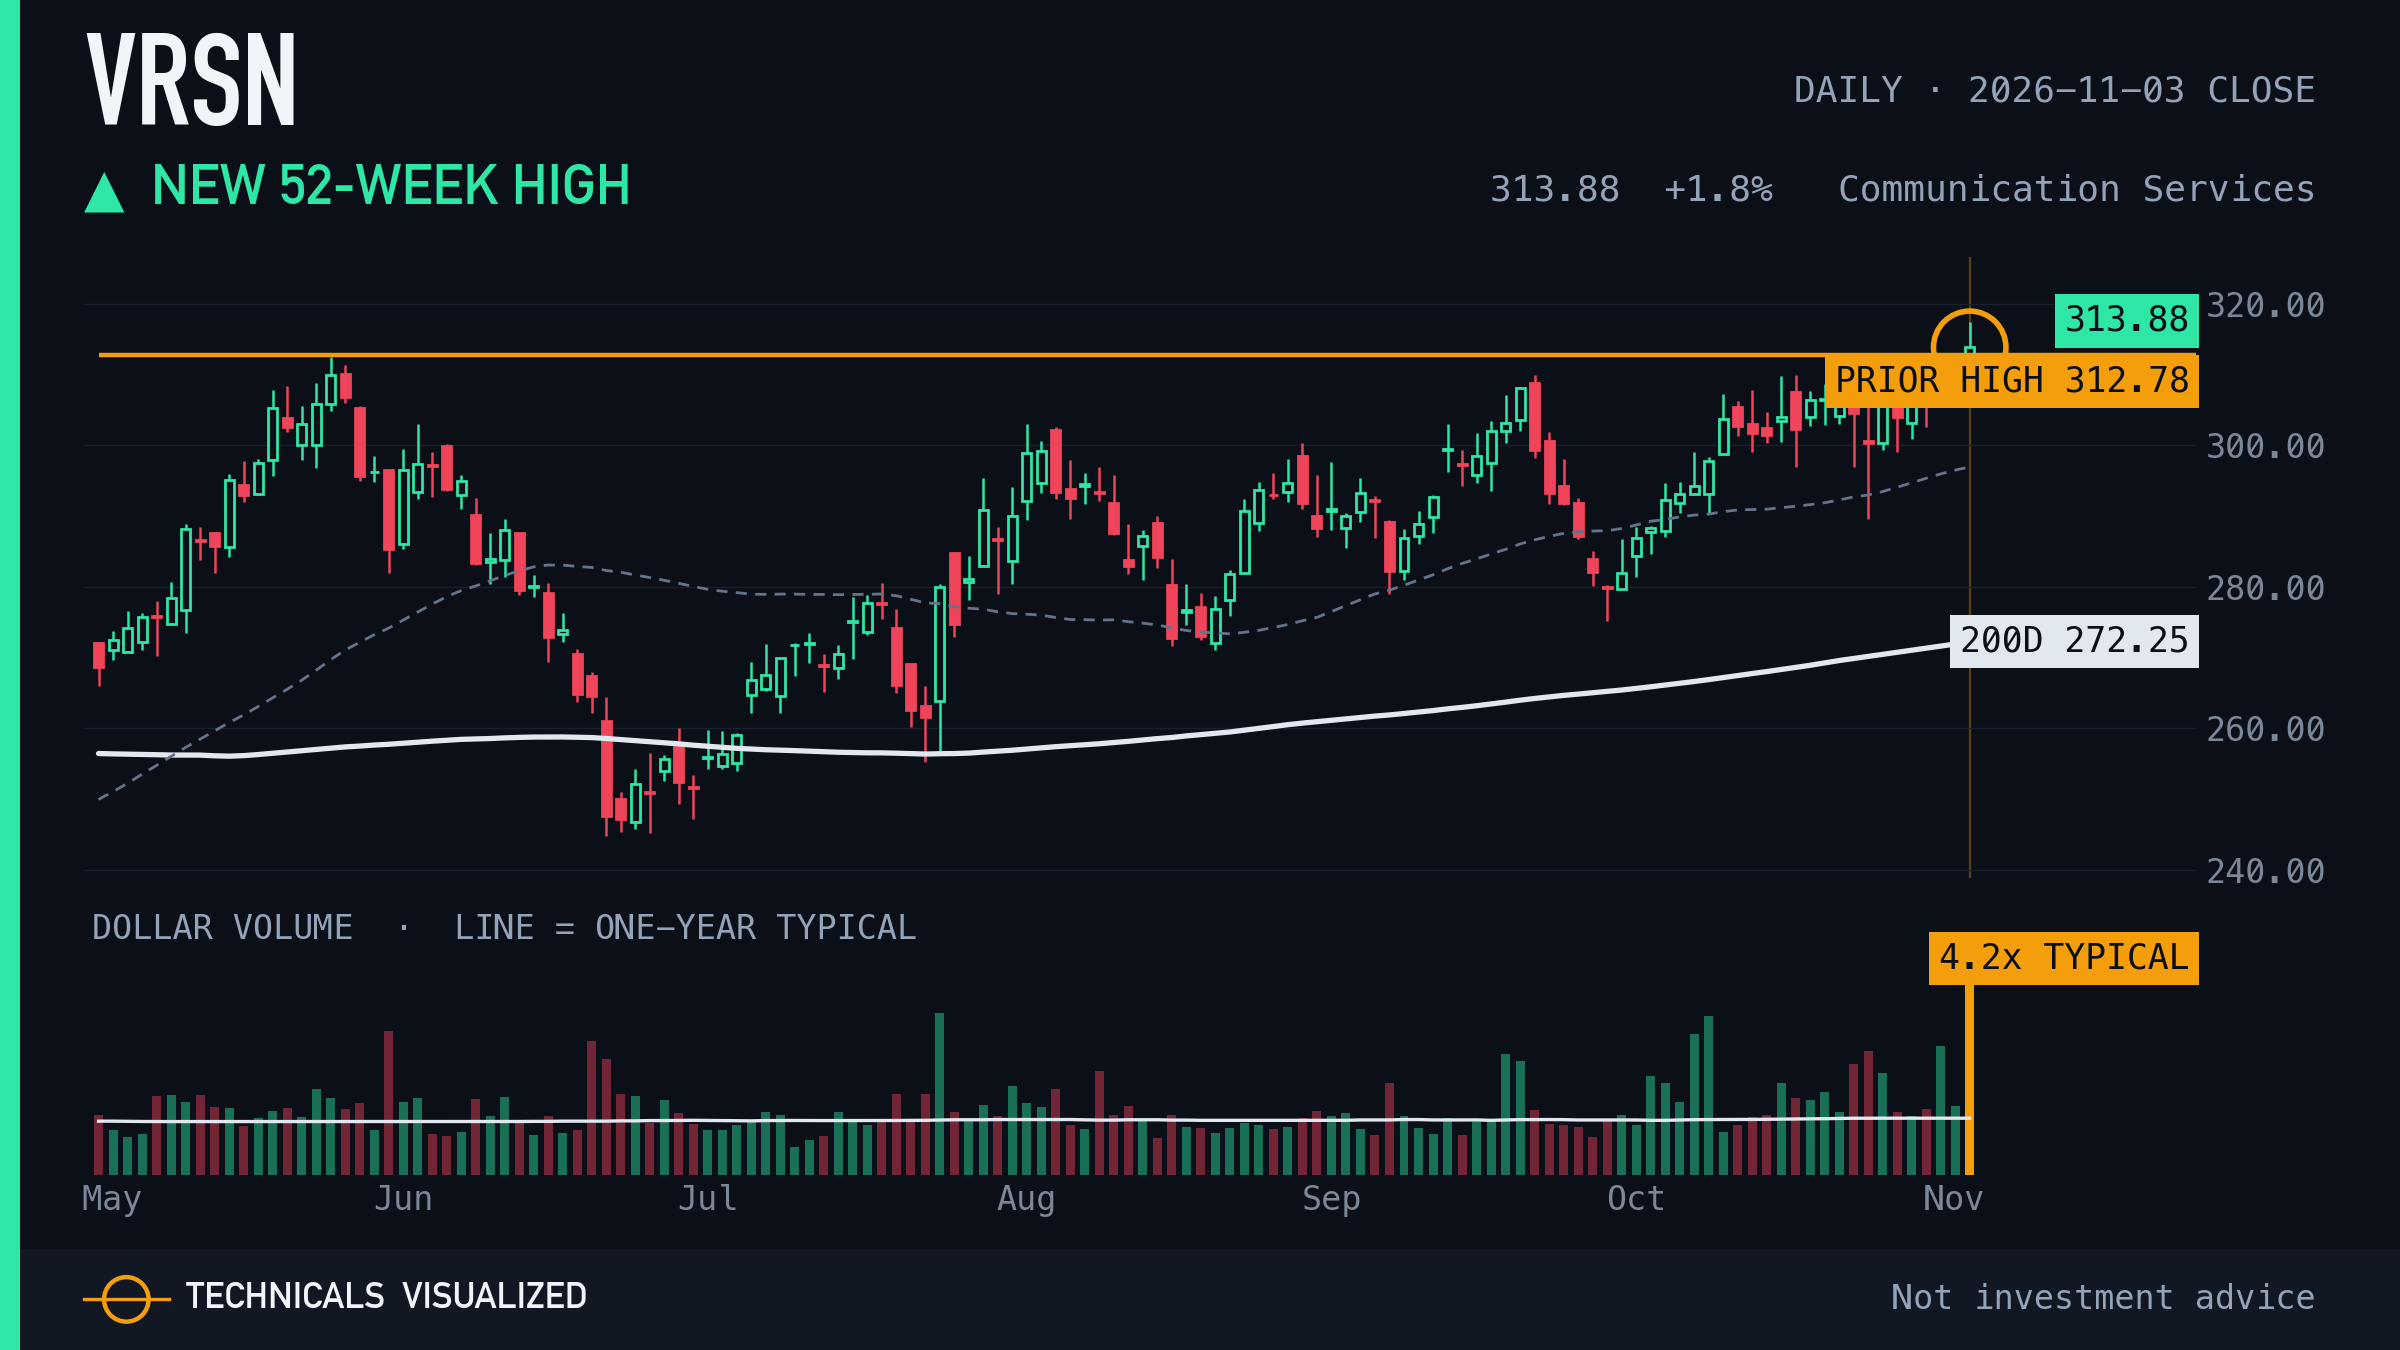
VeriSign closed at an all-time high, above the prior 52-week high (first such close in 320 sessions).
The prior 52-week high was $312.78.
|
|
16 · Axon Enterprise (AXON) · Exhaustion count (daily)
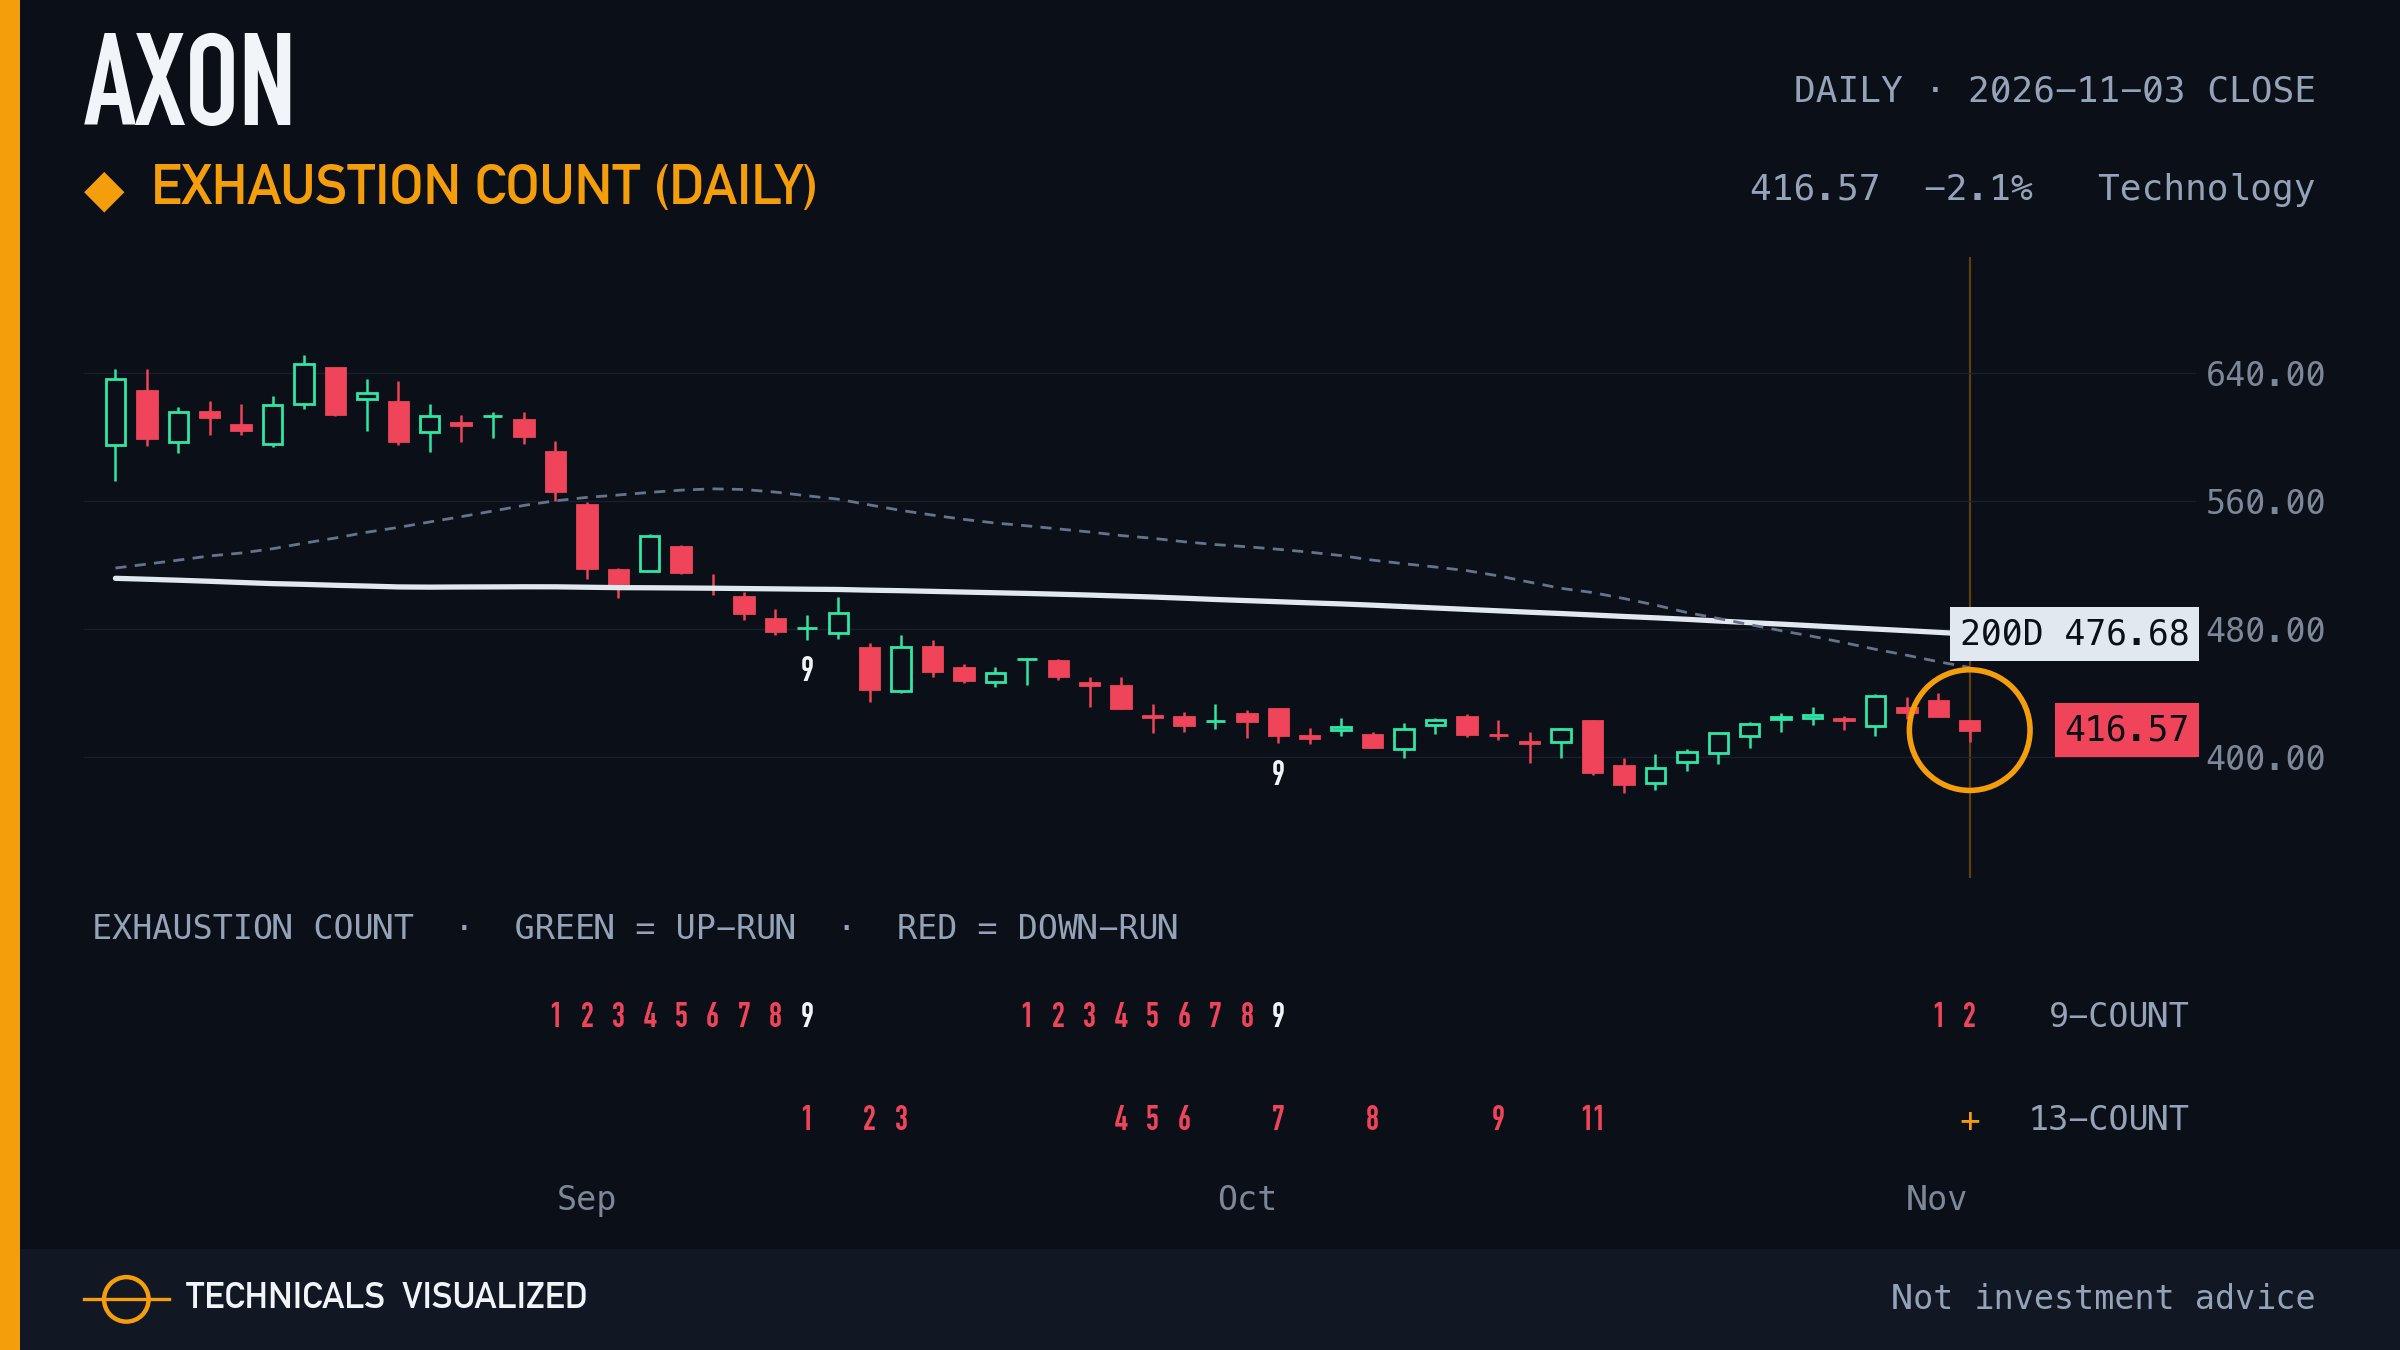
Axon Enterprise daily exhaustion count: 13 reached, final condition pending (downside count).
A completed count marks a stretched move. It is a pause marker, not a turn signal.
|
|
17 · Ecolab (ECL) · Exhaustion count (daily)
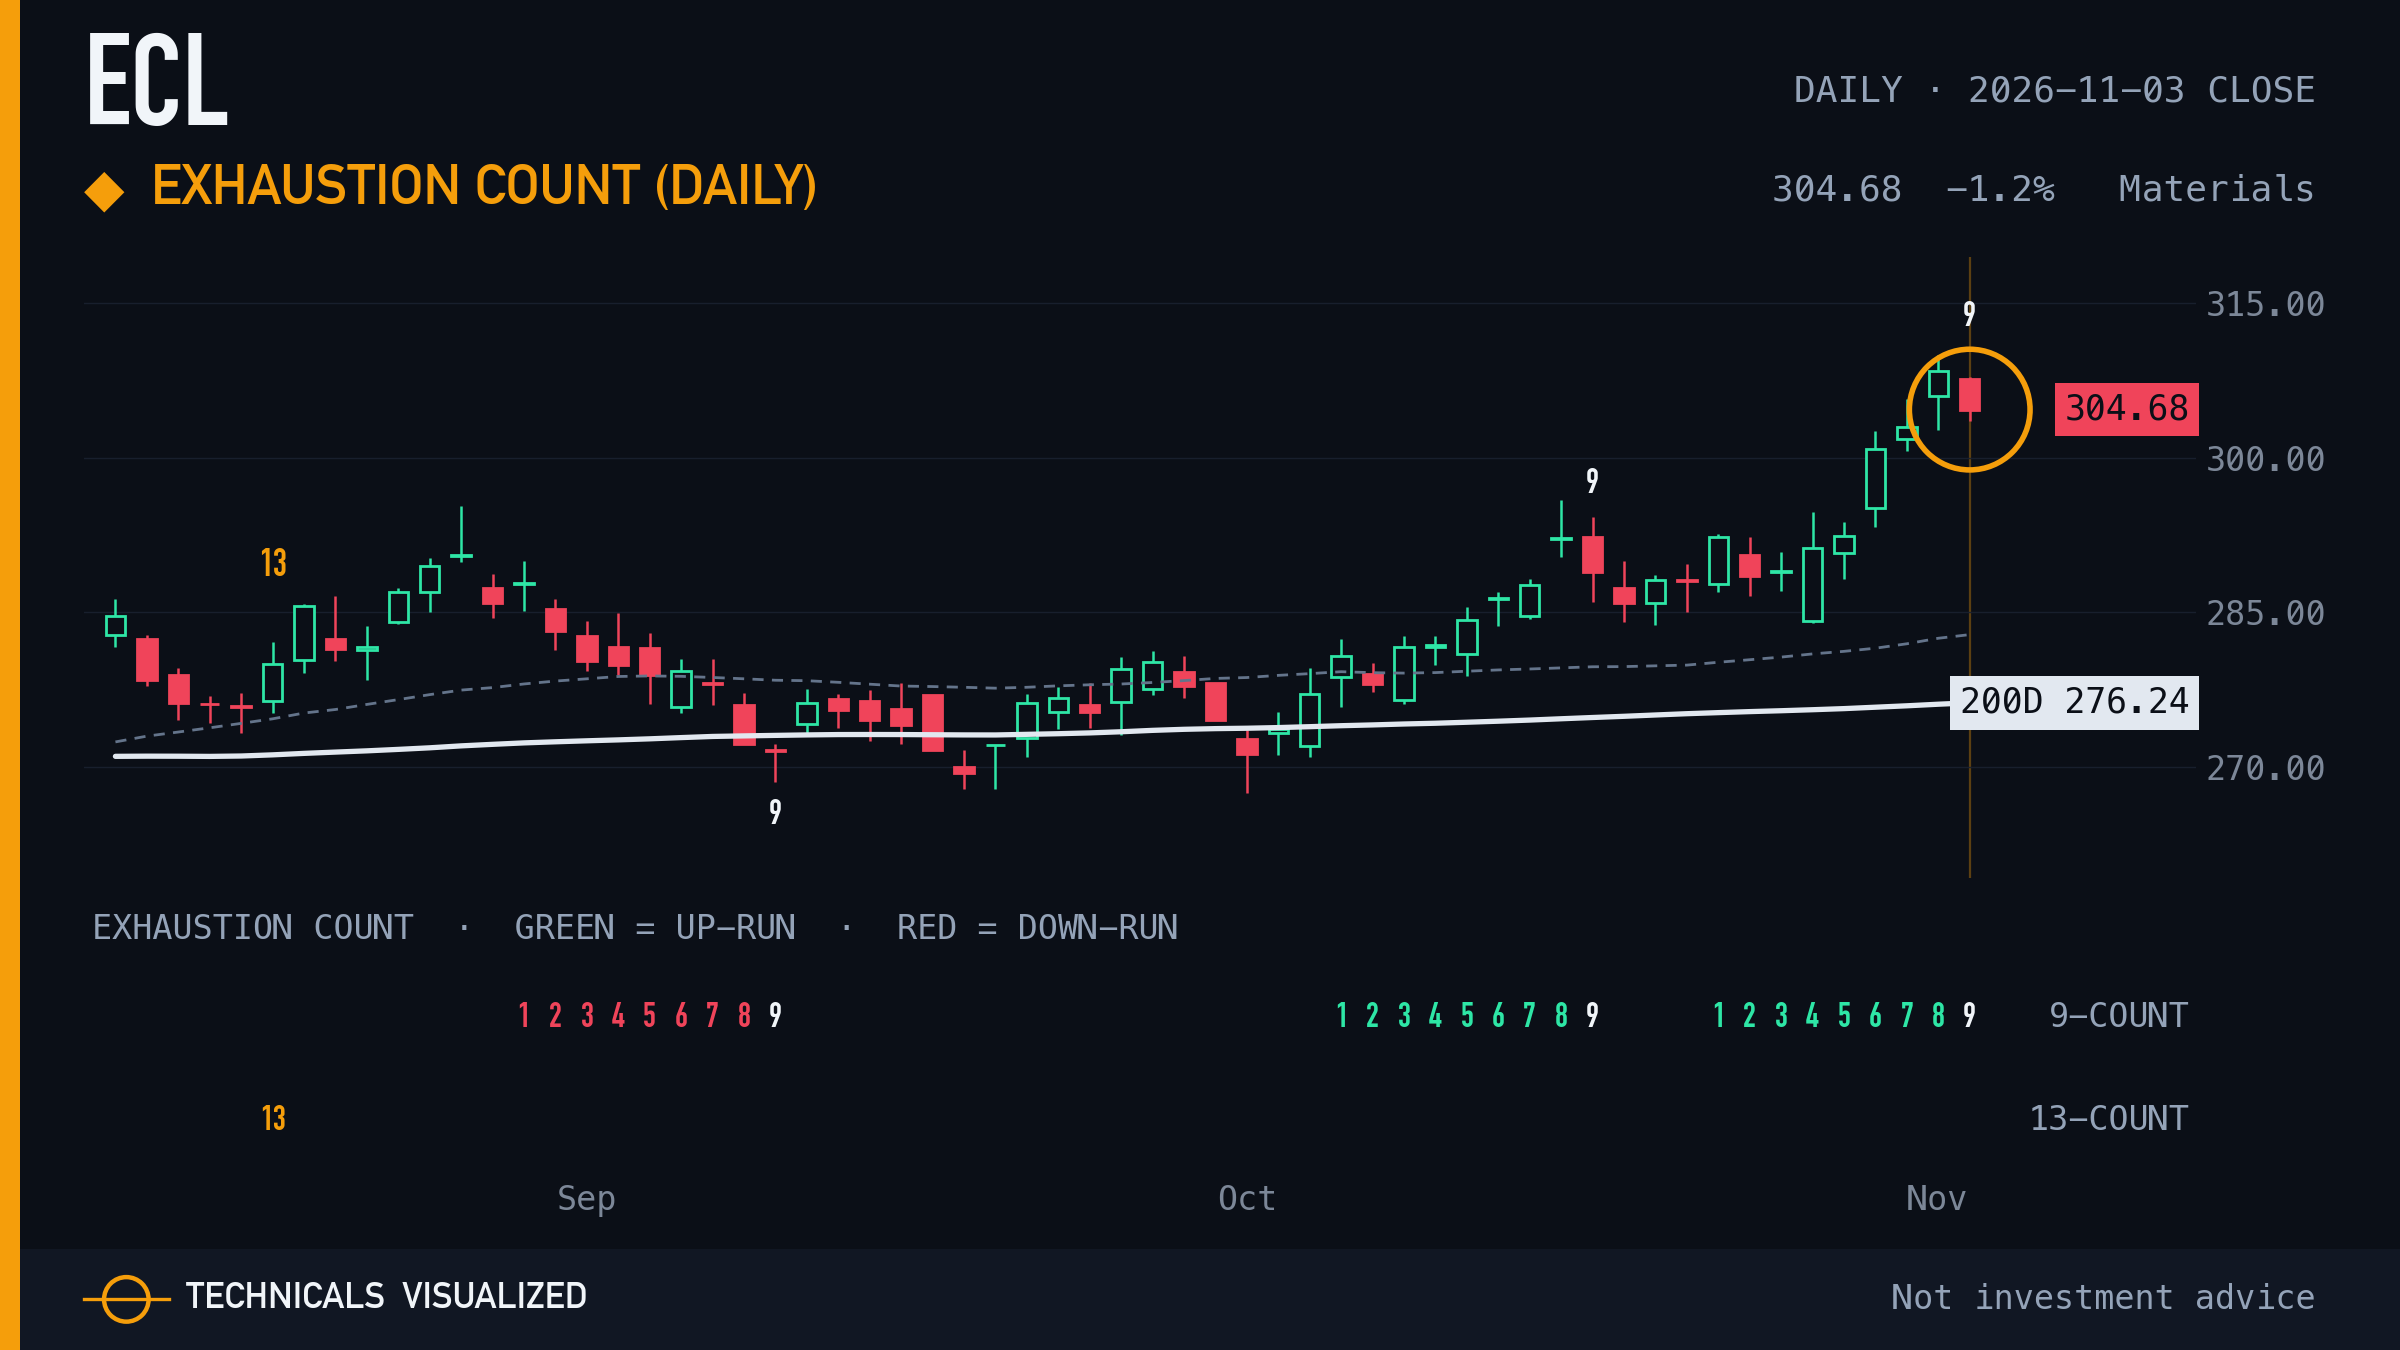
Ecolab daily exhaustion count: setup phase complete and qualified (upside count).
A completed setup marks a stretched run. It is a pause marker, not a turn signal.
|
 TECHNICALS VISUALIZED