 TECHNICALS VISUALIZED
A custom chart deck, built around your question
You write the question the way you would ask an analyst. We send back a PDF deck: the charts, the past episodes that match, and the numbers behind them, one idea per page.
One deck: one question, up to 3 tickers, up to 10 pages. 3 business days after you approve the scope. We confirm the scope and the price by email first; nothing is charged until you accept.
Here is the prompt
A real request from this week, lightly edited:
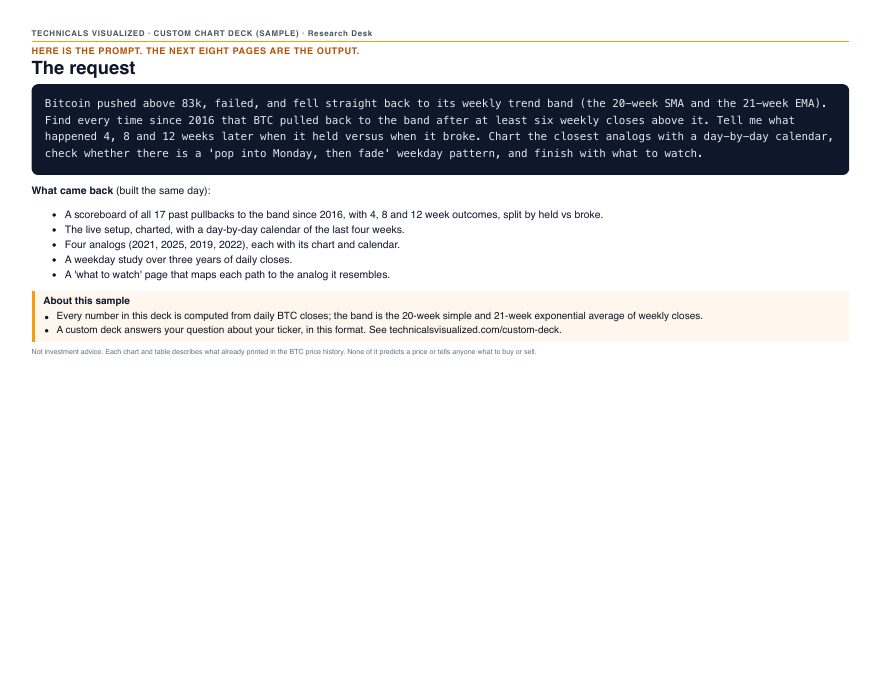
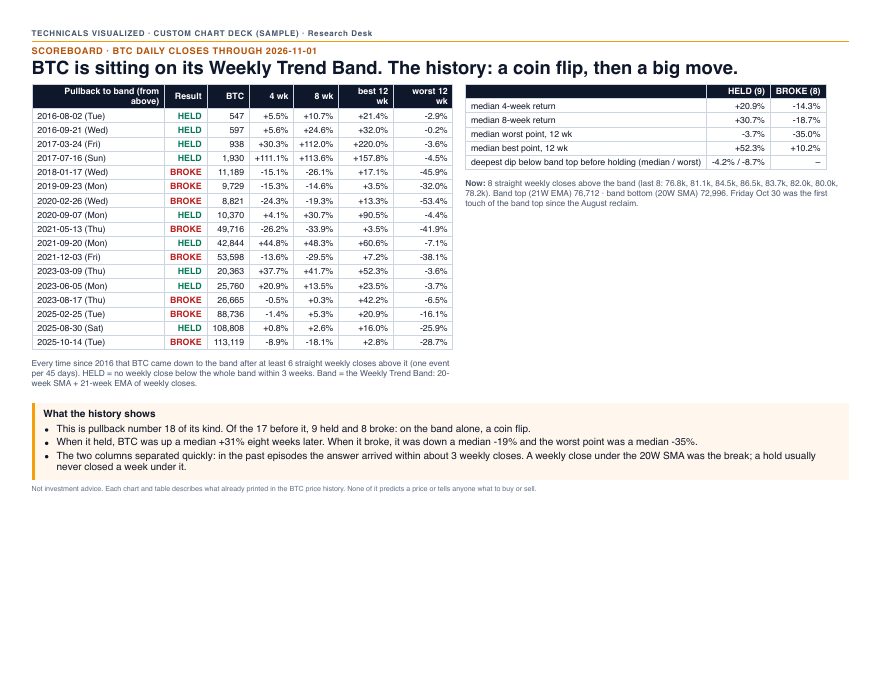
Bitcoin pushed above 83k, failed, and fell straight back to its weekly trend band (the 20-week SMA and the 21-week EMA). Find every time since 2016 that BTC pulled back to the band after at least six weekly closes above it. Tell me what happened 4, 8 and 12 weeks later when it held versus when it broke. Chart the closest analogs with a day-by-day calendar, check whether there is a 'pop into Monday, then fade' weekday pattern, and finish with what to watch.
Here is the output
A nine-page deck, built the same day. Four of its pages are below; the whole deck is a free PDF.
What a deck can answer
- "Every time this happened before, what came next?" Past episodes found by rule, with their 4, 8 and 12 week outcomes.
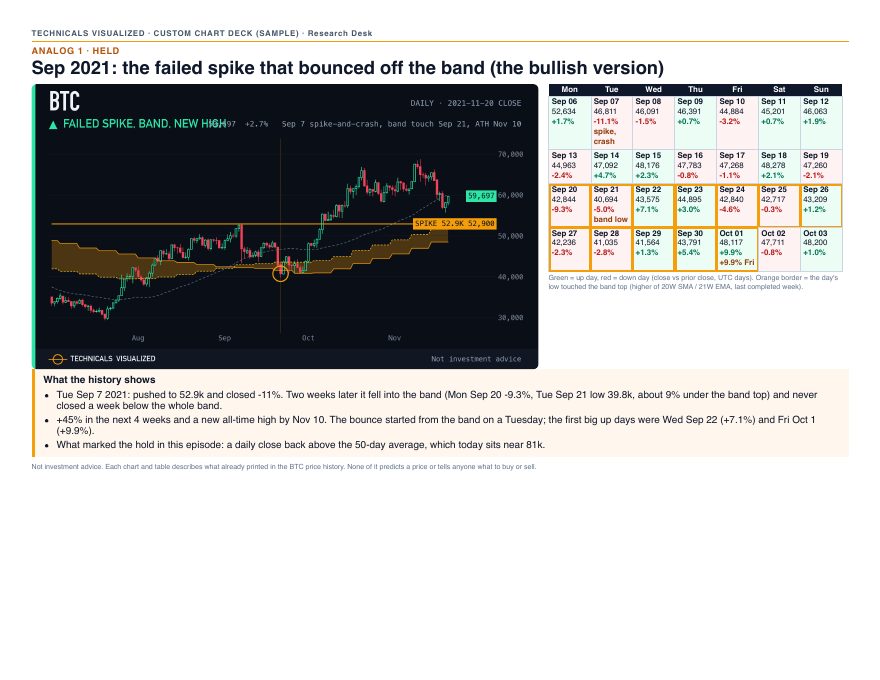
- "Show me the closest analogs." Each one charted, with a day-by-day calendar of the weeks that mattered.
- "Is there a pattern by weekday, by month, around an event?" Counted over the history, with the sample size printed.
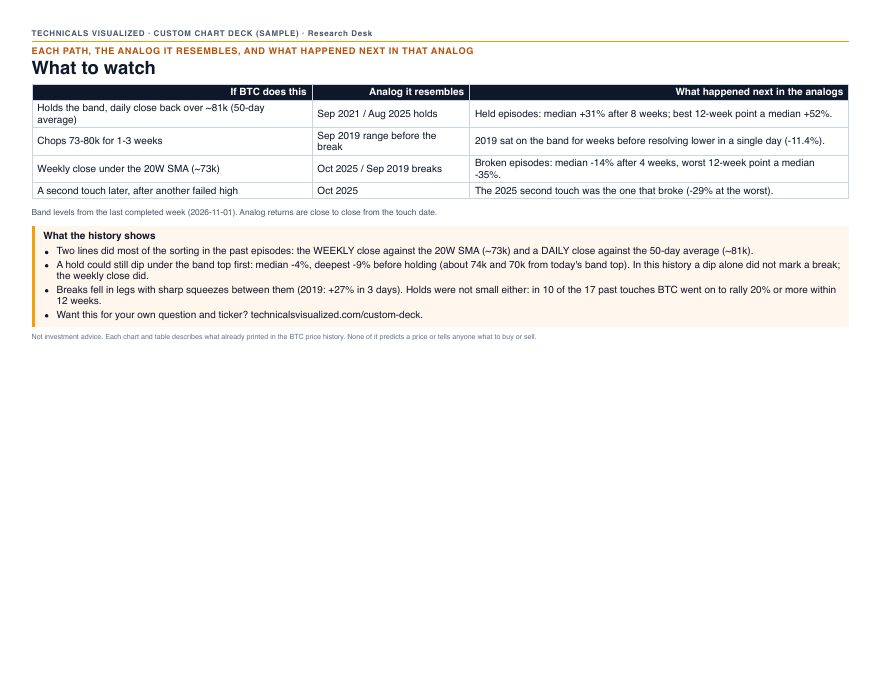
- "Which levels does the history key on?" The averages and swing levels that sorted the past episodes.
What to put in the request
- The ticker or tickers (stocks, ETFs, indices and the major cryptocurrencies we draw).
- The question, in your own words. A situation you are looking at is better than a list of indicators.
- The timeframe you care about (days, weeks or years) and anything you want left out.
What we will not do
A deck describes what already printed in the price history. It does not predict a price, and it does not tell anyone what to buy or sell or whether something suits their situation.